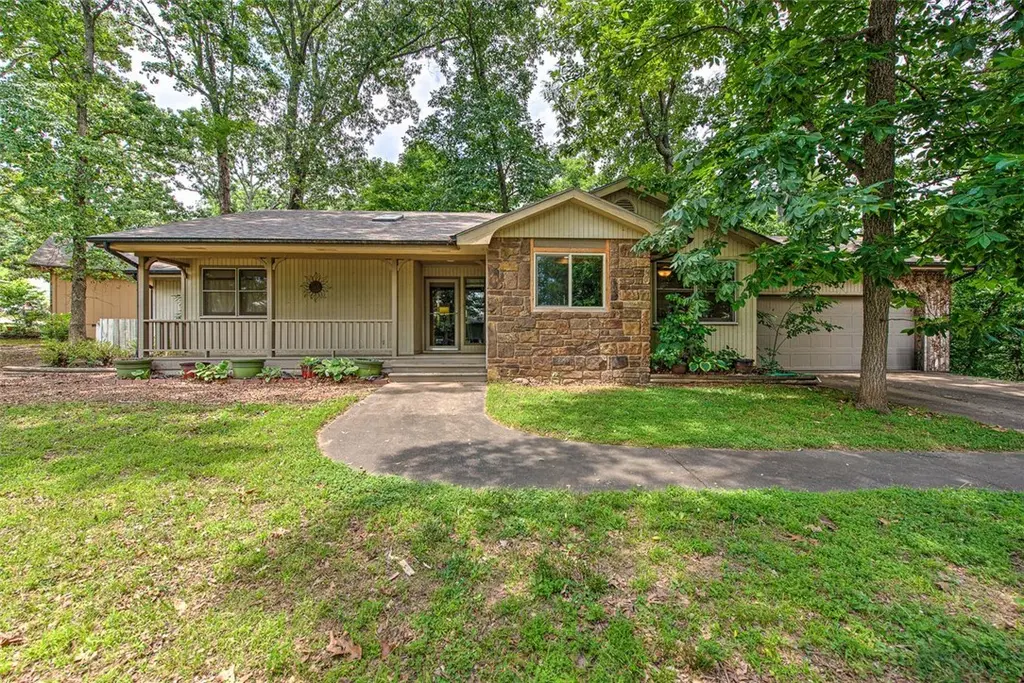
37 Fenchurch Dr · Bella Vista, AR
Flood risk 1/10 · Minimal
- FEMA flood zone
- X (unshaded)
- Chance of flooding over 30 yrs
- 0.0%
- Est. flood insurance / yr
- $507 – $1,088
Fire risk 1/10 · Minimal
- Est. fire insurance / yr
- $1,499 – $2,785
Heat risk 5/10 · Moderate
- Hot days now (above 105°F)
- 7 days/yr
- Hot days in 30 yrs
- 20 days/yr
Wind risk 2/10 · Minimal
- Chance of severe wind over 30 yrs
- 2.0%
Air-quality risk 2/10 · Minimal
- Unhealthy air days now
- 0 days/yr
- Unhealthy air days in 30 yrs
- 1 days/yr
Risk factors via First Street. Map © Google.
Why this score? — see what drove the D+ grade
The composite is a weighted blend of 9 inputs, each scored 0–100. Each bar is that input's sub-score; the figure is the points it added to the 100-point composite (weight × sub-score).
- ARV discount +15.0/15.0
- Cash flow +13.8/30.0
- Schools +5.2/10.0
- DSCR +4.2/10.0
- Livability +3.4/5.0
- 1% rule +2.8/10.0
- Rent growth +2.5/5.0
- Condition / age +2.5/5.0
- Appreciation +0.0/10.0
$259,900
🖨 Deal sheet (PDF) 📄 Offer letter ✓ Due diligence
Listing remarks
Stop your search when you find this charming 2-bedroom, 2-bath home in a central location! Featuring a newer HVAC system, water heater, and roof for added peace of mind. The generously sized living area offers privacy and comfort—perfect for relaxing or entertaining. Enjoy a cook’s kitchen with beautiful cabinetry and great functionality. Schedule your showing today. Home is being sold As Is.
Key facts
- Water heater
- Beautiful cabinetry
- Cook's kitchen
Tags
Property features AI
Finance
- HOA & community: Bella Vista homeowners association (monthly fee); Community amenities: clubhouse, dock, fitness center, golf, park, pool, tennis courts, trails/paths, biking, shopping, near fire station
Exterior
- Parking: Attached garage with automatic door opener; 2 covered parking spaces
- Utilities: Public water; Septic available (septic tank); Electricity available; Propane available
- Home design: Single-story home; Cedar construction; Architectural shingle roof; Block foundation; 25+ years old
- Construction: Cedar exterior; Architectural shingle roof; Block foundation; Built over 25 years ago
- Exterior features: Concrete driveway; Covered deck; Enclosed patio; Screened patio; Close to clubhouse; Hardwood trees; Wooded lot; Corner lot; City lot; Public paved road frontage; Community pool
Interior
- Kitchen: Dishwasher; Electric range; Garbage disposal; Plumbed for ice maker; ENERGY STAR qualified appliances; Electric water heater
- Flooring: Carpet; Tile; Vinyl
- Bathrooms: 2 full bathrooms; 2 half bathrooms
- Heating & cooling: Central heating; Heat pump; Central air; Attic fan; Electric cooling; ENERGY STAR qualified equipment
- Interior features: Ceiling fans; Cathedral ceilings; Eat-in kitchen; Living room fireplace
Neighborhood map
What this means for you Summary
Snapshot
- This is a 2-bed/2.0-bath single-family listed at $260k.
Deal economics
- At list price, monthly cash flow is $22 ($260/yr) — positive.
- The deal already cash-flows at list — no discount required.
- To meet the 1% rule (rent ≥ 1% of price), the offer needs to be $204k (21.7% below list).
- Recommended offer: $204k (21.7% below list) — sets the bar for 1% rule.
- Cap rate 6.4% vs local median 3.6% in Bella Vista — top-decile yield for the area; either an underpriced asset or a hidden risk that comps aren't pricing in. Stress-test before assuming the spread holds.
Location & tenants
- Location reads 67/100 on livability (#111 in AR) — a middle-class / working-renter tenant base. Strengths: cost of living A+, housing A+, schools A; Watch: amenities F, commute F, health & safety F.
- Bentonville School District (urban): math 59% / reading 59% proficiency, ranked #3 of 238 in AR (top 1%) — acceptable for families but not a draw, mixed tenant base, ~2y average lease.
- Market conditions: 838 active listings in the ZIP; 7 comparable units currently listed for rent nearby; rentals at typical pace (median 23d on market — plan ~3-4 weeks tenant-placement turnaround); solid renter incomes; 4,359 units permitted in Benton County in 2024 (402 in 5+ unit buildings).
Forward outlook
- Local home prices are declining (-3.0%/yr); year-one equity from $2k of loan paydown is wiped out by about $8k of value loss. Plan a longer hold.
- Benton County population projected at +56% by 2050 — long-run rental-demand tailwind backs the buy-and-hold thesis.
Negotiation context
- Only 11 days on market — expect competitive offers; lowballing is unlikely to land.
- Current owner paid $110k; list at $260k implies a 136% gain — meaningful room to come down on a strong offer.
Risks & watch-outs
- Climate carrying-cost: extreme-heat days projected 7→20/yr by 2055 (HVAC capex compounding) — expect insurance premiums to compound above CPI over the hold.
Questions for the listing agent
- Is there a deadline driving the sale (1031 exchange, divorce, estate, relocation)? That informs how much negotiation room exists.
- Schools are A-rated — typically a magnet for longer-tenancy family renters. What's the average tenant stay here, and is there a school-zone premium baked into asking?
- The area grade is low — what's the realistic commute time and amenity access for the typical tenant pool here? Any planned neighborhood developments (good or bad) we should know about?
- What's the average days-on-market for RENTAL listings here right now (not sales)? A rising rental-DOM trend means longer vacancies and softer asking-rent achievability than the comps imply.
- What's the recent tenant-quality profile in this submarket — average credit score on applications, eviction rate, late-payment / NSF rate, and stable-employment percentage? A property-management company in the area should have these aggregated.
- How much new for-sale + rental construction is in the pipeline within 1–3 miles? Heavy new supply typically softens prices + rents 12–24 months out; constrained supply supports both.
Investment metrics
- 1% rule
- 0.78% ✗
- Cap rate
- 6.39%
- Cash-on-cash
- 0.36%
- DSCR
- 1.02
- GRM
- 10.6
CMA / ARV
- ARV (on-the-fly)
- $322,390
- Comps found
- 12
Show comp detail 12 sales within ~0.75 mi
| Address | Dist | Beds/Ba | Sqft | Sold | Price | $/sf | Match |
|---|---|---|---|---|---|---|---|
| 58 Elizabeth | 0.26mi | 2/2.0 | 1,582 (+1%) | 15mo | $326,000 | $206 | 74 |
| 56 Elizabeth Dr | 0.24mi | 2/2.0 | 1,380 (-12%) | 1mo | $290,000 | $210 | 68 |
| 4 Hanworth Ln | 0.48mi | 2/2.0 | 1,588 (+2%) | 10mo | $317,000 | $200 | 66 |
| 7 Rogan Cir | 0.41mi | 2/2.0 | 1,477 (-6%) | 12mo | $322,000 | $218 | 61 |
| 54 Elizabeth Dr | 0.24mi | 3/2.0 (+1) | 1,700 (+9%) | 10mo | $205,000 | $121 | 61 |
| 14 Adams Ln | 0.57mi | 2/2.0 | 1,588 (+2%) | 12mo | $315,000 | $198 | 61 |
| 8 Adams Ln | 0.54mi | 3/2.0 (+1) | 1,676 (+7%) | 8mo | $325,000 | $194 | 52 |
| 6 Basildon Dr | 0.75mi | 3/2.0 (+1) | 1,520 (-3%) | 4mo | $324,900 | $214 | 52 |
| 1 Brighstone Ln | 0.37mi | 3/2.0 (+1) | 1,330 (-15%) | 3mo | $285,000 | $214 | 50 |
| 3 Burford Ln | 0.68mi | 3/2.0 (+1) | 1,707 (+9%) | 9mo | $350,000 | $205 | 41 |
| 7 Cummings Ln | 0.63mi | 2/1.5 | 1,346 (-14%) | 14mo | $305,000 | $227 | 33 |
| 6 Whitwick Ln | 0.71mi | 3/2.5 (+1) | 1,726 (+10%) | 12mo | $352,500 | $204 | 32 |
Match score weights: distance 35% · size 25% · config 20% · recency 20%. Top-matched comps best support the ARV.
Projected returns pro-forma
-3.0% appreciation · 3.0% rent growth · sell at horizon
- IRR
- -15.8%
- Equity multiple
- 0.44×
- Total profit
- $-40,835
- Equity at exit
- $38,752
- IRR
- -7.4%
- Equity multiple
- 0.53×
- Total profit
- $-34,183
- Equity at exit
- $22,471
Cash invested: $72,772 (down + closing). Projections, not guarantees.
Landlord ↔ Tenant lean methodology
- Overall (STATE)
- 92 Strongly Landlord-Friendly
- State Arkansas
- 92 Strongly Landlord-Friendly · R+14
- County
- — inherits STATE
- City
- — inherits STATE
ZIP-level market 72715
- Home prices YoY
- -6.6%
- Active inventory
- 838
- Price-to-rent
- 10.6×
Monthly cashflow live
- Estimated rent
- $2,035 high interval (Pro) →
- Mortgage (P&I)
- −$1,363
- Tax from tax record
- −$115 /mo · $1,380/yr
- Insurance
- −$108
- HOA
- −$0
- Vacancy / Maint / Mgmt
- −$427
- Net cashflow
- $22
Break-even live
Sensitivity live
| Price | -10% $169 | -5% $95 | +0% $22 | +5% $-52 | +10% $-125 |
|---|---|---|---|---|---|
| Rent | -10% $-139 | -5% $-59 | +0% $22 | +5% $102 | +10% $182 |
| Rate | -1.0pp $153 | -0.5pp $88 | base $22 | +0.5pp $-46 | +1.0pp $-114 |
UW: 25.0% down · 7.5% · 30yr · 1.5% tax · 5.0% vac · 8.0% maint · 8.0% mgmt
Financing live
Cash to close
- Down payment
- $64,975
- Closing costs
- $7,797
- Reserves months
- —
- Total cash needed
- —
Loan-product check · same deal, 3 products live
Conventional
25% down · 7.5% · 30yr
- Down + closing
- —
- Monthly P&I
- —
- Monthly cashflow
- —
- DSCR
- —
- Eligible?
- —
Personal DTI + credit; lowest rate.
DSCR
20% down · 8.5% · 30yr
- Down + closing
- —
- Monthly P&I
- —
- Monthly cashflow
- —
- DSCR
- —
- Eligible?
- —
No personal income docs; deal must DSCR.
Hard money
10% down · 12.0% · 12mo
- Down + closing
- —
- Monthly P&I
- —
- Monthly cashflow
- —
- DSCR
- —
- Eligible?
- —
Short-term bridge; refi at stabilization.
Rent comps 7 comps
| Address | Beds | Baths | Sqft | Rent | $/sqft | DOM | Units | Dist |
|---|---|---|---|---|---|---|---|---|
| 15 Baywater Ln Unit 1221842P Bella Vista, AR | 3.0 | 2.0 | 1915 | $5,167 | $2.70 | 23d | 1 | 0.58mi |
| 6 Connie Ln Bella Vista, AR | 3.0 | 2.0 | 1440 | $2,250 | $1.56 | 25d | 1 | 0.91mi |
| 9 August Ln Unit 1363327P Bella Vista, AR | 2.0 | 1.5 | 1173 | $3,153 | $2.69 | 16d | 1 | 0.99mi |
| 2 William Ln Bella Vista, AR | 3.0 | 2.0 | 1712 | $1,900 | $1.11 | 23d | 1 | 1.01mi |
| 2 William Ln Bella Vista, AR | 3.0 | 2.0 | 1712 | $1,850 | $1.08 | 16d | 1 | 1.01mi |
| 4 Kemble Cir Bella Vista, AR | 3.0 | 2.0 | 1376 | $1,850 | $1.34 | 25d | 1 | 1.07mi |
| 20 Annette Ln Bella Vista, AR | 3.0 | 2.0 | 1520 | $1,650 | $1.09 | 16d | 1 | 1.24mi |
Listing history 7 events
-
2026-06-22days on market $259,900 Active 11 DOM
-
2026-06-18days on market $259,900 Active 8 DOM
-
2026-06-17days on market $259,900 Active 7 DOM
-
2026-06-16days on market $259,900 Active 6 DOM
-
2026-06-15days on market $259,900 Active 5 DOM
-
2026-06-14remarks 395-char remark
-
2026-06-14$259,900 Active 3 DOM
ⓘ Source: listings_history table (triggers on properties + properties_extension) + one-shot
backfill from property_details.listing_events for pre-trigger history.
Tax reassessment forecast AR · Resets to sale price
- Current annual tax
- $1,380 · $115/mo
- Projected year-2 tax
- $1,663 · $139/mo
- Expected delta
- +$284/yr (+$24/mo · 20.6%)
ⓘ Screening estimate from a state-policy table — verify with the county assessor before closing.
Climate risk First Street
- Flood 1/10 Low FEMA zone X (unshaded) · 0% chance over 30 yrs
- Wildfire 1/10 Low
- Heat 5/10 Major 7 d/yr ≥105°F today · 20 d/yr by 30 yrs out
- Wind 2/10 Low 2% chance of damaging wind over 30 yrs
- Air quality 2/10 Low 0 unhealthy d/yr today · 1 by 30 yrs out
Nearby sold comps map
Loading sold comps map…
Walkable amenities ~0.75 mi
Loading nearby amenities…
Taxation est. · year 1
- Rental income
- $24,423
- − Mortgage interest
- −$14,558
- − Property taxes
- −$1,380
- − Insurance
- −$1,300
- − Repairs & maintenance
- −$1,954
- − Management
- −$1,954
- − Depreciation
- −$7,561
- Taxable loss
- −$4,283
- Est. tax savings @ 24.0%
- +$1,028
- After-tax cash flow
- $1,288/yr
For passive investors: Depreciation is non-cash, so a rental often shows a tax loss while cash-flowing — sheltering income. Rental losses are passive: they offset passive income freely, and up to $25,000/yr can offset ordinary (W-2) income if you actively participate and your MAGI is under $100k (phasing out to $0 by $150k); unused losses carry forward. On sale, claimed depreciation is recaptured at up to 25%, and gains may owe capital-gains tax (a 1031 exchange can defer both). Figures are a year-1 estimate at your 24.0% rate — not tax advice; consult a CPA.
Schools (NCES district)
- District
- Bentonville School District
- NCES district ID
- 0503060
- Math proficiency
- 59% ▼ -8.00%
- Reading proficiency
- 59% ▼ -6.00%
- Median HH income
- $66,721
- Composite
- 51.85/100
- National rank
- #1661
- State rank
- #3 of 238 in AR
Livability — Bella Vista
- Score
- 67/100
- State rank
- #111
- US rank
- #11129
Category grades
Schools grade is shown separately in the Schools card above.
Census & demographics
- Census place
- Bella Vista, AR
- County
- Benton County · 259,241 people
- City population
- 31,638
- Metro
- Fayetteville-Springdale-Rogers, AR
- Population (ZIP)
- 17,288
- Household income
- $82,447
- Rent vs Own
- Severe rent burden
- 107.0
Population outlook (Benton County) Hauer SSP2
- Today (2025)
- 318,683 people
- By 2030
- 353,481 · +10.9%
- By 2040
- 425,280 · +33.4%
- By 2050
- 497,239 · +56.0%
- By 2075
- 662,114 · +107.8%
- By 2100
- 776,431 · +143.6%
Race, ethnicity, and origin ACS 2023
- Neighborhood character
- Predominantly White (84%)
- Race & ethnicity
- White 84% Two or more races 12% Hispanic / Latino 6% Asian 1%
- Hispanic origin (detail)
- Mexican 2% Dominican 2%
- Common ancestry
- Lithuanian 4% Slovak 4% Portuguese 2%
- Foreign-born
- 3% · Canada
- Languages at home
- 97% English-only · Spanish 2%
Political lean MEDSL · Benton
- 2024 margin
- Strong R (+27.0) · D 35.2% · R 62.1% · Other 2.7%
- 2008→2024 swing
- +9.6pp toward D · 2008: -36.5pp · 2024: -27.0pp
- All cycles
- 2024: R+27.0 2020: R+26.4 2016: R+34.9 2012: R+40.4 2008: R+36.5
Not yet ingested
- Civics
- —
Market trends
- HPI YoY
- ▼ -21.53%
- Current HPI
- 304.946
- Rent YoY
- —
- Metro
- Fayetteville-Springdale-Rogers, AR
- State GDP YoY
- ▲ 3.80%
- F500 in state
- 10
Industry mix (Fortune 500 HQ in AR)
| Industry | F500 HQs | Revenue |
|---|---|---|
| Retail | 1 | $681B |
|
||
| Food / Agriculture | 1 | $53B |
|
||
| Retail / Energy | 1 | $22B |
|
||
| Transportation / Logistics | 1 | $12B |
|
||
| Energy | 1 | $4B |
|
||
Price history
+205.8% since first listed3 events — show timeline
- 2026-06-10 Listed $259,900 NWARMLS
- 2009-03-03 Sold (Public Records) $110,000 Public Records
- 1986-03-31 Sold (Public Records) $85,000 Public Records
Property tax history
+3.2%/yrLatest (2025): $1,380 · +0.1% YoY. Source: county tax records.
Cash-flow waterfall
monthlySold comps — $/sqft
last 12 mo · ≤1 miLoading sold comps…