 🏷️ Likely Rental
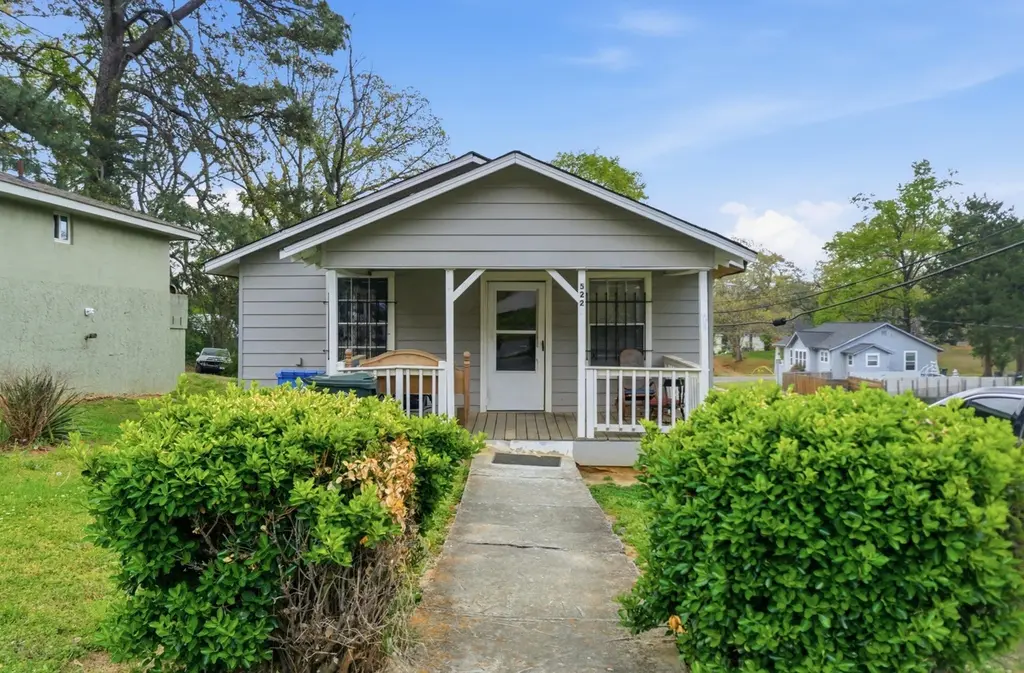
5228 Slayton Ave · Chattanooga, TN
Flood risk 1/10 · Minimal
- FEMA flood zone
- X (unshaded)
- Chance of flooding over 30 yrs
- 0.0%
- Est. flood insurance / yr
- $507 – $1,088
Fire risk 4/10 · Minor
- Est. fire insurance / yr
- $949 – $1,763
Heat risk 6/10 · Moderate
- Hot days now (above 106°F)
- 7 days/yr
- Hot days in 30 yrs
- 21 days/yr
Wind risk 4/10 · Minor
- Chance of severe wind over 30 yrs
- 11.0%
Air-quality risk 3/10 · Minor
- Unhealthy air days now
- 2 days/yr
- Unhealthy air days in 30 yrs
- 2 days/yr
Risk factors via First Street. Map © Google.
Why this score? — see what drove the A- grade
The composite is a weighted blend of 9 inputs, each scored 0–100. Each bar is that input's sub-score; the figure is the points it added to the 100-point composite (weight × sub-score).
- Cash flow +30.0/30.0
- ARV discount +15.0/15.0
- DSCR +10.0/10.0
- 1% rule +8.3/10.0
- Appreciation +5.7/10.0
- Livability +3.9/5.0
- Schools +2.7/10.0
- Rent growth +2.5/5.0
- Condition / age +2.5/5.0
$89,900
🖨 Deal sheet (PDF) 📄 Offer letter ✓ Due diligence
Listing remarks
Excellent property to add to your rental portfolio, and a fit for other various investment strategies as well. Ideal location close to St Elmo and Southside, with a strong rental market. Property is occupied with tenant on month to month lease. All walkthroughs and showings to be done once property is under contract, during inspection period. Property sold AS-IS. Please do not disturb tenants. Hard to find anything at this price point these days - so move quickly!
Key facts
- Ideal location
- Strong rental market
- Sold as is
Tags
Neighborhood map
What this means for you Summary
Snapshot
- This is a 2-bed/1.0-bath single-family listed at $90k.
Deal economics
- At list price, monthly cash flow is $414 ($5k/yr) — positive.
- The deal already cash-flows at list — no discount required.
- Meets the 1% rule at list price ($1k rent vs $90k).
- Cap rate 11.8% vs local median 3.4% in Chattanooga — top-decile yield for the area; either an underpriced asset or a hidden risk that comps aren't pricing in. Stress-test before assuming the spread holds.
Location & tenants
- Location reads 78/100 on livability (#3 in TN, #2,582 nationally) — a middle-class / working-renter tenant base. Strengths: amenities A+, commute A+, cost of living A+; Watch: employment D+, crime F.
- Hamilton County (urban): math 31% / reading 31% proficiency, ranked #42 of 139 in TN (top 30%) — families likely to look elsewhere, expect single-tenant / working-renter base with shorter leases.
- Zoned schools: East Lake Elementary (math 12% / reading 6%, grade F, #839 of 952 statewide, top 88%, 590 students, 0% FRL); East Lake Academy of Fine Arts (math 4% / reading 6%, grade F, #295 of 333 statewide, top 91%, 528 students, 0% FRL); The Howard School (math 3% / reading 8%, grade F, #309 of 332 statewide, top 93%, 1,485 students, 0% FRL) — zoned schools average 0% FRL vs 52% district-wide (52 pts lower); this property's tenant base skews higher-income than the district average.
- Zoned-school proficiency averages 6% at this address vs 31% district-wide (-25 pts) — the specific schools serving this property underperform the Hamilton County average; the district grade overstates school quality for this exact location.
- Market conditions: 62 active listings in the ZIP; 18 comparable units currently listed for rent nearby; rentals at typical pace (median 26d on market — plan ~3-4 weeks tenant-placement turnaround); lower-income renter base — watch delinquency; 2,133 units permitted in Hamilton County in 2024 (405 in 5+ unit buildings).
- At $1,195/mo this rent would consume 50% of the median local household income ($29k/yr) (locally 406% of renters already pay >50% of income on rent) — very limited rent-growth headroom before tenants either downsize or default.
Forward outlook
- In year one you build about $2k of equity ($622 loan paydown + $1k appreciation (1.3% local appreciation)).
- Hamilton County population projected at +23% by 2050 — long-run rental-demand tailwind backs the buy-and-hold thesis.
- At projected returns (1.3% appreciation + 3.0% rent growth), your $25k cash investment doubles in ~4 years — after that, you're playing with house money.
Negotiation context
- Only 4 days on market — expect competitive offers; lowballing is unlikely to land.
- Current owner paid $6k; list at $90k implies a 1283% gain — meaningful room to come down on a strong offer.
Risks & watch-outs
- Watch-outs: built in 1941 — expect roof / HVAC / electrical / plumbing capex.
- Climate carrying-cost: extreme-heat days projected 7→21/yr by 2055 (HVAC capex compounding) — expect insurance premiums to compound above CPI over the hold.
Questions for the listing agent
- Built in 1941 — when were the roof, HVAC, electrical panel, plumbing, and water heater last replaced?
- Is there a deadline driving the sale (1031 exchange, divorce, estate, relocation)? That informs how much negotiation room exists.
- Schools are F-rated, which usually means shorter tenancies and higher turnover. Who's the typical renter profile here, and what's been the actual vacancy rate?
- Crime grade is F in this area — have there been break-ins, vandalism, or insurance claims at this property in the last 3 years? What carrier currently insures it and at what premium?
- What's the average days-on-market for RENTAL listings here right now (not sales)? A rising rental-DOM trend means longer vacancies and softer asking-rent achievability than the comps imply.
- What's the recent tenant-quality profile in this submarket — average credit score on applications, eviction rate, late-payment / NSF rate, and stable-employment percentage? A property-management company in the area should have these aggregated.
- How much new for-sale + rental construction is in the pipeline within 1–3 miles? Heavy new supply typically softens prices + rents 12–24 months out; constrained supply supports both.
Investment metrics
- 1% rule
- 1.33% ✓
- Cap rate
- 11.82%
- Cash-on-cash
- 19.74%
- DSCR
- 1.88
- GRM
- 6.3
CMA / ARV
- ARV (on-the-fly)
- $118,188
- Comps found
- 5
Show comp detail 5 sales within ~0.75 mi
| Address | Dist | Beds/Ba | Sqft | Sold | Price | $/sf | Match |
|---|---|---|---|---|---|---|---|
| 5228 Slayton Ave | 0.00mi | 2/1.0 | 804 (0%) | 1mo | $80,000 | $100 | 99 |
| 5233 Dorsey St | 0.11mi | 2/1.0 | 800 (-0%) | 17mo | $205,000 | $256 | 80 |
| 5231 Usher Dr | 0.24mi | 3/1.0 (+1) | 792 (-2%) | 10mo | $149,900 | $189 | 73 |
| 425 E 52nd St E | 0.33mi | 3/1.0 (+1) | 828 (+3%) | 6mo | $100,000 | $121 | 69 |
| 22 W 51st St | 0.31mi | 2/1.0 | 750 (-7%) | 17mo | $110,000 | $147 | 60 |
Match score weights: distance 35% · size 25% · config 20% · recency 20%. Top-matched comps best support the ARV.
Projected returns pro-forma
1.33% appreciation · 3.0% rent growth · sell at horizon
- IRR
- 22.5%
- Equity multiple
- 2.17×
- Total profit
- $29,495
- Equity at exit
- $32,261
- IRR
- 25.1%
- Equity multiple
- 4.11×
- Total profit
- $78,217
- Equity at exit
- $44,113
Cash invested: $25,172 (down + closing). Projections, not guarantees.
Landlord ↔ Tenant lean methodology
- Overall (STATE)
- 87 Strongly Landlord-Friendly
- State Tennessee
- 87 Strongly Landlord-Friendly · R+13
- County
- — inherits STATE
- City
- — inherits STATE
ZIP-level market 37410
- Home prices YoY
- 0.6%
- Active inventory
- 62
- Price-to-rent
- 6.3×
Monthly cashflow live
- Estimated rent
- $1,195 high interval (Pro) →
- Mortgage (P&I)
- −$471
- Tax from tax record
- −$21 /mo · $249/yr
- Insurance
- −$37
- HOA
- −$0
- Vacancy / Maint / Mgmt
- −$251
- Net cashflow
- $414
Break-even live
Sensitivity live
| Price | -10% $465 | -5% $440 | +0% $414 | +5% $389 | +10% $363 |
|---|---|---|---|---|---|
| Rent | -10% $320 | -5% $367 | +0% $414 | +5% $461 | +10% $509 |
| Rate | -1.0pp $459 | -0.5pp $437 | base $414 | +0.5pp $391 | +1.0pp $367 |
UW: 25.0% down · 7.5% · 30yr · 1.5% tax · 5.0% vac · 8.0% maint · 8.0% mgmt
Financing live
Cash to close
- Down payment
- $22,475
- Closing costs
- $2,697
- Reserves months
- —
- Total cash needed
- —
Loan-product check · same deal, 3 products live
Conventional
25% down · 7.5% · 30yr
- Down + closing
- —
- Monthly P&I
- —
- Monthly cashflow
- —
- DSCR
- —
- Eligible?
- —
Personal DTI + credit; lowest rate.
DSCR
20% down · 8.5% · 30yr
- Down + closing
- —
- Monthly P&I
- —
- Monthly cashflow
- —
- DSCR
- —
- Eligible?
- —
No personal income docs; deal must DSCR.
Hard money
10% down · 12.0% · 12mo
- Down + closing
- —
- Monthly P&I
- —
- Monthly cashflow
- —
- DSCR
- —
- Eligible?
- —
Short-term bridge; refi at stabilization.
Rent comps 18 comps
| Address | Beds | Baths | Sqft | Rent | $/sqft | DOM | Units | Dist |
|---|---|---|---|---|---|---|---|---|
| 5238 Dorsey St Unit A Chattanooga, TN | 2.0 | 1.0 | 839 | $950 | $1.13 | 25d | 1 | 0.11mi |
| 5505 Central Ave Chattanooga, TN | 3.0 | 2.0 | 1050 | $1,725 | $1.64 | 23d | 1 | 0.18mi |
| 5200 Fagan St Chattanooga, TN | 3.0 | 1.0 | 816 | $1,350 | $1.65 | 25d | 1 | 0.33mi |
| 1205 W 50th St Unit 2 Chattanooga, TN | 1.0 | 1.0 | 600 | $1,025 | $1.71 | 15d | 1 | 0.41mi |
| 4905 Central Ave Chattanooga, TN | 2.0–3.0 | 2.0 | 1169 | $556 | $0.48 | 15d | 2 | 0.44mi |
| 5113 Tennessee Ave Unit 58 Chattanooga, TN | 1.0 | 1.0 | 700 | $950 | $1.36 | 25d | 1 | 0.45mi |
| 4521 Balcomb St Chattanooga, TN | 1.0 | 1.0 | 534 | $1,050 | $1.97 | 25d | 1 | 0.72mi |
| 706 W 47th St Chattanooga, TN | 2.0 | 1.0 | 680 | $825 | $1.21 | 25d | 1 | 0.85mi |
| 1007 Glentana St Lot 62 Rossville, GA | 2.0 | 2.0 | 840 | $35,995 | $42.85 | 45d | 1 | 0.93mi |
| 4113 Dorris St Apt B Chattanooga, TN | 2.0 | 1.0 | 750 | $950 | $1.27 | 25d | 1 | 1.06mi |
| 4129 Quinn Adams St Unit 2 Chattanooga, TN | 2.0 | 1.0 | 856 | $1,050 | $1.23 | 25d | 1 | 1.06mi |
| 3818 Chandler Ave Chattanooga, TN | 2.0 | 1.5 | 900 | $1,450 | $1.61 | 15d | 1 | 1.21mi |
| 4101 Alabama Ave Unit D Chattanooga, TN | 1.0 | 1.0 | 800 | $800 | $1.00 | 25d | 1 | 1.31mi |
| 3713 Dorris St Chattanooga, TN | 3.0 | 1.0 | 974 | $1,025 | $1.05 | 15d | 1 | 1.32mi |
| 3605 Dorris St Chattanooga, TN | 2.0 | 1.0 | 700 | $825 | $1.18 | 25d | 1 | 1.42mi |
| 3603 Dorris St Chattanooga, TN | 2.0 | 1.0 | 700 | $825 | $1.18 | 25d | 1 | 1.43mi |
| 515 W Gordon Ave Rossville, GA | 2.0 | 1.0 | 906 | $999 | $1.10 | 45d | 1 | 1.44mi |
| 505 Flegal Ave Rossville, GA | 2.0 | 1.0 | 768 | $1,050 | $1.37 | 25d | 1 | 1.48mi |
Listing history 3 events
-
2026-04-01status Pending
-
2026-03-28$89,900 Active
-
1997-06-27soldstatus $6,500
ⓘ Source: listings_history table (triggers on properties + properties_extension) + one-shot
backfill from property_details.listing_events for pre-trigger history.
Tax reassessment forecast TN · Resets to sale price
- Current annual tax
- $249 · $21/mo
- Projected year-2 tax
- $638 · $53/mo
- Expected delta
- +$389/yr (+$32/mo · 156.4%)
ⓘ Screening estimate from a state-policy table — verify with the county assessor before closing.
Climate risk First Street
- Flood 1/10 Low FEMA zone X (unshaded) · 0% chance over 30 yrs
- Wildfire 4/10 Moderate
- Heat 6/10 Major 7 d/yr ≥106°F today · 21 d/yr by 30 yrs out
- Wind 4/10 Moderate 11% chance of damaging wind over 30 yrs
- Air quality 3/10 Moderate 2 unhealthy d/yr today · 2 by 30 yrs out
Nearby sold comps map
Loading sold comps map…
Walkable amenities ~0.75 mi
Loading nearby amenities…
Taxation est. · year 1
- Rental income
- $14,336
- − Mortgage interest
- −$5,036
- − Property taxes
- −$249
- − Insurance
- −$450
- − Repairs & maintenance
- −$1,147
- − Management
- −$1,147
- − Depreciation
- −$2,615
- Taxable income
- $3,693
- Est. tax owed @ 24.0%
- −$886
- After-tax cash flow
- $4,083/yr
For passive investors: Depreciation is non-cash, so a rental often shows a tax loss while cash-flowing — sheltering income. Rental losses are passive: they offset passive income freely, and up to $25,000/yr can offset ordinary (W-2) income if you actively participate and your MAGI is under $100k (phasing out to $0 by $150k); unused losses carry forward. On sale, claimed depreciation is recaptured at up to 25%, and gains may owe capital-gains tax (a 1031 exchange can defer both). Figures are a year-1 estimate at your 24.0% rate — not tax advice; consult a CPA.
Schools (NCES district)
- District
- Hamilton County
- NCES district ID
- 4701590
- Math proficiency
- 31% ▼ -10.00%
- Reading proficiency
- 31% ▼ -3.00%
- Median HH income
- $47,456
- Composite
- 26.8/100
- National rank
- #7122
- State rank
- #42 of 139 in TN
Livability — Chattanooga
- Score
- 78/100
- State rank
- #3
- US rank
- #2582
Category grades
Schools grade is shown separately in the Schools card above.
Census & demographics
- Census place
- Chattanooga, TN
- County
- Hamilton County · 312,777 people
- City population
- 131,999
- Metro
- Chattanooga, TN-GA
- Population (ZIP)
- 4,129
- Household income
- $28,708
- Rent vs Own
- Severe rent burden
- 406.0
Population outlook (Hamilton County) Hauer SSP2
- Today (2025)
- 393,784 people
- By 2030
- 412,983 · +4.9%
- By 2040
- 449,502 · +14.1%
- By 2050
- 484,341 · +23.0%
- By 2075
- 565,746 · +43.7%
- By 2100
- 618,394 · +57.0%
Race, ethnicity, and origin ACS 2023
- Neighborhood character
- Predominantly Black (81%)
- Race & ethnicity
- Black 81% Two or more races 10% White 8% Hispanic / Latino 7%
- Hispanic origin (detail)
- Mexican 2%
- Common ancestry
- Scotch-Irish 1%
- Foreign-born
- 6% · Canada
- Languages at home
- 94% English-only · Spanish 6%
Political lean MEDSL · Hamilton
- 2024 margin
- R (+13.1) · D 42.7% · R 55.7% · Other 1.6%
- 2008→2024 swing
- -1.2pp toward R · 2008: -11.8pp · 2024: -13.1pp
- All cycles
- 2024: R+13.1 2020: R+9.7 2016: R+16.6 2012: R+14.8 2008: R+11.8
Not yet ingested
- Civics
- —
Market trends
- HPI YoY
- ▲ 1.33%
- Current HPI
- 228.3522
- Rent YoY
- —
- Metro
- Chattanooga, TN-GA
- State GDP YoY
- ▲ 2.78%
- F500 in state
- 22
Industry mix (Fortune 500 HQ in TN)
| Industry | F500 HQs | Revenue |
|---|---|---|
| Healthcare | 3 | $91B |
|
||
| Retail | 3 | $72B |
|
||
| Transportation / Logistics | 1 | $88B |
|
||
| Paper / Packaging | 1 | $19B |
|
||
| Insurance | 1 | $13B |
|
||
| Energy | 1 | $12B |
|
||
Price history
+1283.1% since first listed3 events — show timeline
- 2026-04-01 Pending — GCAR
- 2026-03-28 Listed $89,900 GCAR
- 1997-06-27 Sold (Public Records) $6,500 Public Records
Property tax history
+2.5%/yrLatest (2025): $249 · +44.0% YoY. Source: county tax records.
Cash-flow waterfall
monthlySold comps — $/sqft
last 12 mo · ≤1 miLoading sold comps…