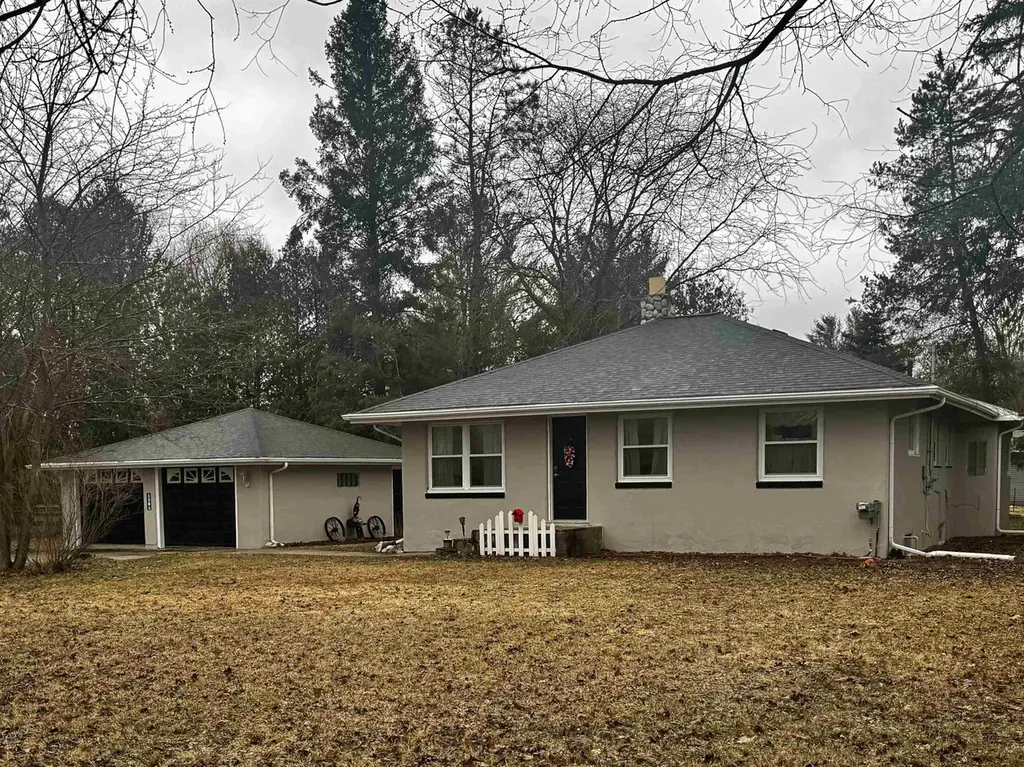
1361 N State St · Gladwin, MI
Flood risk 1/10 · Minimal
- FEMA flood zone
- X (unshaded)
- Chance of flooding over 30 yrs
- 0.0%
- Est. flood insurance / yr
- $473 – $860
Fire risk 4/10 · Minor
- Est. fire insurance / yr
- $784 – $1,456
Heat risk 2/10 · Minimal
- Hot days now (above 96°F)
- 7 days/yr
- Hot days in 30 yrs
- 14 days/yr
Wind risk 1/10 · Minimal
- Chance of severe wind over 30 yrs
- —
Air-quality risk 2/10 · Minimal
- Unhealthy air days now
- 1 days/yr
- Unhealthy air days in 30 yrs
- 1 days/yr
Risk factors via First Street. Map © Google.
Why this score? — see what drove the B+ grade
The composite is a weighted blend of 9 inputs, each scored 0–100. Each bar is that input's sub-score; the figure is the points it added to the 100-point composite (weight × sub-score).
- Cash flow +30.0/30.0
- ARV discount +14.6/15.0
- 1% rule +10.0/10.0
- DSCR +10.0/10.0
- Livability +3.6/5.0
- Schools +3.3/10.0
- Rent growth +2.5/5.0
- Condition / age +2.5/5.0
- Appreciation +0.0/10.0
$130,000
🖨 Deal sheet 📄 Offer letter ✓ Due diligence
Listing remarks
Welcome home to 1361 N State Street! Discover the charm of this delightful 2 bedroom, one bathroom home now available in Gladwin! With 1044 sqft of thoughtfully designed living space, this residence offers comfort, character and convenience at a great price point. Inside you will immediately notice the unique curved ceiling to wall transitions that give this home an architectural personality of it's own. The entire home provides ample storage with built in features throughout. You'll find a well designed kitchen space that flows seamlessly into the gracious dining/living room for gathering with friends or a relaxing evening. The home offers all new windows throughout, which flood every room
Key facts
- 0.4 acre lot
- 2 garage spots
- Built 1960
Property features AI
Finance
- Other: Lot approximately 0.4 acre (frontage ~132')
Exterior
- Parking: Detached 2-car garage with electricity and garage door opener
- Utilities: Community water; Septic sewer
- Home design: Residential, single-story home; Built in 1960; Below-grade finished space not reported
- Construction: Basement foundation
- Exterior features: Stucco exterior; Road frontage
Interior
- Bedrooms: Two bedrooms on the main level (approx. 13 x 11 and 11 x 8)
- Bathrooms: One full bathroom on the main level
- Heating & cooling: Forced air heating; Natural gas fuel
- Interior features: Basement present
Neighborhood map
What this means for you Summary
Snapshot
- This is a 2-bed/1.0-bath single-family listed at $130k.
Deal economics
- At list price, monthly cash flow is $849 ($10k/yr) — positive.
- The deal already cash-flows at list — no discount required.
- Meets the 1% rule at list price ($2k rent vs $130k).
- Recommended offer: $128k (1.5% below list) — sets the bar for market timing.
- Cap rate 14.1% vs local median 7.7% in Gladwin — top-decile yield for the area; either an underpriced asset or a hidden risk that comps aren't pricing in. Stress-test before assuming the spread holds.
Location & tenants
- Location reads 72/100 on livability (#253 in MI) — a middle-class / working-renter tenant base. Strengths: cost of living A+, housing A+, health & safety A+; Watch: crime F, amenities F, commute F.
- Gladwin Community Schools (town): math 28% / reading 51% proficiency, ranked #232 of 540 in MI (top 43%) — families likely to look elsewhere, expect single-tenant / working-renter base with shorter leases.
- Market conditions: 287 active listings in the ZIP; 90 units permitted in Gladwin County in 2024 (0 in 5+ unit buildings).
Forward outlook
- Local home prices are declining (-3.0%/yr); year-one equity from $899 of loan paydown is wiped out by about $4k of value loss. Plan a longer hold.
- Gladwin County population projected at -25% by 2050 — secular population decline; favor cash flow + early exit over multi-decade hold.
- At projected returns (-3.0% appreciation + 3.0% rent growth), your $36k cash investment doubles in ~5 years — after that, you're playing with house money.
Negotiation context
- It's been on market 18 days — a 2% lower offer ($128k) is reasonable based on typical stale-listing flexibility.
- 2 sale attempts since 21y ago with the ask held roughly flat each time — persistent listings suggest the price (not the market) is what's stuck; bring a comps-based counter.
- Current owner paid $100k; 30% above their basis — modest negotiation headroom, anchor on the comps not their cost.
Questions for the listing agent
- Built in 1960 — when were the roof, HVAC, electrical panel, plumbing, and water heater last replaced?
- Is there a deadline driving the sale (1031 exchange, divorce, estate, relocation)? That informs how much negotiation room exists.
- Crime grade is F in this area — have there been break-ins, vandalism, or insurance claims at this property in the last 3 years? What carrier currently insures it and at what premium?
- What's the average days-on-market for RENTAL listings here right now (not sales)? A rising rental-DOM trend means longer vacancies and softer asking-rent achievability than the comps imply.
- What's the recent tenant-quality profile in this submarket — average credit score on applications, eviction rate, late-payment / NSF rate, and stable-employment percentage? A property-management company in the area should have these aggregated.
- How much new for-sale + rental construction is in the pipeline within 1–3 miles? Heavy new supply typically softens prices + rents 12–24 months out; constrained supply supports both.
Investment metrics
- 1% rule
- 1.60% ✓
- Cap rate
- 14.13%
- Cash-on-cash
- 28.00%
- DSCR
- 2.25
- GRM
- 5.2
CMA / ARV
- ARV (on-the-fly)
- $154,512
- Comps found
- 12
Show comp detail 12 sales within ~0.75 mi
| Address | Dist | Beds/Ba | Sqft | Sold | Price | $/sf | Match |
|---|---|---|---|---|---|---|---|
| 1361 N State St | 0.00mi | 2/1.0 | 1,044 (0%) | 1mo | $130,000 | $125 | 99 |
| 1313 N Antler St | 0.12mi | 3/1.0 (+1) | 1,040 (-0%) | 8mo | $170,000 | $163 | 82 |
| 308 W Fourth St | 0.22mi | 2/1.0 | 988 (-5%) | 3mo | $158,500 | $160 | 78 |
| 1307 N Antler St | 0.14mi | 3/1.0 (+1) | 1,056 (+1%) | 10mo | $189,900 | $180 | 78 |
| 406 W Second St | 0.36mi | 3/1.0 (+1) | 1,056 (+1%) | 12mo | $128,000 | $121 | 66 |
| 1000 N Antler St | 0.32mi | 3/1.5 (+1) | 1,104 (+6%) | 14mo | $175,000 | $159 | 57 |
| 301 W Fourth St | 0.24mi | 3/1.0 (+1) | 900 (-14%) | 10mo | $127,000 | $141 | 53 |
| 309 W 5th St | 0.21mi | 3/2.0 (+1) | 1,200 (+15%) | 8mo | $129,900 | $108 | 50 |
| 1009 W Third St | 0.65mi | 2/1.0 | 1,152 (+10%) | 6mo | $170,000 | $148 | 48 |
| 3408 Clendening St | 0.60mi | 2/1.0 | 936 (-10%) | 11mo | $140,000 | $150 | 46 |
| 711 N Spring St | 0.64mi | 3/1.5 (+1) | 1,120 (+7%) | 8mo | $163,950 | $146 | 44 |
| 508 N Silverleaf St | 0.59mi | 3/1.0 (+1) | 924 (-12%) | 10mo | $92,500 | $100 | 40 |
Match score weights: distance 35% · size 25% · config 20% · recency 20%. Top-matched comps best support the ARV.
Projected returns pro-forma
-3.0% appreciation · 3.0% rent growth · sell at horizon
- IRR
- 22.1%
- Equity multiple
- 1.91×
- Total profit
- $32,994
- Equity at exit
- $19,383
- IRR
- 30.2%
- Equity multiple
- 3.70×
- Total profit
- $98,245
- Equity at exit
- $11,240
Cash invested: $36,400 (down + closing). Projections, not guarantees.
Landlord ↔ Tenant lean methodology
- Overall (STATE)
- 62 Landlord-Friendly
- State Michigan
- 62 Landlord-Friendly · EVEN
- County
- — inherits STATE
- City
- — inherits STATE
ZIP-level market 48624
- Home prices YoY
- -23.4%
- Active inventory
- 287
- Price-to-rent
- 5.2×
Monthly cashflow live
- Estimated rent
- $2,077 medium interval (Pro) →
- Mortgage (P&I)
- −$682
- Tax from tax record
- −$55 /mo · $665/yr
- Insurance
- −$54
- HOA
- −$0
- Vacancy / Maint / Mgmt
- −$436
- Net cashflow
- $849
Break-even live
UW: 25.0% down · 7.5% · 30yr · 1.5% tax · 5.0% vac · 8.0% maint · 8.0% mgmt
Financing live
Cash to close
- Down payment
- $32,500
- Closing costs
- $3,900
- Reserves months
- —
- Total cash needed
- —
Loan-product check · same deal, 3 products live
Conventional
25% down · 7.5% · 30yr
- Down + closing
- —
- Monthly P&I
- —
- Monthly cashflow
- —
- DSCR
- —
- Eligible?
- —
Personal DTI + credit; lowest rate.
DSCR
20% down · 8.5% · 30yr
- Down + closing
- —
- Monthly P&I
- —
- Monthly cashflow
- —
- DSCR
- —
- Eligible?
- —
No personal income docs; deal must DSCR.
Hard money
10% down · 12.0% · 12mo
- Down + closing
- —
- Monthly P&I
- —
- Monthly cashflow
- —
- DSCR
- —
- Eligible?
- —
Short-term bridge; refi at stabilization.
Listing history 5 events
-
2026-04-13status Pending
-
2026-03-26$130,000 Active
-
2025-08-05soldstatus $100,000
-
2005-04-01soldstatus $60,000
-
2005-01-25$64,900
ⓘ Source: listings_history table (triggers on properties + properties_extension) + one-shot
backfill from property_details.listing_events for pre-trigger history.
Tax reassessment forecast MI · Partial reset (capped growth)
- Current annual tax
- $665 · $55/mo
- Projected year-2 tax
- $1,334 · $111/mo
- Expected delta
- +$668/yr (+$56/mo · 100.5%)
ⓘ Screening estimate from a state-policy table — verify with the county assessor before closing.
Climate risk First Street
- Flood 1/10 Low FEMA zone X (unshaded) · 0% chance over 30 yrs
- Wildfire 4/10 Moderate
- Heat 2/10 Low 7 d/yr ≥96°F today · 14 d/yr by 30 yrs out
- Wind 1/10 Low
- Air quality 2/10 Low 1 unhealthy d/yr today · 1 by 30 yrs out
Nearby sold comps map
Loading sold comps map…
Walkable amenities ~0.75 mi
Loading nearby amenities…
Taxation est. · year 1
- Rental income
- $24,921
- − Mortgage interest
- −$7,282
- − Property taxes
- −$665
- − Insurance
- −$650
- − Repairs & maintenance
- −$1,994
- − Management
- −$1,994
- − Depreciation
- −$3,782
- Taxable income
- $8,555
- Est. tax owed @ 24.0%
- −$2,053
- After-tax cash flow
- $8,139/yr
For passive investors: Depreciation is non-cash, so a rental often shows a tax loss while cash-flowing — sheltering income. Rental losses are passive: they offset passive income freely, and up to $25,000/yr can offset ordinary (W-2) income if you actively participate and your MAGI is under $100k (phasing out to $0 by $150k); unused losses carry forward. On sale, claimed depreciation is recaptured at up to 25%, and gains may owe capital-gains tax (a 1031 exchange can defer both). Figures are a year-1 estimate at your 24.0% rate — not tax advice; consult a CPA.
Schools (NCES district)
- District
- Gladwin Community Schools
- NCES district ID
- 2615990
- Math proficiency
- 28% ▼ -13.00%
- Reading proficiency
- 51% ▼ -2.00%
- Median HH income
- $38,917
- Composite
- 32.93/100
- National rank
- #5595
- State rank
- #232 of 540 in MI
Livability — Gladwin
- Score
- 72/100
- State rank
- #253
- US rank
- #6296
Category grades
Schools grade is shown separately in the Schools card above.
Census & demographics
- Census place
- Gladwin, MI
- Population (ZIP)
- 16,269
Population outlook (Gladwin County) Hauer SSP2
- Today (2025)
- 23,440 people
- By 2030
- 22,281 · -4.9%
- By 2040
- 19,867 · -15.2%
- By 2050
- 17,667 · -24.6%
- By 2075
- 12,909 · -44.9%
- By 2100
- 8,629 · -63.2%
Race, ethnicity, and origin ACS 2023
- Neighborhood character
- Predominantly White (94%)
- Race & ethnicity
- White 94% Two or more races 4% Hispanic / Latino 2%
- Common ancestry
- Romanian 8% Lithuanian 3% Iranian 3%
- Foreign-born
- 1%
- Languages at home
- 95% English-only · German/W. Germanic 4% Spanish 1%
Political lean MEDSL · Gladwin
- 2024 margin
- Solid R (+40.7) · D 29.1% · R 69.8% · Other 1.1%
- 2008→2024 swing
- -42.2pp toward R · 2008: 1.5pp · 2024: -40.7pp
- All cycles
- 2024: R+40.7 2020: R+36.8 2016: R+34.7 2012: R+7.2 2008: D+1.5
Not yet ingested
- Civics
- —
Market trends
- HPI YoY
- ▼ -72.67%
- Current HPI
- 238.0744
- Rent YoY
- —
- Metro
- —
- State GDP YoY
- ▲ 1.37%
- F500 in state
- 28
Industry mix (Fortune 500 HQ in MI)
| Industry | F500 HQs | Revenue |
|---|---|---|
| Automotive Parts | 3 | $48B |
|
||
| Automotive | 2 | $372B |
|
||
| Chemicals | 1 | $45B |
|
||
| Automotive Retail | 1 | $29B |
|
||
| Healthcare / Medical Devices | 1 | $23B |
|
||
| Automotive Technology | 1 | $20B |
|
||
Price history
+100.3% since first listed5 events — show timeline
- 2026-04-13 Pending — MiRealSource-MiMLS
- 2026-03-26 Listed $130,000 MiRealSource-MiMLS
- 2025-08-05 Sold (Public Records) $100,000 Public Records
- 2005-04-01 Sold (Public Records) $60,000 Public Records
- 2005-01-25 Listed $64,900 MiRealSource-MiMLS
Property tax history
-0.9%/yrLatest (2025): $665 · -35.8% YoY. Source: county tax records.
Cash-flow waterfall
monthlySold comps — $/sqft
last 12 mo · ≤1 miLoading sold comps…