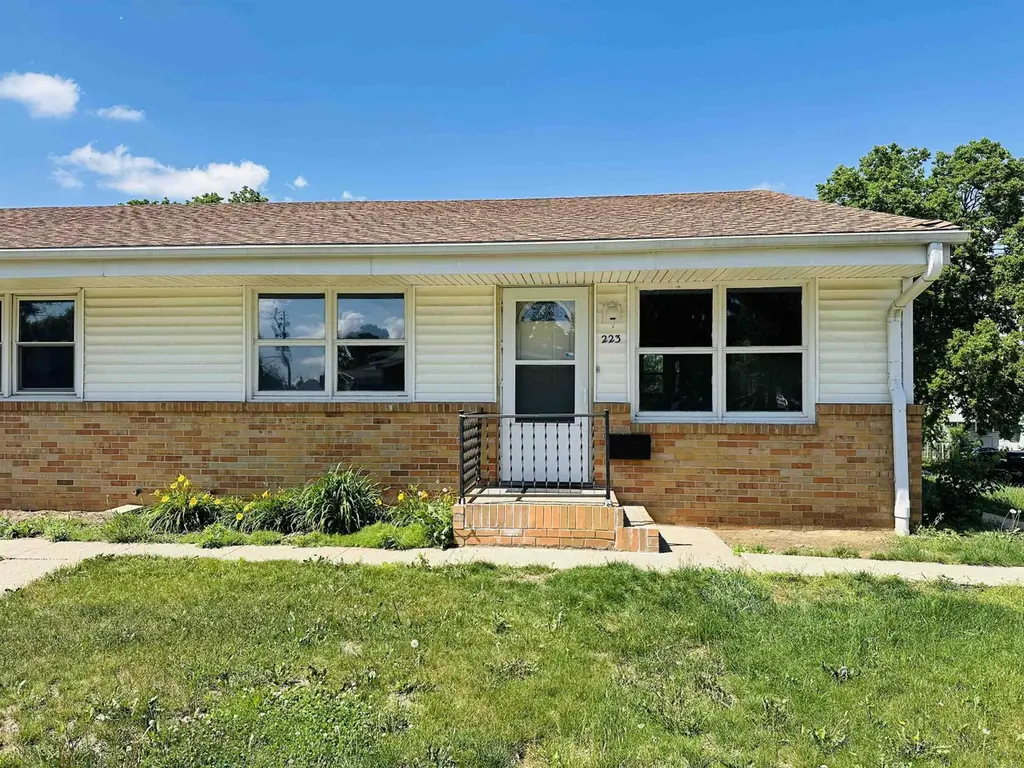
223 18th St · Sioux City, IA
Flood risk No data
- FEMA flood zone
- —
- Chance of flooding over 30 yrs
- —
- Est. flood insurance / yr
- —
Fire risk No data
- Est. fire insurance / yr
- —
Heat risk No data
- Hot days now (above threshold)
- —
- Hot days in 30 yrs
- —
Wind risk No data
- Chance of severe wind over 30 yrs
- —
Air-quality risk No data
- Unhealthy air days now
- —
- Unhealthy air days in 30 yrs
- —
Risk factors via First Street. Map © Google.
Why this score? — see what drove the D grade
The composite is a weighted blend of 9 inputs, each scored 0–100. Each bar is that input's sub-score; the figure is the points it added to the 100-point composite (weight × sub-score).
- Cash flow +8.1/30.0
- ARV discount +7.5/15.0
- Appreciation +6.9/10.0
- Schools +4.7/10.0
- 1% rule +4.3/10.0
- Livability +3.9/5.0
- Condition / age +3.8/5.0
- Rent growth +2.5/5.0
- DSCR +2.1/10.0
$141,500
🖨 Deal sheet (PDF) 📄 Offer letter ✓ Due diligence
Listing remarks
Move right into this beautifully updated condo featuring 2 bedrooms and 3 bathrooms with 1,098 total finished square feet, including 1,000 square feet on the main level. Enjoy a completely updated kitchen and updated bathrooms that give the home a fresh, modern feel. A one-car carport conveniently located behind the condo adds extra convenience and functionality. The basement offers some partial finish while still leaving plenty of unfinished space with endless potential for additional living space, storage, or future customization. Added value comes with the HOA, which helps provide convenience by covering water, sewer, and trash services. A great opportunity to own a low-maintenance home
Key facts
- $200 HOA
- Built 1966
- Listed 20 days
Property features AI
Finance
- HOA & community: Homeowners association with a $200 monthly fee
Exterior
- Parking: Concrete parking; No garage
- Utilities: Public water; Public sewer
- Home design: Residential condominium; Zoned RES
- Construction: Below-grade finished area; Brick and vinyl siding construction
- Exterior features: Porch; Shingle roof; Brick and vinyl siding exterior
Interior
- Kitchen: Eat-in kitchen
- Flooring: Vinyl flooring
- Bathrooms: 2 full bathrooms; 1 half bathroom
- Heating & cooling: Central air conditioning; Natural gas forced air heating
- Interior features: Eat-in kitchen; Full, partially finished basement
Neighborhood map
What this means for you Summary
Snapshot
- This is a 2-bed/2.5-bath condo listed at $142k. Condition is rated good.
Deal economics
- At list price, monthly cash flow is $-139 ($-2k/yr) — negative.
- To cash-flow at today's rent, offer at most $121k (14.2% below list).
- To meet the 1% rule (rent ≥ 1% of price), the offer needs to be $132k (7.0% below list).
- Recommended offer: $121k (14.2% below list) — sets the bar for cash-flow.
- Cap rate 5.1% vs local median 3.7% in Sioux City — top-decile yield for the area; either an underpriced asset or a hidden risk that comps aren't pricing in. Stress-test before assuming the spread holds.
Location & tenants
- Location reads 78/100 on livability (#138 in IA, #2,544 nationally) — a middle-class / working-renter tenant base. Strengths: cost of living A+, housing A+, health & safety A+; Watch: crime F, commute F.
- Sioux City Community School District (urban): math 54% / reading 57% proficiency, ranked #264 of 289 in IA (top 91%) — acceptable for families but not a draw, mixed tenant base, ~2y average lease.
- Zoned schools: Hunt Elementary School (math 57% / reading 47%, grade C-, #494 of 616 statewide, top 83%, 392 students, 86% FRL); North Middle School (math 46% / reading 50%, grade C-, #224 of 246 statewide, top 91%, 1,224 students, 74% FRL); North High School (math 53% / reading 57%, grade C, #289 of 336 statewide, top 86%, 1,634 students, 64% FRL) — zoned schools average 75% FRL vs 54% district-wide (21 pts higher); higher-poverty schools than district average — tighter screening recommended.
- Market conditions: 31 active listings in the ZIP; 9 comparable units currently listed for rent nearby; rentals lingering (median 46d on market — plan ~5-8 weeks vacancy on turnover, expect pricing pressure); 100% of comp listings sitting > 30 days — soft ceiling on asking rent; 170 units permitted in Woodbury County in 2024 (90 in 5+ unit buildings).
Forward outlook
- In year one you build about $6k of equity ($978 loan paydown + $5k appreciation (3.8% local appreciation)).
- By year 6, paydown + projected appreciation supports a ~$34k cash-out refi (75% LTV) — recoverable capital for the next deal without selling this one.
Negotiation context
- It's been on market 21 days — a 2% lower offer ($139k) is reasonable based on typical stale-listing flexibility.
Questions for the listing agent
- What do current leases actually rent for vs. the listed asking? Can we see a recent rent roll and the last 12 months of T-12 income?
- Built in 1966 — when were the roof, HVAC, electrical panel, plumbing, and water heater last replaced?
- What does the HOA fee cover, when was the last increase, and are there any pending special assessments or reserve-fund shortfalls?
- Any open or pending special assessments — roof, HVAC, plumbing, elevator, façade? What's the per-unit balance and payoff schedule, and is the seller paying it off at close or rolling it to the buyer?
- Is there a deadline driving the sale (1031 exchange, divorce, estate, relocation)? That informs how much negotiation room exists.
- Crime grade is F in this area — have there been break-ins, vandalism, or insurance claims at this property in the last 3 years? What carrier currently insures it and at what premium?
- The area grade is low — what's the realistic commute time and amenity access for the typical tenant pool here? Any planned neighborhood developments (good or bad) we should know about?
- What's the average days-on-market for RENTAL listings here right now (not sales)? A rising rental-DOM trend means longer vacancies and softer asking-rent achievability than the comps imply.
- What's the recent tenant-quality profile in this submarket — average credit score on applications, eviction rate, late-payment / NSF rate, and stable-employment percentage? A property-management company in the area should have these aggregated.
- How much new apartment / multifamily construction is in the pipeline within 1–3 miles? Heavy new supply (>2% of stock underway) typically softens rents 12–24 months out; light construction supports rent growth.
Investment metrics
- 1% rule
- 0.93% ✗
- Cap rate
- 5.12%
- Cash-on-cash
- -4.20%
- DSCR
- 0.81
- GRM
- 9.0
CMA / ARV
No comps found within radius.
Projected returns pro-forma
3.78% appreciation · 3.0% rent growth · sell at horizon
- IRR
- 6.0%
- Equity multiple
- 1.36×
- Total profit
- $14,294
- Equity at exit
- $69,937
- IRR
- 8.7%
- Equity multiple
- 2.42×
- Total profit
- $56,375
- Equity at exit
- $112,970
Cash invested: $39,620 (down + closing). Projections, not guarantees.
Landlord ↔ Tenant lean methodology
- Overall (STATE)
- 83 Strongly Landlord-Friendly
- State Iowa
- 83 Strongly Landlord-Friendly · R+6
- County
- — inherits STATE
- City
- — inherits STATE
ZIP-level market 51105
- Home prices YoY
- 1.7%
- Active inventory
- 31
- Price-to-rent
- 9.0×
Monthly cashflow live
- Estimated rent
- $1,316 high interval (Pro) →
- Mortgage (P&I)
- −$742
- Tax est. 1.5%
- −$177 /mo · $2,122/yr
- Insurance
- −$59
- HOA
- −$200
- Vacancy / Maint / Mgmt
- −$276
- Net cashflow
- $-139
Break-even live
Sensitivity live
| Price | -10% $-41 | -5% $-90 | +0% $-139 | +5% $-187 | +10% $-236 |
|---|---|---|---|---|---|
| Rent | -10% $-243 | -5% $-191 | +0% $-139 | +5% $-87 | +10% $-35 |
| Rate | -1.0pp $-67 | -0.5pp $-103 | base $-139 | +0.5pp $-175 | +1.0pp $-213 |
UW: 25.0% down · 7.5% · 30yr · 1.5% tax · 5.0% vac · 8.0% maint · 8.0% mgmt
Financing live
Cash to close
- Down payment
- $35,375
- Closing costs
- $4,245
- Reserves months
- —
- Total cash needed
- —
Loan-product check · same deal, 3 products live
Conventional
25% down · 7.5% · 30yr
- Down + closing
- —
- Monthly P&I
- —
- Monthly cashflow
- —
- DSCR
- —
- Eligible?
- —
Personal DTI + credit; lowest rate.
DSCR
20% down · 8.5% · 30yr
- Down + closing
- —
- Monthly P&I
- —
- Monthly cashflow
- —
- DSCR
- —
- Eligible?
- —
No personal income docs; deal must DSCR.
Hard money
10% down · 12.0% · 12mo
- Down + closing
- —
- Monthly P&I
- —
- Monthly cashflow
- —
- DSCR
- —
- Eligible?
- —
Short-term bridge; refi at stabilization.
Rent comps 9 comps
| Address | Beds | Baths | Sqft | Rent | $/sqft | DOM | Units | Dist |
|---|---|---|---|---|---|---|---|---|
| 610 13th St Sioux City, IA | 2.0–3.0 | 1.0–1.5 | 1329 | $1,097 | $0.83 | 46d | 3 | 0.45mi |
| 821 Jackson St Apt 105 Sioux City, IA | 2.0 | 1.0 | 1014 | $1,010 | $1.00 | 46d | 1 | 0.72mi |
| 1116 13th St Sioux City, IA | 3.0 | 1.0 | 1056 | $1,100 | $1.04 | 46d | 1 | 0.73mi |
| 1114 13th St Unit 1116 Sioux City, IA | 3.0 | 1.0 | 1056 | $1,100 | $1.04 | 46d | 1 | 0.73mi |
| 705 Douglas St Sioux City, IA | 2.0 | 2.0 | 1252 | $1,775 | $1.42 | 46d | 5 | 0.78mi |
| 505 6th St Sioux City, IA | 1.0–2.0 | 1.0 | 830 | $2,100 | $2.53 | 46d | 5 | 0.88mi |
| 302 Jones St #403 Sioux City, IA | 2.0 | 2.0 | 872 | $1,750 | $2.01 | 46d | 1 | 1.15mi |
| 130 Nebraska St Sioux City, IA | 1.0–2.0 | 1.0–2.0 | 900 | $1,215 | $1.35 | 46d | 8 | 1.24mi |
| 2722 Prospect St Sioux City, IA | 3.0 | 1.0 | 848 | $1,200 | $1.42 | 46d | 1 | 1.36mi |
HOA detail condo
- Monthly dues
- $200 · $2,400/yr
- Likely covers
- watersewertrash
- Assessments
- None detected in remarks — confirm with the listing agent.
Listing history 17 events
-
2026-06-22days on market $141,500 Active 21 DOM
-
2026-06-21days on market $141,500 Active 20 DOM
-
2026-06-19days on market $141,500 Active 18 DOM
-
2026-06-18days on market $141,500 Active 17 DOM
-
2026-06-17days on market $141,500 Active 16 DOM
-
2026-06-17price $141,500 Active 15 DOM
-
2026-06-16days on market $149,000 Active 15 DOM
-
2026-06-15days on market $149,000 Active 14 DOM
-
2026-06-14days on market $149,000 Active 12 DOM
-
2026-06-12days on market $149,000 Active 11 DOM
-
2026-06-09days on market $149,000 Active 8 DOM
-
2026-06-09price $149,000 Active 7 DOM
-
2026-06-08days on market $154,900 Active 7 DOM
-
2026-06-07days on market $154,900 Active 6 DOM
-
2026-06-05days on market $154,900 Active 3 DOM
-
2026-06-01remarks 699-char remark
-
2026-06-01$154,900 Active 1 DOM
ⓘ Source: listings_history table (triggers on properties + properties_extension) + one-shot
backfill from property_details.listing_events for pre-trigger history.
Nearby sold comps map
Loading sold comps map…
Walkable amenities ~0.75 mi
Loading nearby amenities…
Taxation est. · year 1
- Rental income
- $15,786
- − Mortgage interest
- −$7,926
- − Property taxes
- −$2,122
- − Insurance
- −$708
- − Repairs & maintenance
- −$1,263
- − Management
- −$1,263
- − HOA
- −$2,400
- − Depreciation
- −$4,116
- Taxable loss
- −$4,012
- Est. tax savings @ 24.0%
- +$963
- After-tax cash flow
- $-700/yr
For passive investors: Depreciation is non-cash, so a rental often shows a tax loss while cash-flowing — sheltering income. Rental losses are passive: they offset passive income freely, and up to $25,000/yr can offset ordinary (W-2) income if you actively participate and your MAGI is under $100k (phasing out to $0 by $150k); unused losses carry forward. On sale, claimed depreciation is recaptured at up to 25%, and gains may owe capital-gains tax (a 1031 exchange can defer both). Figures are a year-1 estimate at your 24.0% rate — not tax advice; consult a CPA.
Condition & rehab AI · 12 photos
This updated condo is move-in ready with modern finishes and a low-maintenance exterior. Potential improvements could further enhance its curb appeal and value.
Value-add opportunities
- Both Paint exterior siding — Enhances curb appeal and value.
- Both Replace air conditioning unit — Modernizes HVAC and improves comfort.
- Both Install smart home devices — Enhances convenience and marketability.
Renovation cost estimate screening
Value-add ROI direction
- Both Paint exterior siding — Enhances curb appeal and value. ↑
- Both Replace air conditioning unit — Modernizes HVAC and improves comfort. ↑
- Both Install smart home devices — Enhances convenience and marketability. ↑
ⓘ Cost ranges are severity-bucket heuristics (US national rule-of-thumb). Get contractor quotes + a written scope before underwriting a rehab budget.
Schools (NCES district)
- District
- Sioux City Community School District
- NCES district ID
- 1926400
- Math proficiency
- 54% ▼ -7.00%
- Reading proficiency
- 57% ▼ -2.00%
- Median HH income
- $44,967
- Composite
- 46.86/100
- National rank
- #2371
- State rank
- #264 of 289 in IA
Livability — Sioux City
- Score
- 78/100
- State rank
- #138
- US rank
- #2544
Category grades
Schools grade is shown separately in the Schools card above.
Census & demographics
- Census place
- Sioux City, IA
- City population
- 51,789
- Population (ZIP)
- 10,726
Population outlook (Woodbury County) Hauer SSP2
- Today (2025)
- 103,226 people
- By 2030
- 103,060 · -0.2%
- By 2040
- 102,533 · -0.7%
- By 2050
- 102,788 · -0.4%
- By 2075
- 107,227 · +3.9%
- By 2100
- 113,980 · +10.4%
Race, ethnicity, and origin ACS 2023
- Neighborhood character
- Diverse neighborhood (Simpson 0.69)
- Race & ethnicity
- Hispanic / Latino 40% White 38% Two or more races 29% Black 10% Native American 3% Asian 2%
- Hispanic origin (detail)
- Mexican 24% Puerto Rican 1%
- Common ancestry
- Portuguese 2% Iranian 1% Romanian 1%
- Foreign-born
- 25% · Canada, Vietnam
- Languages at home
- 55% English-only · Spanish 36% Vietnamese 2% Other Asian/Pacific 1%
Political lean MEDSL · Woodbury
- 2024 margin
- Strong R (+23.0) · D 37.8% · R 60.9% · Other 1.3%
- 2008→2024 swing
- -22.5pp toward R · 2008: -0.5pp · 2024: -23.0pp
- All cycles
- 2024: R+23.0 2020: R+15.5 2016: R+19.9 2012: R+0.2 2008: R+0.5
Not yet ingested
- Civics
- —
Market trends
- HPI YoY
- ▲ 3.78%
- Current HPI
- 226.3786
- Rent YoY
- —
- Metro
- —
- State GDP YoY
- ▲ 2.48%
- F500 in state
- 4
Industry mix (Fortune 500 HQ in IA)
| Industry | F500 HQs | Revenue |
|---|---|---|
| Financial Services | 1 | $16B |
|
||
| Retail / Convenience | 1 | $15B |
|
||
Price history
1 event — show timeline
- 2026-06-01 Listed $154,900 NWIA
Cash-flow waterfall
monthlySold comps — $/sqft
last 12 mo · ≤1 miLoading sold comps…