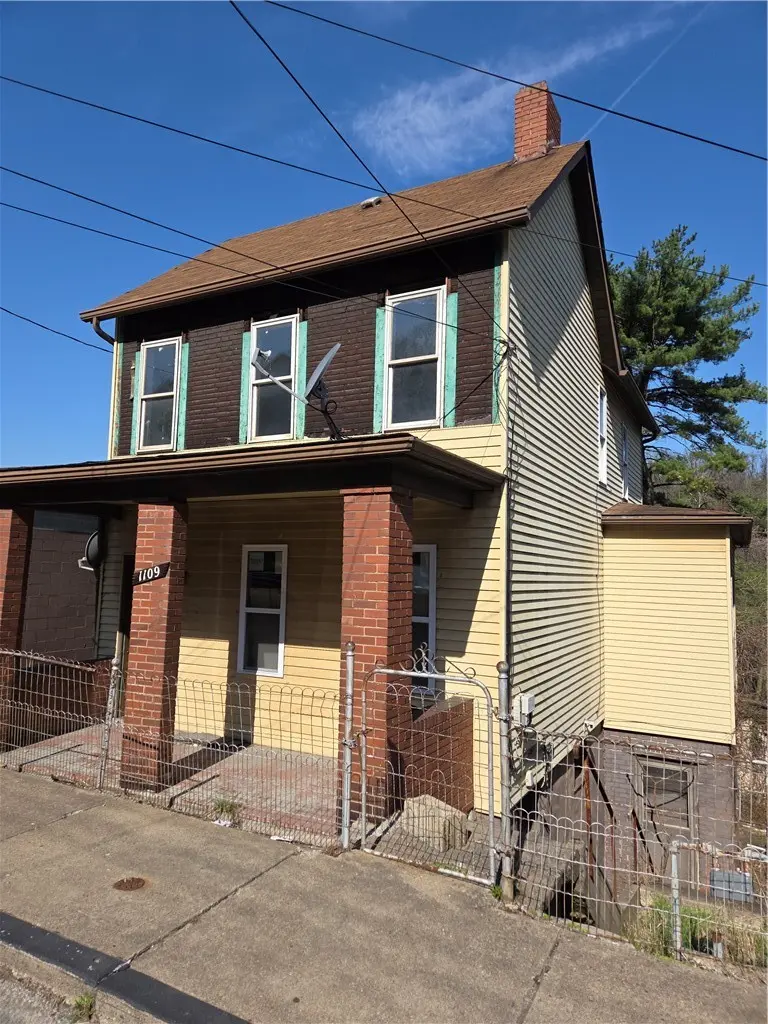
1109 Jones Ave · North Braddock, PA
Flood risk 1/10 · Minimal
- FEMA flood zone
- X (unshaded)
- Chance of flooding over 30 yrs
- 0.0%
- Est. flood insurance / yr
- $473 – $860
Fire risk 1/10 · Minimal
- Est. fire insurance / yr
- $511 – $949
Heat risk 3/10 · Minor
- Hot days now (above 98°F)
- 7 days/yr
- Hot days in 30 yrs
- 17 days/yr
Wind risk 2/10 · Minimal
- Chance of severe wind over 30 yrs
- —
Air-quality risk 4/10 · Minor
- Unhealthy air days now
- 4 days/yr
- Unhealthy air days in 30 yrs
- 5 days/yr
Risk factors via First Street. Map © Google.
Why this score? — see what drove the D+ grade
The composite is a weighted blend of 9 inputs, each scored 0–100. Each bar is that input's sub-score; the figure is the points it added to the 100-point composite (weight × sub-score).
- Cash flow +15.0/30.0
- ARV discount +7.5/15.0
- 1% rule +5.0/10.0
- DSCR +5.0/10.0
- Appreciation +4.2/10.0
- Livability +3.7/5.0
- Rent growth +2.5/5.0
- Condition / age +2.5/5.0
- Schools +1.8/10.0
$24,500
🖨 Deal sheet 📄 Offer letter ✓ Due diligence
Listing remarks MLS
Investor Special – High Upside Opportunity This property is not for the faint of heart—it requires significant work, but the potential payoff makes it well worth the effort. Whether you’re looking for a fix-and-hold or a cash-out strategy, this is a strong value-add opportunity. Roll up your sleeves and take on the project yourself, or bring in a contractor—either way, there is sufficient margin to make this a worthwhile investment. A great opportunity for experienced investors looking to maximize returns.
Key facts
- 4,199 sq ft lot
- Built 1908
- Listed 58 days
Neighborhood map
What this means for you Summary
Snapshot
- This is a 3-bed/1.0-bath single-family listed at $24k.
Deal economics
- At list price, monthly cash flow is $802 ($10k/yr) — positive.
- The deal already cash-flows at list — no discount required.
- Meets the 1% rule at list price ($1k rent vs $24k).
- Recommended offer: $24k (3.0% below list) — sets the bar for market timing.
Location & tenants
- Location reads 73/100 on livability (#550 in PA) — a middle-class / working-renter tenant base. Strengths: commute A+, cost of living A+, housing A+; Watch: schools F, amenities F, employment F.
- Woodland Hills SD (suburban): math 13% / reading 30% proficiency, ranked #486 of 539 in PA (top 90%) — low school quality limits family demand, transient renter base, plan for 1-2y turnover; 69% free/reduced lunch — lower-income household profile, screen leases tightly.
- Market conditions: 37 active listings in the ZIP; 17 comparable units currently listed for rent nearby; rentals at typical pace (median 24d on market — plan ~3-4 weeks tenant-placement turnaround); 47% of comp listings sitting > 30 days — soft ceiling on asking rent; lower-income renter base — watch delinquency; 2,996 units permitted in Allegheny County in 2024 (1,588 in 5+ unit buildings).
- This rent runs 37% of the median local income ($40k/yr) — at the standard rent-burdened threshold; future hikes will face affordability resistance.
Forward outlook
- Local home prices are declining (-1.6%/yr); year-one equity from $169 of loan paydown is wiped out by about $397 of value loss. Plan a longer hold.
- At projected returns (-1.6% appreciation + 3.0% rent growth), your $7k cash investment doubles in ~1 year — after that, you're playing with house money.
Negotiation context
- It's been on market 58 days — a 3% lower offer ($24k) is reasonable based on typical stale-listing flexibility.
- 3 sale attempts since 9y ago with the ask held roughly flat each time — persistent listings suggest the price (not the market) is what's stuck; bring a comps-based counter.
- Current owner paid $14k; list at $24k implies a 75% gain — meaningful room to come down on a strong offer.
Risks & watch-outs
- Watch-outs: built in 1908 — expect roof / HVAC / electrical / plumbing capex.
Questions for the listing agent
- It's been on market 58 days. Have you received any prior offers? Is the seller open to a 3% concession, seller financing, or rate buy-down credit?
- Built in 1908 — when were the roof, HVAC, electrical panel, plumbing, and water heater last replaced?
- Is there a deadline driving the sale (1031 exchange, divorce, estate, relocation)? That informs how much negotiation room exists.
- Schools are F-rated, which usually means shorter tenancies and higher turnover. Who's the typical renter profile here, and what's been the actual vacancy rate?
- The area grade is low — what's the realistic commute time and amenity access for the typical tenant pool here? Any planned neighborhood developments (good or bad) we should know about?
- What's the average days-on-market for RENTAL listings here right now (not sales)? A rising rental-DOM trend means longer vacancies and softer asking-rent achievability than the comps imply.
- What's the recent tenant-quality profile in this submarket — average credit score on applications, eviction rate, late-payment / NSF rate, and stable-employment percentage? A property-management company in the area should have these aggregated.
- How much new for-sale + rental construction is in the pipeline within 1–3 miles? Heavy new supply typically softens prices + rents 12–24 months out; constrained supply supports both.
Investment metrics
- 1% rule
- 5.05% ✓
- Cap rate
- 45.57%
- Cash-on-cash
- 140.29%
- DSCR
- 7.24
- GRM
- 1.6
CMA / ARV
- ARV (median comp)
- $70,126
- List price
- $24,500
- Delta
- -65.06%
- Verdict
- UNDERPRICED
- Comps
- 20 within 1.0 mi
Show comp detail 12 sales within ~0.75 mi
| Address | Dist | Beds/Ba | Sqft | Sold | Price | $/sf | Match |
|---|---|---|---|---|---|---|---|
| 513 Garden Ct | 0.53mi | 3/1.5 | 1,248 (+1%) | 2mo | $130,000 | $104 | 70 |
| 105 General Braddock Dr | 0.41mi | 3/1.5 | 1,232 (-0%) | 13mo | $125,000 | $101 | 67 |
| 568 Stokes Ave | 0.26mi | 2/1.0 (-1) | 1,178 (-5%) | 11mo | $70,000 | $59 | 66 |
| 712 Ajax Way | 0.60mi | 4/1.0 (+1) | 1,244 (+1%) | 2mo | $50,000 | $40 | 65 |
| 301 Hawkins Ave | 0.63mi | 2/1.5 (-1) | 1,260 (+2%) | 4mo | $26,000 | $21 | 57 |
| 31 Demmer Ave | 0.69mi | 2/1.5 (-1) | 1,260 (+2%) | 7mo | $170,000 | $135 | 52 |
| 203 Comrie Ave | 0.70mi | 3/1.0 | 1,296 (+5%) | 9mo | $35,000 | $27 | 52 |
| 1584 Brinton Rd | 0.32mi | 3/2.0 | 1,092 (-12%) | 13mo | $225,000 | $206 | 51 |
| 33 Kenmore Ave | 0.69mi | 3/1.0 | 1,400 (+13%) | 0mo | $200,000 | $143 | 46 |
| 212 Parklane Dr | 0.49mi | 3/1.0 | 1,080 (-13%) | 14mo | $144,450 | $134 | 45 |
| 1326 Wolfe Ave | 0.65mi | 2/1.0 (-1) | 1,108 (-10%) | 7mo | $55,850 | $50 | 41 |
| 122 Marwood Ave | 0.66mi | 4/1.0 (+1) | 1,344 (+9%) | 12mo | $140,000 | $104 | 40 |
Match score weights: distance 35% · size 25% · config 20% · recency 20%. Top-matched comps best support the ARV.
Projected returns pro-forma
-1.62% appreciation · 3.0% rent growth · sell at horizon
- IRR
- —
- Equity multiple
- 8.08×
- Total profit
- $48,577
- Equity at exit
- $5,191
- IRR
- —
- Equity multiple
- 16.96×
- Total profit
- $109,478
- Equity at exit
- $4,856
Cash invested: $6,860 (down + closing). Projections, not guarantees.
Landlord ↔ Tenant lean methodology
- Overall (STATE)
- 62 Landlord-Friendly
- State Pennsylvania
- 62 Landlord-Friendly · EVEN
- County
- — inherits STATE
- City
- — inherits STATE
ZIP-level market 15104
- Home prices YoY
- -1.1%
- Active inventory
- 37
- Price-to-rent
- 1.6×
Monthly cashflow live
- Estimated rent
- $1,238 high interval (Pro) →
- Mortgage (P&I)
- −$128
- Tax from tax record
- −$37 /mo · $444/yr
- Insurance
- −$10
- HOA
- −$0
- Vacancy / Maint / Mgmt
- −$260
- Net cashflow
- $802
Break-even live
UW: 25.0% down · 7.5% · 30yr · 1.5% tax · 5.0% vac · 8.0% maint · 8.0% mgmt
Financing live
Cash to close
- Down payment
- $6,125
- Closing costs
- $735
- Reserves months
- —
- Total cash needed
- —
Loan-product check · same deal, 3 products live
Conventional
25% down · 7.5% · 30yr
- Down + closing
- —
- Monthly P&I
- —
- Monthly cashflow
- —
- DSCR
- —
- Eligible?
- —
Personal DTI + credit; lowest rate.
DSCR
20% down · 8.5% · 30yr
- Down + closing
- —
- Monthly P&I
- —
- Monthly cashflow
- —
- DSCR
- —
- Eligible?
- —
No personal income docs; deal must DSCR.
Hard money
10% down · 12.0% · 12mo
- Down + closing
- —
- Monthly P&I
- —
- Monthly cashflow
- —
- DSCR
- —
- Eligible?
- —
Short-term bridge; refi at stabilization.
Rent comps 17 comps
| Address | Beds | Baths | Sqft | Rent | $/sqft | DOM | Units | Dist |
|---|---|---|---|---|---|---|---|---|
| 817 Kirkpatrick Ave Unit 8171-A Braddock, PA | 2.0 | 1.0 | 866 | $800 | $0.92 | 43d | 1 | 0.38mi |
| 537 6th St Braddock, PA | 3.0 | 1.0 | 1360 | $1,400 | $1.03 | 43d | 1 | 0.51mi |
| 227 Parklane Dr Unit Parklane Dr unit North Braddock, PA | 3.0 | 1.0 | 1107 | $1,500 | $1.36 | 12d | 1 | 0.56mi |
| 1310 Brinton Ave Unit 1 Braddock, PA | 2.0 | 1.0 | 800 | $1,000 | $1.25 | 43d | 1 | 0.70mi |
| 144 Comrie Ave Braddock, PA | 3.0 | 1.0 | 1000 | $1,250 | $1.25 | 23d | 1 | 0.74mi |
| 219 North Ave Unit 1 East Pittsburgh, PA | 2.0 | 1.0 | 850 | $900 | $1.06 | 2d | 1 | 0.85mi |
| 539 Atlantic Ave Unit 2 Pittsburgh, PA | 3.0 | 1.0 | 1200 | $995 | $0.83 | 43d | 1 | 0.91mi |
| 2673 Woodstock Ave Pittsburgh, PA | 3.0 | 1.0 | 1000 | $1,190 | $1.19 | 23d | 1 | 1.01mi |
| 101 Center St East Pittsburgh, PA | 3.0 | 1.0 | 1500 | $1,505 | $1.00 | 10d | 1 | 1.02mi |
| 207 Montana Ave Pittsburgh, PA | 2.0 | 1.0 | 840 | $1,000 | $1.19 | 23d | 1 | 1.06mi |
| 212 Kenmawr Ave Braddock, PA | 2.0 | 1.5 | 1417 | $1,300 | $0.92 | 43d | 1 | 1.07mi |
| 407 Bessemer Ave Unit 407-3 East Pittsburgh, PA | 2.0 | 1.0 | 1280 | $775 | $0.61 | 43d | 1 | 1.17mi |
| 481 Filmore Rd Pittsburgh, PA | 3.0 | 1.5 | 1165 | $1,700 | $1.46 | 7d | 1 | 1.29mi |
| 505 Washington St Turtle Creek, PA | 2.0 | 1.0 | 1064 | $1,200 | $1.13 | 43d | 1 | 1.41mi |
| 7645 Highland Ave Pittsburgh, PA | 3.0 | 1.0 | 1161 | $1,325 | $1.14 | 7d | 1 | 1.43mi |
| 2323 Patterson Ave Unit NA Pittsburgh, PA | 3.0 | 1.0 | 1440 | $1,500 | $1.04 | 23d | 1 | 1.49mi |
| 2323 Patterson Ave Pittsburgh, PA | 3.0 | 1.0 | 1440 | $1,800 | $1.25 | 43d | 1 | 1.49mi |
Listing history 20 events
-
2026-06-18days on market $24,500 Active 58 DOM
-
2026-06-17days on market $24,500 Active 57 DOM
-
2026-06-16days on market $24,500 Active 56 DOM
-
2026-06-15days on market $24,500 Active 55 DOM
-
2026-06-13days on market $24,500 Active 53 DOM
-
2026-06-09days on market $24,500 Active 49 DOM
-
2026-06-08days on market $24,500 Active 48 DOM
-
2026-06-07days on market $24,500 Active 47 DOM
-
2026-06-05days on market $24,500 Active 44 DOM
-
2026-06-03days on market $24,500 Active 43 DOM
-
2026-06-02days on market $24,500 Active 42 DOM
-
2026-06-01days on market $24,500 Active 41 DOM
-
2026-05-31days on market $24,500 Active 40 DOM
-
2026-04-21$24,500 Active 536-char remark
Show marketing remark (536 chars)
Investor Special – High Upside Opportunity This property is not for the faint of heart—it requires significant work, but the potential payoff makes it well worth the effort. Whether you’re looking for a fix-and-hold or a cash-out strategy, this is a strong value-add opportunity. Roll up your sleeves and take on the project yourself, or bring in a contractor—either way, there is sufficient margin to make this a worthwhile investment. A great opportunity for experienced investors looking to maximize returns.
-
2021-03-05soldstatus $14,000 Closed 159-char remark
Show marketing remark (159 chars)
Investment opportunity, turn this property over and collect the cash flow for years to come. Property is sold as-is. Cash sale only. No showing until 1/26/2021
-
2021-01-29status Pending 159-char remark
Show marketing remark (159 chars)
Investment opportunity, turn this property over and collect the cash flow for years to come. Property is sold as-is. Cash sale only. No showing until 1/26/2021
-
2021-01-22$19,900 Active 159-char remark
Show marketing remark (159 chars)
Investment opportunity, turn this property over and collect the cash flow for years to come. Property is sold as-is. Cash sale only. No showing until 1/26/2021
-
2018-03-31historical Expired
-
2017-07-07$18,900 Active
-
1990-06-11soldstatus $14,000
ⓘ Source: listings_history table (triggers on properties + properties_extension) + one-shot
backfill from property_details.listing_events for pre-trigger history.
Tax reassessment forecast PA · Partial reset (capped growth)
- Current annual tax
- $444 · $37/mo
- Projected year-2 tax
- $444 · $37/mo
- Expected delta
- $0/yr ($0/mo · 0.0%)
ⓘ Screening estimate from a state-policy table — verify with the county assessor before closing.
Climate risk First Street
- Flood 1/10 Low FEMA zone X (unshaded) · 0% chance over 30 yrs
- Wildfire 1/10 Low
- Heat 3/10 Moderate 7 d/yr ≥98°F today · 17 d/yr by 30 yrs out
- Wind 2/10 Low
- Air quality 4/10 Moderate 4 unhealthy d/yr today · 5 by 30 yrs out
Nearby sold comps map
Loading sold comps map…
Walkable amenities ~0.75 mi
Loading nearby amenities…
Taxation est. · year 1
- Rental income
- $14,851
- − Mortgage interest
- −$1,372
- − Property taxes
- −$444
- − Insurance
- −$122
- − Repairs & maintenance
- −$1,188
- − Management
- −$1,188
- − Depreciation
- −$713
- Taxable income
- $9,823
- Est. tax owed @ 24.0%
- −$2,358
- After-tax cash flow
- $7,266/yr
For passive investors: Depreciation is non-cash, so a rental often shows a tax loss while cash-flowing — sheltering income. Rental losses are passive: they offset passive income freely, and up to $25,000/yr can offset ordinary (W-2) income if you actively participate and your MAGI is under $100k (phasing out to $0 by $150k); unused losses carry forward. On sale, claimed depreciation is recaptured at up to 25%, and gains may owe capital-gains tax (a 1031 exchange can defer both). Figures are a year-1 estimate at your 24.0% rate — not tax advice; consult a CPA.
Schools (NCES district)
- District
- Woodland Hills SD
- NCES district ID
- 4216500
- Math proficiency
- 13% ▼ -13.00%
- Reading proficiency
- 30% ▼ -10.00%
- Median HH income
- $41,803
- Composite
- 18.31/100
- National rank
- #8954
- State rank
- #486 of 539 in PA
Livability — North Braddock
- Score
- 73/100
- State rank
- #550
- US rank
- #5126
Category grades
Schools grade is shown separately in the Schools card above.
Census & demographics
- Census place
- North Braddock, PA
- County
- Allegheny County · 1,022,028 people
- City population
- 7,946
- Metro
- Pittsburgh, PA
- Population (ZIP)
- 8,034
- Household income
- $40,104
- Rent vs Own
- Severe rent burden
- 515.0
Population outlook (Allegheny County) Hauer SSP2
- Today (2025)
- 1,250,282 people
- By 2030
- 1,256,482 · +0.5%
- By 2040
- 1,256,318 · +0.5%
- By 2050
- 1,244,169 · -0.5%
- By 2075
- 1,197,693 · -4.2%
- By 2100
- 1,093,187 · -12.6%
Race, ethnicity, and origin ACS 2023
- Neighborhood character
- Diverse neighborhood (Simpson 0.56)
- Race & ethnicity
- Black 59% White 31% Two or more races 6% Hispanic / Latino 3%
- Common ancestry
- Romanian 4% Hispanic 1% Lithuanian 1%
- Foreign-born
- 0%
- Languages at home
- 97% English-only · Spanish 2%
Political lean MEDSL · Allegheny
- 2024 margin
- Strong D (+20.3) · D 59.7% · R 39.4%
- 2008→2024 swing
- +4.8pp toward D · 2008: 15.5pp · 2024: 20.3pp
- All cycles
- 2024: D+20.3 2020: D+20.4 2016: D+16.4 2012: D+14.4 2008: D+15.5
Not yet ingested
- Civics
- —
Market trends
- HPI YoY
- ▼ -1.62%
- Current HPI
- 138.912
- Rent YoY
- —
- Metro
- Pittsburgh, PA
- State GDP YoY
- ▲ 1.68%
- F500 in state
- 34
Industry mix (Fortune 500 HQ in PA)
| Industry | F500 HQs | Revenue |
|---|---|---|
| Healthcare | 2 | $309B |
|
||
| Insurance | 2 | $27B |
|
||
| Telecommunications / Media | 1 | $124B |
|
||
| Industrial Distribution | 1 | $22B |
|
||
| Financial Services | 1 | $20B |
|
||
| Chemicals / Materials | 1 | $18B |
|
||
Price history
+75.0% since first listed7 events — show timeline
- 2026-04-21 Listed $24,500 West Penn MLS
- 2021-03-05 Sold (MLS) $14,000 West Penn MLS
- 2021-01-29 Pending — West Penn MLS
- 2021-01-22 Listed $19,900 West Penn MLS
- 2018-03-31 Delisted — West Penn MLS
- 2017-07-07 Listed $18,900 West Penn MLS
- 1990-06-11 Sold (Public Records) $14,000 Public Records
Property tax history
-9.5%/yrLatest (2026): $444 · +2.9% YoY. Source: county tax records.
Cash-flow waterfall
monthlySold comps — $/sqft
last 12 mo · ≤1 miLoading sold comps…