607 S Walnut St · Georgetown, IL
Flood risk 1/10 · Minimal
- FEMA flood zone
- X (unshaded)
- Chance of flooding over 30 yrs
- 0.0%
- Est. flood insurance / yr
- $473 – $860
Fire risk 1/10 · Minimal
- Est. fire insurance / yr
- $804 – $1,492
Heat risk 3/10 · Minor
- Hot days now (above 103°F)
- 7 days/yr
- Hot days in 30 yrs
- 18 days/yr
Wind risk 2/10 · Minimal
- Chance of severe wind over 30 yrs
- 1.0%
Air-quality risk 2/10 · Minimal
- Unhealthy air days now
- 1 days/yr
- Unhealthy air days in 30 yrs
- 1 days/yr
Risk factors via First Street. Map © Google.
Why this score? — see what drove the C- grade
The composite is a weighted blend of 9 inputs, each scored 0–100. Each bar is that input's sub-score; the figure is the points it added to the 100-point composite (weight × sub-score).
- Cash flow +13.8/30.0
- Appreciation +10.0/10.0
- ARV discount +7.5/15.0
- Schools +5.0/10.0
- DSCR +4.2/10.0
- 1% rule +3.8/10.0
- Livability +3.2/5.0
- Rent growth +2.5/5.0
- Condition / age +2.5/5.0
$119,900
🖨 Deal sheet 📄 Offer letter ✓ Due diligence
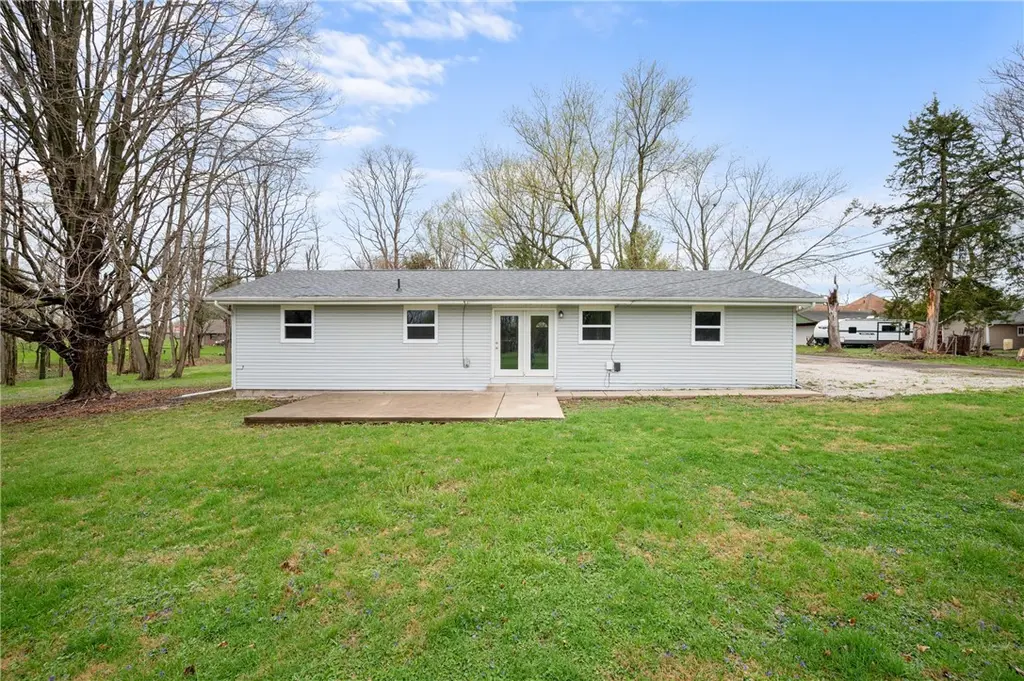
Listing remarks
Completely updated and move-in ready! This 3-bedroom, 1 full bath home offers approximately 1,100 square feet of comfortable living space along with a 1-car attached garage. Recent improvements include a new roof, windows, water heater, and a fully updated HVAC system with all new ductwork, giving peace of mind on major components. Inside, the home has been refreshed from top to bottom featuring new flooring and carpet, updated lighting fixtures, outlets, and switches, along with fresh paint throughout. The bathroom has been updated with a new toilet and vanity, and additional upgrades include new bifold doors and modern finishes throughout. The layout offers a functional flow with comforta
Key facts
- 9,583 sq ft lot
- Garage
- Built 1975
Property features AI
Finance
- Other: Lot approximately 0.22 acres; Residential zoning (RES)
Exterior
- Parking: Attached garage (1 car)
- Utilities: Public water; Septic system
- Home design: Single-family residence; One-story home; Vinyl siding exterior
- Construction: Shingle roof
- Exterior features: Patio; Gravel road access; Private maintained road frontage; Located on a private road
Interior
- Bathrooms: One full bathroom
- Heating & cooling: Electric forced-air heating; Central air conditioning
- Interior features: Electric water heater; Crawl space basement
- Laundry & utility: Main-level laundry
Neighborhood map
What this means for you Summary
Snapshot
- This is a 3-bed/1.0-bath other listed at $120k.
Deal economics
- At list price, monthly cash flow is $10 ($119/yr) — positive.
- The deal already cash-flows at list — no discount required.
- To meet the 1% rule (rent ≥ 1% of price), the offer needs to be $106k (11.7% below list).
- Recommended offer: $106k (11.7% below list) — sets the bar for 1% rule.
Location & tenants
- Location reads 63/100 on livability (#783 in IL) — a middle-class / working-renter tenant base. Strengths: cost of living A+, housing A+, crime A-; Watch: employment D+, schools F, amenities F.
- Market conditions: 3 comparable units currently listed for rent nearby; rentals leasing fast (median 13d on market — plan ~1-2 weeks tenant-placement turnaround); 8 units permitted in Vermilion County in 2024 (0 in 5+ unit buildings).
Forward outlook
- In year one you build about $13k of equity ($829 loan paydown + $12k appreciation (10.0% local appreciation)).
- Vermilion County population projected at -24% by 2050 — secular population decline; favor cash flow + early exit over multi-decade hold.
- At projected returns (10.0% appreciation + 3.0% rent growth), your $34k cash investment doubles in ~3 years — after that, you're playing with house money.
- By year 3, paydown + projected appreciation supports a ~$32k cash-out refi (75% LTV) — recoverable capital for the next deal without selling this one.
Negotiation context
- It's been on market 40 days — a 3% lower offer ($116k) is reasonable based on typical stale-listing flexibility.
Questions for the listing agent
- It's been on market 40 days. Have you received any prior offers? Is the seller open to a 12% concession, seller financing, or rate buy-down credit?
- Built in 1975 — when were the roof, HVAC, electrical panel, plumbing, and water heater last replaced?
- Is there a deadline driving the sale (1031 exchange, divorce, estate, relocation)? That informs how much negotiation room exists.
- Schools are F-rated, which usually means shorter tenancies and higher turnover. Who's the typical renter profile here, and what's been the actual vacancy rate?
- What's the average days-on-market for RENTAL listings here right now (not sales)? A rising rental-DOM trend means longer vacancies and softer asking-rent achievability than the comps imply.
- What's the recent tenant-quality profile in this submarket — average credit score on applications, eviction rate, late-payment / NSF rate, and stable-employment percentage? A property-management company in the area should have these aggregated.
- How much new for-sale + rental construction is in the pipeline within 1–3 miles? Heavy new supply typically softens prices + rents 12–24 months out; constrained supply supports both.
Investment metrics
- 1% rule
- 0.88% ✗
- Cap rate
- 6.39%
- Cash-on-cash
- 0.36%
- DSCR
- 1.02
- GRM
- 9.4
CMA / ARV
No comps found within radius.
Projected returns pro-forma
10.0% appreciation · 3.0% rent growth · sell at horizon
- IRR
- 24.5%
- Equity multiple
- 2.96×
- Total profit
- $65,949
- Equity at exit
- $108,015
- IRR
- 21.7%
- Equity multiple
- 6.77×
- Total profit
- $193,741
- Equity at exit
- $232,939
Cash invested: $33,572 (down + closing). Projections, not guarantees.
Landlord ↔ Tenant lean methodology
- Overall (STATE)
- 43 Moderately Tenant-Leaning
- State Illinois
- 43 Moderately Tenant-Leaning · D+7
- County
- — inherits STATE
- City
- — inherits STATE
ZIP-level market 61846
- Home prices YoY
- 9.4%
- Price-to-rent
- 9.4×
Monthly cashflow live
- Estimated rent
- $1,059 medium interval (Pro) →
- Mortgage (P&I)
- −$629
- Tax from tax record
- −$148 /mo · $1,775/yr
- Insurance
- −$50
- HOA
- −$0
- Vacancy / Maint / Mgmt
- −$222
- Net cashflow
- $10
Break-even live
UW: 25.0% down · 7.5% · 30yr · 1.5% tax · 5.0% vac · 8.0% maint · 8.0% mgmt
Financing live
Cash to close
- Down payment
- $29,975
- Closing costs
- $3,597
- Reserves months
- —
- Total cash needed
- —
Loan-product check · same deal, 3 products live
Conventional
25% down · 7.5% · 30yr
- Down + closing
- —
- Monthly P&I
- —
- Monthly cashflow
- —
- DSCR
- —
- Eligible?
- —
Personal DTI + credit; lowest rate.
DSCR
20% down · 8.5% · 30yr
- Down + closing
- —
- Monthly P&I
- —
- Monthly cashflow
- —
- DSCR
- —
- Eligible?
- —
No personal income docs; deal must DSCR.
Hard money
10% down · 12.0% · 12mo
- Down + closing
- —
- Monthly P&I
- —
- Monthly cashflow
- —
- DSCR
- —
- Eligible?
- —
Short-term bridge; refi at stabilization.
Rent comps 3 comps
| Address | Beds | Baths | Sqft | Rent | $/sqft | DOM | Units | Dist |
|---|---|---|---|---|---|---|---|---|
| 212 Logan St Georgetown, IL | 2.0 | 1.0 | 1000 | $895 | $0.90 | 20d | 1 | 0.51mi |
| 208 Logan St Georgetown, IL | 3.0 | 1.0 | 1100 | $1,200 | $1.09 | 12d | 1 | 0.54mi |
| 303 W 12th St Georgetown, IL | 3.0 | 1.0 | 1300 | $1,100 | $0.85 | 5d | 1 | 1.29mi |
Listing history 3 events
-
2026-05-20status Pending
-
2026-05-02historical Active Under Contract
-
2026-04-10$119,900 Active
ⓘ Source: listings_history table (triggers on properties + properties_extension) + one-shot
backfill from property_details.listing_events for pre-trigger history.
Tax reassessment forecast IL · Partial reset (capped growth)
- Current annual tax
- $1,775 · $148/mo
- Projected year-2 tax
- $2,248 · $187/mo
- Expected delta
- +$473/yr (+$39/mo · 26.7%)
ⓘ Screening estimate from a state-policy table — verify with the county assessor before closing.
Climate risk First Street
- Flood 1/10 Low FEMA zone X (unshaded) · 0% chance over 30 yrs
- Wildfire 1/10 Low
- Heat 3/10 Moderate 7 d/yr ≥103°F today · 18 d/yr by 30 yrs out
- Wind 2/10 Low 100% chance of damaging wind over 30 yrs
- Air quality 2/10 Low 1 unhealthy d/yr today · 1 by 30 yrs out
Nearby sold comps map
Loading sold comps map…
Walkable amenities ~0.75 mi
Loading nearby amenities…
Taxation est. · year 1
- Rental income
- $12,708
- − Mortgage interest
- −$6,716
- − Property taxes
- −$1,775
- − Insurance
- −$600
- − Repairs & maintenance
- −$1,017
- − Management
- −$1,017
- − Depreciation
- −$3,488
- Taxable loss
- −$1,904
- Est. tax savings @ 24.0%
- +$457
- After-tax cash flow
- $576/yr
For passive investors: Depreciation is non-cash, so a rental often shows a tax loss while cash-flowing — sheltering income. Rental losses are passive: they offset passive income freely, and up to $25,000/yr can offset ordinary (W-2) income if you actively participate and your MAGI is under $100k (phasing out to $0 by $150k); unused losses carry forward. On sale, claimed depreciation is recaptured at up to 25%, and gains may owe capital-gains tax (a 1031 exchange can defer both). Figures are a year-1 estimate at your 24.0% rate — not tax advice; consult a CPA.
Schools (NCES district)
No district data.
Livability — Georgetown
- Score
- 63/100
- State rank
- #783
- US rank
- #15620
Category grades
Schools grade is shown separately in the Schools card above.
Census & demographics
- Census place
- Georgetown, IL
- Population (ZIP)
- 4,484
Population outlook (Vermilion County) Hauer SSP2
- Today (2025)
- 72,775 people
- By 2030
- 69,235 · -4.9%
- By 2040
- 62,360 · -14.3%
- By 2050
- 55,539 · -23.7%
- By 2075
- 40,606 · -44.2%
- By 2100
- 26,985 · -62.9%
Race, ethnicity, and origin ACS 2023
- Neighborhood character
- Predominantly White (89%)
- Race & ethnicity
- White 89% Hispanic / Latino 5% Black 5% Two or more races 4%
- Hispanic origin (detail)
- Mexican 5%
- Common ancestry
- Slovak 2% Serbian 1% Romanian 1%
- Foreign-born
- 1% · Canada
- Languages at home
- 99% English-only · Spanish 1%
Political lean MEDSL · Vermilion
- 2024 margin
- Solid R (+35.7) · D 31.4% · R 67.0% · Other 1.6%
- 2008→2024 swing
- -36.2pp toward R · 2008: 0.6pp · 2024: -35.7pp
- All cycles
- 2024: R+35.7 2020: R+32.9 2016: R+29.2 2012: R+15.7 2008: D+0.6
Not yet ingested
- Civics
- —
Market trends
- HPI YoY
- ▲ 21.78%
- Current HPI
- 254.5489
- Rent YoY
- —
- Metro
- —
- State GDP YoY
- ▲ 1.59%
- F500 in state
- 60
Industry mix (Fortune 500 HQ in IL)
| Industry | F500 HQs | Revenue |
|---|---|---|
| Insurance | 4 | $201B |
|
||
| Consumer Goods | 4 | $87B |
|
||
| Industrial Machinery | 3 | $64B |
|
||
| Healthcare | 2 | $55B |
|
||
| Retail / Pharmacy | 1 | $148B |
|
||
| Agriculture / Food | 1 | $86B |
|
||
Price history
3 events — show timeline
- 2026-05-20 Pending — CIBR
- 2026-05-02 Contingent — CIBR
- 2026-04-10 Listed $119,900 CIBR
Property tax history
+3.7%/yrLatest (2024): $1,775 · +264.7% YoY. Source: county tax records.
Cash-flow waterfall
monthlySold comps — $/sqft
last 12 mo · ≤1 miLoading sold comps…