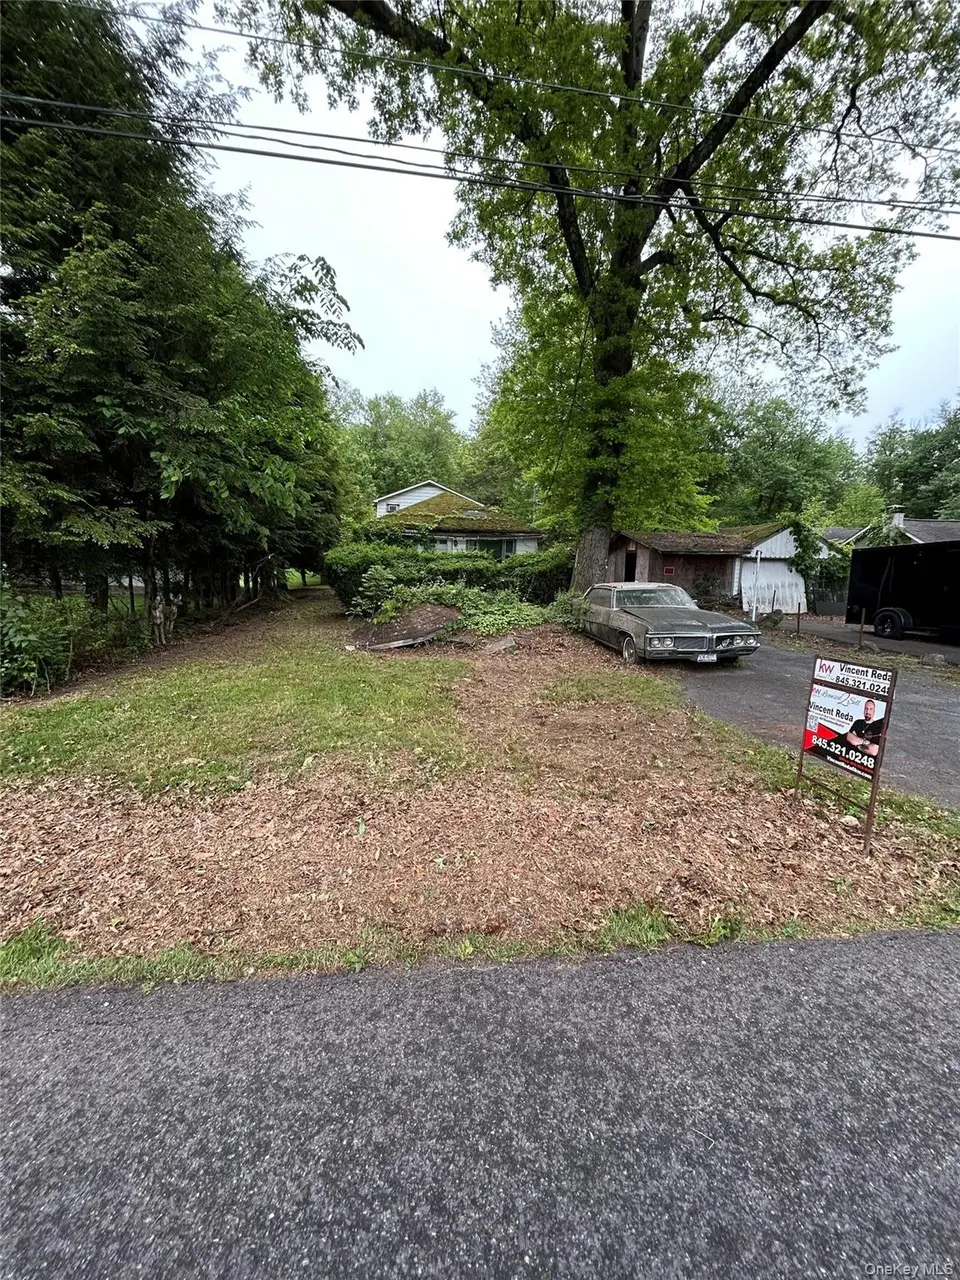
153 Glenerie Blvd · Ruby, NY
Flood risk 5/10 · Moderate
- FEMA flood zone
- X (shaded)
- Chance of flooding over 30 yrs
- 0.24%
- Est. flood insurance / yr
- $507 – $1,088
Fire risk 3/10 · Minor
- Est. fire insurance / yr
- $691 – $1,283
Heat risk 4/10 · Minor
- Hot days now (above 99°F)
- 7 days/yr
- Hot days in 30 yrs
- 15 days/yr
Wind risk 3/10 · Minor
- Chance of severe wind over 30 yrs
- 8.0%
Air-quality risk 2/10 · Minimal
- Unhealthy air days now
- 1 days/yr
- Unhealthy air days in 30 yrs
- 1 days/yr
Risk factors via First Street. Map © Google.
Why this score? — see what drove the C+ grade
The composite is a weighted blend of 9 inputs, each scored 0–100. Each bar is that input's sub-score; the figure is the points it added to the 100-point composite (weight × sub-score).
- Cash flow +22.4/30.0
- ARV discount +15.0/15.0
- 1% rule +7.7/10.0
- DSCR +7.2/10.0
- Schools +4.4/10.0
- Rent growth +2.5/5.0
- Livability +2.5/5.0
- Condition / age +2.5/5.0
- Appreciation +0.0/10.0
$174,999
🖨 Deal sheet (PDF) 📄 Offer letter ✓ Due diligence
Listing remarks
Opportunity knocks in the heart of the Hudson Valley! This two-story, 2-bedroom, 1-bath single-family home sits on a 0.32-acre lot in the charming hamlet of Saugerties, NY — making it an ideal investment property, starter home, or renovation project for savvy buyers looking to build equity in one of Ulster County's most sought-after communities. Built in 1926, this home offers classic character and solid bones, with an unfinished basement providing additional storage or the potential to expand your living space. The two-story layout gives a natural separation between living and sleeping areas, adding functional versatility for investors eyeing rental income or owner-occupants alike. L
Key facts
- 0.32 acre lot
- Garage
- Built 1926
Property features AI
Exterior
- Parking: Driveway; 1-car garage
- Utilities: Septic tank; Electricity connected; Sewer connected; Water connected
- Home design: Single family residence
- Construction: Vinyl siding construction
- Exterior features: Vinyl siding; Not waterfront
Interior
- Kitchen: No appliances listed
- Bedrooms: Total of 5 rooms (bedroom count not specified)
- Bathrooms: 1 full bathroom
- Heating & cooling: Baseboard, Electric, Oil heating; No central cooling
- Interior features: Deck; Unfinished basement; Pull-down attic stairs
- Laundry & utility: No laundry appliances listed
Neighborhood map
What this means for you Summary
Snapshot
- This is a 2-bed/1.0-bath single-family listed at $175k.
Deal economics
- At list price, monthly cash flow is $292 ($4k/yr) — positive.
- The deal already cash-flows at list — no discount required.
- Meets the 1% rule at list price ($2k rent vs $175k).
- Recommended offer: $172k (1.5% below list) — sets the bar for market timing.
- Cap rate 8.3% vs local median 2.5% in Ruby — top-decile yield for the area; either an underpriced asset or a hidden risk that comps aren't pricing in. Stress-test before assuming the spread holds.
Location & tenants
- Location reads: area grade C — affects rentability + tenant quality, not the cash-flow math above.
- Kingston City School District (urban): math 44% / reading 59% proficiency, ranked #355 of 590 in NY (top 60%) — acceptable for families but not a draw, mixed tenant base, ~2y average lease.
- Zoned schools: E R Crosby Elementary School (math 37% / reading 57%, grade D-, #1,195 of 2,108 statewide, top 60%, 303 students, 61% FRL); M Clifford Miller Middle School (math 21% / reading 37%, grade F, #566 of 729 statewide, top 78%, 822 students, 65% FRL); Kingston High School (math 94% / reading 91%, grade A+, #153 of 1,100 statewide, top 14%, 1,856 students, 85% FRL) — zoned schools average 70% FRL vs 45% district-wide (25 pts higher); higher-poverty schools than district average — tighter screening recommended.
- Market conditions: 173 active listings in the ZIP; solid renter incomes; 464 units permitted in Ulster County in 2024 (170 in 5+ unit buildings).
- This rent runs 33% of the median local income ($81k/yr) — at the standard rent-burdened threshold; future hikes will face affordability resistance.
Forward outlook
- Local home prices are declining (-3.0%/yr); year-one equity from $1k of loan paydown is wiped out by about $5k of value loss. Plan a longer hold.
- Ulster County population projected at -14% by 2050 — secular population decline; favor cash flow + early exit over multi-decade hold.
Negotiation context
- It's been on market 20 days — a 2% lower offer ($172k) is reasonable based on typical stale-listing flexibility.
- Current owner paid $85k; list at $175k implies a 106% gain — meaningful room to come down on a strong offer.
Risks & watch-outs
- Watch-outs: property tax is 3.3% of price; built in 1926 — expect roof / HVAC / electrical / plumbing capex.
- Climate carrying-cost: moderate flood risk — expect insurance premiums to compound above CPI over the hold.
Questions for the listing agent
- Built in 1926 — when were the roof, HVAC, electrical panel, plumbing, and water heater last replaced?
- Property tax is high relative to price — has the assessment been appealed recently, and will the sale trigger a re-assessment?
- Is there a deadline driving the sale (1031 exchange, divorce, estate, relocation)? That informs how much negotiation room exists.
- What's the average days-on-market for RENTAL listings here right now (not sales)? A rising rental-DOM trend means longer vacancies and softer asking-rent achievability than the comps imply.
- What's the recent tenant-quality profile in this submarket — average credit score on applications, eviction rate, late-payment / NSF rate, and stable-employment percentage? A property-management company in the area should have these aggregated.
- How much new for-sale + rental construction is in the pipeline within 1–3 miles? Heavy new supply typically softens prices + rents 12–24 months out; constrained supply supports both.
Investment metrics
- 1% rule
- 1.27% ✓
- Cap rate
- 8.29%
- Cash-on-cash
- 7.15%
- DSCR
- 1.32
- GRM
- 6.5
CMA / ARV
- ARV (on-the-fly)
- $331,200
- Comps found
- 1
Show comp detail 1 sale within ~0.75 mi
| Address | Dist | Beds/Ba | Sqft | Sold | Price | $/sf | Match |
|---|---|---|---|---|---|---|---|
| 174 North Dr | 0.19mi | 3/1.0 (+1) | 1,609 (+12%) | 6mo | $370,000 | $230 | 61 |
Match score weights: distance 35% · size 25% · config 20% · recency 20%. Top-matched comps best support the ARV.
Projected returns pro-forma
-3.0% appreciation · 3.0% rent growth · sell at horizon
- IRR
- -5.2%
- Equity multiple
- 0.80×
- Total profit
- $-9,572
- Equity at exit
- $26,093
- IRR
- 4.5%
- Equity multiple
- 1.33×
- Total profit
- $16,391
- Equity at exit
- $15,131
Cash invested: $49,000 (down + closing). Projections, not guarantees.
Landlord ↔ Tenant lean methodology
- Overall (STATE)
- 15 Strongly Tenant-Friendly
- State New York
- 15 Strongly Tenant-Friendly · D+10
- County
- — inherits STATE
- City
- — inherits STATE
ZIP-level market 12477
- Home prices YoY
- -18.1%
- Active inventory
- 173
- Price-to-rent
- 6.5×
Monthly cashflow live
- Estimated rent
- $2,230 medium interval (Pro) →
- Mortgage (P&I)
- −$918
- Tax from tax record
- −$479 /mo · $5,748/yr
- Insurance
- −$73
- HOA
- −$0
- Vacancy / Maint / Mgmt
- −$468
- Net cashflow
- $292
Break-even live
Sensitivity live
| Price | -10% $391 | -5% $341 | +0% $292 | +5% $242 | +10% $193 |
|---|---|---|---|---|---|
| Rent | -10% $116 | -5% $204 | +0% $292 | +5% $380 | +10% $468 |
| Rate | -1.0pp $380 | -0.5pp $336 | base $292 | +0.5pp $247 | +1.0pp $200 |
UW: 25.0% down · 7.5% · 30yr · 1.5% tax · 5.0% vac · 8.0% maint · 8.0% mgmt
Financing live
Cash to close
- Down payment
- $43,750
- Closing costs
- $5,250
- Reserves months
- —
- Total cash needed
- —
Loan-product check · same deal, 3 products live
Conventional
25% down · 7.5% · 30yr
- Down + closing
- —
- Monthly P&I
- —
- Monthly cashflow
- —
- DSCR
- —
- Eligible?
- —
Personal DTI + credit; lowest rate.
DSCR
20% down · 8.5% · 30yr
- Down + closing
- —
- Monthly P&I
- —
- Monthly cashflow
- —
- DSCR
- —
- Eligible?
- —
No personal income docs; deal must DSCR.
Hard money
10% down · 12.0% · 12mo
- Down + closing
- —
- Monthly P&I
- —
- Monthly cashflow
- —
- DSCR
- —
- Eligible?
- —
Short-term bridge; refi at stabilization.
Listing history 17 events
-
2026-06-19days on market $174,999 Active 20 DOM
-
2026-06-18days on market $174,999 Active 19 DOM
-
2026-06-17days on market $174,999 Active 18 DOM
-
2026-06-16days on market $174,999 Active 17 DOM
-
2026-06-15days on market $174,999 Active 16 DOM
-
2026-06-14days on market $174,999 Active 14 DOM
-
2026-06-12days on market $174,999 Active 13 DOM
-
2026-06-09days on market $174,999 Active 10 DOM
-
2026-06-08days on market $174,999 Active 9 DOM
-
2026-06-07days on market $174,999 Active 8 DOM
-
2026-06-03days on market $174,999 Active 4 DOM
-
2026-06-02remarks 693-char remark
-
2026-06-02days on market $174,999 Active 3 DOM
-
2026-06-01days on market $174,999 Active 2 DOM
-
2026-05-30statusdays on market $174,999 Active 1 DOM
-
2026-05-26historical $174,999
-
1988-05-02soldstatus $85,000
ⓘ Source: listings_history table (triggers on properties + properties_extension) + one-shot
backfill from property_details.listing_events for pre-trigger history.
Tax reassessment forecast NY · Partial reset (capped growth)
- Current annual tax
- $5,748 · $479/mo
- Projected year-2 tax
- $5,748 · $479/mo
- Expected delta
- $0/yr ($0/mo · 0.0%)
ⓘ Screening estimate from a state-policy table — verify with the county assessor before closing.
Climate risk First Street
- Flood 5/10 Major FEMA zone X (shaded) · 24% chance over 30 yrs
- Wildfire 3/10 Moderate
- Heat 4/10 Moderate 7 d/yr ≥99°F today · 15 d/yr by 30 yrs out
- Wind 3/10 Moderate 8% chance of damaging wind over 30 yrs
- Air quality 2/10 Low 1 unhealthy d/yr today · 1 by 30 yrs out
Nearby sold comps map
Loading sold comps map…
Walkable amenities ~0.75 mi
Loading nearby amenities…
Taxation est. · year 1
- Rental income
- $26,758
- − Mortgage interest
- −$9,803
- − Property taxes
- −$5,748
- − Insurance
- −$875
- − Repairs & maintenance
- −$2,141
- − Management
- −$2,141
- − Depreciation
- −$5,091
- Taxable income
- $960
- Est. tax owed @ 24.0%
- −$230
- After-tax cash flow
- $3,273/yr
For passive investors: Depreciation is non-cash, so a rental often shows a tax loss while cash-flowing — sheltering income. Rental losses are passive: they offset passive income freely, and up to $25,000/yr can offset ordinary (W-2) income if you actively participate and your MAGI is under $100k (phasing out to $0 by $150k); unused losses carry forward. On sale, claimed depreciation is recaptured at up to 25%, and gains may owe capital-gains tax (a 1031 exchange can defer both). Figures are a year-1 estimate at your 24.0% rate — not tax advice; consult a CPA.
Schools (NCES district)
- District
- Kingston City School District
- NCES district ID
- 3616290
- Math proficiency
- 44% ▲ 1.00%
- Reading proficiency
- 59% ▲ 20.00%
- Median HH income
- $52,586
- Composite
- 44.22/100
- National rank
- #2849
- State rank
- #355 of 590 in NY
Livability — Ruby
No livability data for this city. (Only ~50 U.S. cities are tracked.)
Census & demographics
- County
- Ulster County · 56,183 people
- City population
- 569
- Metro
- Kingston, NY
- Population (ZIP)
- 19,066
- Household income
- $80,861
- Rent vs Own
- Severe rent burden
- 725.0
Population outlook (Ulster County) Hauer SSP2
- Today (2025)
- 175,887 people
- By 2030
- 171,876 · -2.3%
- By 2040
- 161,771 · -8.0%
- By 2050
- 151,470 · -13.9%
- By 2075
- 133,023 · -24.4%
- By 2100
- 113,504 · -35.5%
Race, ethnicity, and origin ACS 2023
- Neighborhood character
- Predominantly White (82%)
- Race & ethnicity
- White 82% Two or more races 12% Hispanic / Latino 6% Black 1%
- Hispanic origin (detail)
- Puerto Rican 2% Cuban 1%
- Common ancestry
- Romanian 5% Iranian 4% Italian 3%
- Foreign-born
- 4% · Canada
- Languages at home
- 92% English-only · Spanish 4% Other Indo-European 1% German/W. Germanic 1%
Political lean MEDSL · Ulster
- 2024 margin
- D (+18.7) · D 59.3% · R 40.7%
- 2008→2024 swing
- -4.9pp toward R · 2008: 23.6pp · 2024: 18.7pp
- All cycles
- 2024: D+18.7 2020: D+20.9 2016: D+9.1 2012: D+21.9 2008: D+23.6
Not yet ingested
- Civics
- —
Market trends
- HPI YoY
- ▼ -72.47%
- Current HPI
- 327.9975
- Rent YoY
- —
- Metro
- Kingston, NY
- State GDP YoY
- ▲ 2.60%
- F500 in state
- 92
Industry mix (Fortune 500 HQ in NY)
| Industry | F500 HQs | Revenue |
|---|---|---|
| Financial Services | 10 | $950B |
|
||
| Consumer Goods | 9 | $162B |
|
||
| Insurance | 4 | $225B |
|
||
| Telecommunications | 2 | $144B |
|
||
| Pharmaceuticals | 2 | $112B |
|
||
| Media / Entertainment | 2 | $69B |
|
||
Price history
+105.9% since first listed2 events — show timeline
- 2026-05-26 Coming Soon $174,999 OneKey® MLS as Distributed by MLS Grid
- 1988-05-02 Sold (Public Records) $85,000 Public Records
Property tax history
+4.1%/yrLatest (2025): $5,748 · -0.4% YoY. Source: county tax records.
Cash-flow waterfall
monthlySold comps — $/sqft
last 12 mo · ≤1 miLoading sold comps…