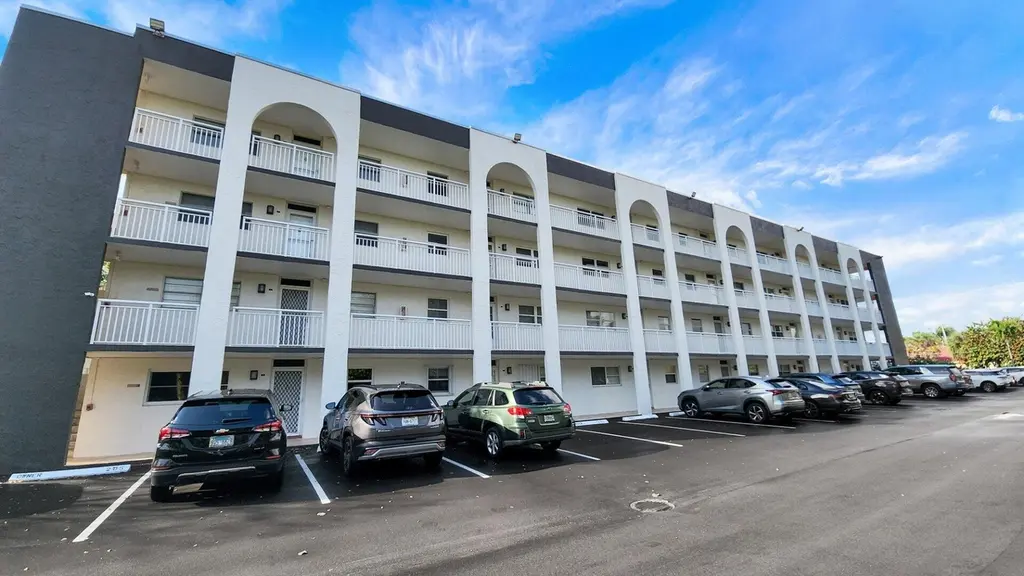
1541 S Ocean Blvd #211 · Lauderdale-by-the-Sea, FL
Flood risk 4/10 · Minor
- FEMA flood zone
- X (unshaded)
- Chance of flooding over 30 yrs
- 0.18%
- Est. flood insurance / yr
- $507 – $1,088
Fire risk 1/10 · Minimal
- Est. fire insurance / yr
- $947 – $1,759
Heat risk 10/10 · Severe
- Hot days now (above 105°F)
- 7 days/yr
- Hot days in 30 yrs
- 26 days/yr
Wind risk 10/10 · Severe
- Chance of severe wind over 30 yrs
- 99.0%
Air-quality risk 2/10 · Minimal
- Unhealthy air days now
- 1 days/yr
- Unhealthy air days in 30 yrs
- 2 days/yr
Risk factors via First Street. Map © Google.
Why this score? — see what drove the D grade
The composite is a weighted blend of 9 inputs, each scored 0–100. Each bar is that input's sub-score; the figure is the points it added to the 100-point composite (weight × sub-score).
- Cash flow +14.2/30.0
- ARV discount +7.5/15.0
- 1% rule +5.0/10.0
- DSCR +4.3/10.0
- Schools +4.1/10.0
- Livability +2.5/5.0
- Condition / age +2.5/5.0
- Rent growth +2.4/5.0
- Appreciation +0.0/10.0
$399,000
🖨 Deal sheet (PDF) 📄 Offer letter ✓ Due diligence
Listing remarks
Just steps from the beach with your own direct access to the sand, this second-floor unit is the perfect place to relax. Kick back on the screened porch overlooking the pool, while impact windows and accordion shutters keep things comfortable and secure. The kitchen and bathrooms have been nicely updated, and custom mirrors and soundproof walls make this your perfect oasis. Other features include a walk-in closet, a Murphy bed in the guest bedroom, plantation shutters, and custom molding throughout. All special assessments have been paid in full. Two parking spaces are included with the unit. The community has been refreshed with a new roof, fresh paint, new blacktop, concrete restoration,
Key facts
- Accordion shutters
- Walk-in closet
- Updated bathrooms
Tags
Property features AI
Finance
- Financial info: Pets allowed (size limit applies)
- HOA & community: Association: Oxygen Association Services; Monthly HOA fee; HOA amenities include beach access, elevator(s), pool, laundry, parking, picnic area, shuffleboard court, on-site manager, trash chute, maintained community, gated entry, management; HOA fee covers insurance, grounds maintenance, common areas, elevator, reserve funds, and pool service
Exterior
- Parking: Assigned parking on concrete; 2 open/assigned parking spaces (total 2)
- Security: Gated community (no guard)
- Utilities: Public water; Public sewer; Electricity available; Water connected
- Home design: Condominium; Single-level unit; Resale unit; Located in Gardens by the Sea South (4-story building)
- Construction: Concrete block with stucco exterior; Tar/gravel roof
- Exterior features: Tar/gravel roof; Concrete construction with stucco; Not waterfront; West-facing
Interior
- Kitchen: Dishwasher; Electric range; Electric cooktop; Microwave; Refrigerator; Freezer; Electric water heater (owned)
- Bedrooms: 2 bedrooms on the main level
- Flooring: Ceramic tile
- Bathrooms: 2 full bathrooms (main level)
- Heating & cooling: Central electric heating; Central air conditioning; Ceiling fans
- Interior features: Walk-in closets; Split bedroom layout; Custom mirrors; Plantation shutters
- Laundry & utility: Building laundry available
Neighborhood map
What this means for you Summary
Snapshot
- This is a 2-bed/2.0-bath condo listed at $399k.
Deal economics
- At list price, monthly cash flow is $68 ($821/yr) — positive.
- The deal already cash-flows at list — no discount required.
- Meets the 1% rule at list price ($4k rent vs $399k).
- Recommended offer: $363k (9.0% below list) — sets the bar for market timing.
- Cap rate 6.5% vs local median 2.0% in Lauderdale-by-the-Sea — top-decile yield for the area; either an underpriced asset or a hidden risk that comps aren't pricing in. Stress-test before assuming the spread holds.
Location & tenants
- Location reads: area grade D — affects rentability + tenant quality, not the cash-flow math above.
- Broward (suburban): math 42% / reading 53% proficiency, ranked #46 of 73 in FL (top 63%) — families likely to look elsewhere, expect single-tenant / working-renter base with shorter leases.
- Zoned schools: Mcnab Elementary School (math 51% / reading 63%, grade C+, #781 of 2,144 statewide, top 38%, 614 students, 56% FRL); Pompano Beach Middle School (math 29% / reading 40%, grade F, #421 of 571 statewide, top 74%, 1,040 students, 73% FRL); Northeast High School (math 12% / reading 37%, grade F, #505 of 667 statewide, top 79%, 1,552 students, 69% FRL).
- Market conditions: Rents soft (-0.4%/yr); 851 active listings in the ZIP; 40 comparable units currently listed for rent nearby; rentals at typical pace (median 24d on market — plan ~3-4 weeks tenant-placement turnaround); solid renter incomes; 2,111 units permitted in Broward County in 2024 (1,265 in 5+ unit buildings).
- At $4,004/mo this rent would consume 57% of the median local household income ($84k/yr) (locally 1298% of renters already pay >50% of income on rent) — very limited rent-growth headroom before tenants either downsize or default.
Forward outlook
- Local home prices are declining (-3.0%/yr); year-one equity from $3k of loan paydown is wiped out by about $12k of value loss. Plan a longer hold.
- Broward County population projected at +34% by 2050 — long-run rental-demand tailwind backs the buy-and-hold thesis.
Negotiation context
- It's been on market 93 days — a 9% lower offer ($363k) is reasonable based on typical stale-listing flexibility.
- 2 sale attempts with the ask held roughly flat each time — persistent listings suggest the price (not the market) is what's stuck; bring a comps-based counter.
- Current owner paid $92k; list at $399k implies a 334% gain — meaningful room to come down on a strong offer.
Risks & watch-outs
- Climate carrying-cost: severe wind risk, 99% chance of damaging wind over 30y; extreme-heat days projected 7→26/yr by 2055 (HVAC capex compounding) — expect insurance premiums to compound above CPI over the hold.
Questions for the listing agent
- It's been on market 93 days. Have you received any prior offers? Is the seller open to a 9% concession, seller financing, or rate buy-down credit?
- Built in 1974 — when were the roof, HVAC, electrical panel, plumbing, and water heater last replaced?
- What does the HOA fee cover, when was the last increase, and are there any pending special assessments or reserve-fund shortfalls?
- Any open or pending special assessments — roof, HVAC, plumbing, elevator, façade? What's the per-unit balance and payoff schedule, and is the seller paying it off at close or rolling it to the buyer?
- Why hasn't it sold? Are there any deal-killer items the seller is aware of (foundation, flood, title, zoning, code violations)?
- Is there a deadline driving the sale (1031 exchange, divorce, estate, relocation)? That informs how much negotiation room exists.
- The area grade is low — what's the realistic commute time and amenity access for the typical tenant pool here? Any planned neighborhood developments (good or bad) we should know about?
- What's the average days-on-market for RENTAL listings here right now (not sales)? A rising rental-DOM trend means longer vacancies and softer asking-rent achievability than the comps imply.
- What's the recent tenant-quality profile in this submarket — average credit score on applications, eviction rate, late-payment / NSF rate, and stable-employment percentage? A property-management company in the area should have these aggregated.
- How much new apartment / multifamily construction is in the pipeline within 1–3 miles? Heavy new supply (>2% of stock underway) typically softens rents 12–24 months out; light construction supports rent growth.
Investment metrics
- 1% rule
- 1.00% ✓
- Cap rate
- 6.50%
- Cash-on-cash
- 0.73%
- DSCR
- 1.03
- GRM
- 8.3
CMA / ARV
No comps found within radius.
Projected returns pro-forma
-3.0% appreciation · 0.0% rent growth · sell at horizon
- IRR
- -18.9%
- Equity multiple
- 0.36×
- Total profit
- $-71,763
- Equity at exit
- $59,492
- IRR
- -20.3%
- Equity multiple
- 0.09×
- Total profit
- $-101,134
- Equity at exit
- $34,498
Cash invested: $111,720 (down + closing). Projections, not guarantees.
Landlord ↔ Tenant lean methodology
- Overall (STATE)
- 87 Strongly Landlord-Friendly
- State Florida
- 87 Strongly Landlord-Friendly · R+3
- County
- — inherits STATE
- City
- — inherits STATE
ZIP-level market 33062
- Rents YoY
- -0.4%
- Active inventory
- 851
- Price-to-rent
- 8.3×
Monthly cashflow live
- Estimated rent
- $4,004 high interval (Pro) →
- Mortgage (P&I)
- −$2,092
- Tax from tax record
- −$151 /mo · $1,809/yr
- Insurance
- −$166
- HOA
- −$685
- Vacancy / Maint / Mgmt
- −$841
- Net cashflow
- $68
Break-even live
Sensitivity live
| Price | -10% $294 | -5% $181 | +0% $68 | +5% $-45 | +10% $-157 |
|---|---|---|---|---|---|
| Rent | -10% $-248 | -5% $-90 | +0% $68 | +5% $227 | +10% $385 |
| Rate | -1.0pp $269 | -0.5pp $170 | base $68 | +0.5pp $-35 | +1.0pp $-140 |
UW: 25.0% down · 7.5% · 30yr · 1.5% tax · 5.0% vac · 8.0% maint · 8.0% mgmt
Financing live
Cash to close
- Down payment
- $99,750
- Closing costs
- $11,970
- Reserves months
- —
- Total cash needed
- —
Loan-product check · same deal, 3 products live
Conventional
25% down · 7.5% · 30yr
- Down + closing
- —
- Monthly P&I
- —
- Monthly cashflow
- —
- DSCR
- —
- Eligible?
- —
Personal DTI + credit; lowest rate.
DSCR
20% down · 8.5% · 30yr
- Down + closing
- —
- Monthly P&I
- —
- Monthly cashflow
- —
- DSCR
- —
- Eligible?
- —
No personal income docs; deal must DSCR.
Hard money
10% down · 12.0% · 12mo
- Down + closing
- —
- Monthly P&I
- —
- Monthly cashflow
- —
- DSCR
- —
- Eligible?
- —
Short-term bridge; refi at stabilization.
Rent comps 40 comps
| Address | Beds | Baths | Sqft | Rent | $/sqft | DOM | Units | Dist |
|---|---|---|---|---|---|---|---|---|
| 1541 S Ocean Blvd Pompano Beach, FL | 1.0 | 1.5 | 850 | $3,575 | $4.21 | 26d | 2 | 0.01mi |
| 1620 S Ocean Blvd Unit 5M Pompano Beach, FL | 1.0 | 2.0 | 1116 | $5,000 | $4.48 | 26d | 1 | 0.07mi |
| 1501 S Ocean Blvd #307 Pompano Beach, FL | 2.0 | 2.0 | 1000 | $3,750 | $3.75 | 26d | 1 | 0.09mi |
| 1750 S Ocean Blvd Unit 509E Pompano Beach, FL | 2.0 | 2.0 | 945 | $4,200 | $4.44 | 26d | 1 | 0.11mi |
| 1530 S Ocean Blvd #203 Pompano Beach, FL | 2.0 | 2.0 | 1250 | $7,000 | $5.60 | 9d | 1 | 0.13mi |
| 1500 S Ocean Blvd #508 Pompano Beach, FL | 2.0 | 2.0 | 1070 | $3,200 | $2.99 | 4d | 1 | 0.15mi |
| 1800 S Ocean Blvd Pompano Beach, FL | 2.0–3.0 | 2.0–2.5 | 1731 | $4,000 | $2.31 | 4d | 5 | 0.17mi |
| 1800 S Ocean Blvd Pompano Beach, FL | 2.0 | 2.0–2.5 | 1731 | $5,300 | $3.06 | 9d | 4 | 0.17mi |
| 1500 S Ocean Blvd Pompano Beach, FL | 2.0 | 1.5–2.0 | 985 | $4,000 | $4.06 | 16d | 2 | 0.18mi |
| 1470 S Ocean Blvd Pompano Beach, FL | 2.0 | 2.0 | 1250 | $4,000 | $3.20 | 26d | 3 | 0.23mi |
| 1461 S Ocean Blvd Pompano Beach, FL | 2.0 | 2.0 | 920 | $3,525 | $3.83 | 7d | 2 | 0.23mi |
| 1900 S Ocean Blvd Unit 1E Pompano Beach, FL | 2.0 | 2.0 | 1210 | $4,500 | $3.72 | 26d | 1 | 0.25mi |
| 1900 S Ocean Blvd Pompano Beach, FL | 2.0 | 2.0 | 1165 | $3,750 | $3.22 | 22d | 3 | 0.26mi |
| 1900 S Ocean Blvd Pompano Beach, FL | 2.0 | 2.0 | 1165 | $3,800 | $3.26 | 9d | 2 | 0.26mi |
| 2000 S Ocean Blvd Pompano Beach, FL | 1.0–2.0 | 1.5–2.0 | 1070 | $6,500 | $6.07 | 18d | 4 | 0.33mi |
| 2000 S Ocean Blvd Pompano Beach, FL | 1.0–2.0 | 1.5–2.0 | 1000 | $6,500 | $6.50 | 4d | 3 | 0.33mi |
| 2000 S Ocean Blvd Pompano Beach, FL | 1.0–2.0 | 1.5–2.0 | 1070 | $6,500 | $6.07 | 22d | 3 | 0.33mi |
| 3333 Port Royale Dr S Fort Lauderdale, FL | 3.0 | 1.0–2.0 | 857 | $3,411 | $3.98 | 0d | 43 | 0.34mi |
| 1421 S Ocean Blvd #503 Pompano Beach, FL | 2.0 | 2.0 | 1100 | $3,750 | $3.41 | 26d | 1 | 0.37mi |
| 6000 N Ocean Blvd Lauderdale by the Sea, FL | 2.0 | 2.0 | 904 | $3,350 | $3.71 | 0d | 2 | 0.42mi |
| 6000 N Ocean Blvd Unit 1D Lauderdale by the Sea, FL | 2.0 | 2.0 | 904 | $3,200 | $3.54 | 23d | 1 | 0.43mi |
| 3200 Port Royale Dr N Fort Lauderdale, FL | 2.0 | 2.0 | 1396 | $3,950 | $2.83 | 26d | 2 | 0.47mi |
| 3200 Port Royale Dr N Fort Lauderdale, FL | 2.0 | 2.0 | 1458 | $3,700 | $2.54 | 6d | 1 | 0.48mi |
| 2548 SE 14th St Pompano Beach, FL | 2.0 | 2.0 | 1400 | $12,000 | $8.57 | 3d | 1 | 0.50mi |
| 2548 SE 14th St Pompano Beach, FL | 2.0 | 2.0 | 1400 | $12,000 | $8.57 | 26d | 1 | 0.50mi |
| 5400 N Ocean Blvd Lauderdale by the Sea, FL | 2.0–3.0 | 2.5 | 1631 | $3,800 | $2.33 | 6d | 2 | 0.56mi |
| 5200 N Ocean Blvd #506 Fort Lauderdale, FL | 2.0 | 2.0 | 1330 | $3,300 | $2.48 | 15d | 1 | 0.62mi |
| 5200 N Ocean Blvd Unit 914A Lauderdale by the Sea, FL | 2.0 | 2.0 | 1450 | $5,000 | $3.45 | 26d | 1 | 0.62mi |
| 5200 N Ocean Blvd Unit 203B Lauderdale by the Sea, FL | 2.0 | 2.0 | 1330 | $3,200 | $2.41 | 26d | 1 | 0.62mi |
| 1370 S Ocean Blvd #1005 Pompano Beach, FL | 1.0 | 1.0 | 1200 | $4,000 | $3.33 | 26d | 1 | 0.63mi |
| 2321 SE 15th St Unit 2321 Pompano Beach, FL | 3.0 | 2.0 | 1313 | $6,100 | $4.65 | 26d | 1 | 0.65mi |
| 1361 S Ocean Blvd #210 Pompano Beach, FL | 2.0 | 2.0 | 1375 | $3,950 | $2.87 | 26d | 1 | 0.65mi |
| 1361 S Ocean Blvd #808 Pompano Beach, FL | 2.0 | 2.0 | 1200 | $4,250 | $3.54 | 26d | 1 | 0.65mi |
| 1361 S Ocean Blvd #303 Pompano Beach, FL | 1.0 | 1.5 | 960 | $3,500 | $3.65 | 0d | 1 | 0.65mi |
| 5100 N Ocean Blvd #502 Lauderdale by the Sea, FL | 1.0 | 1.5 | 1080 | $3,400 | $3.15 | 26d | 1 | 0.69mi |
| 5100 N Ocean Blvd #804 Lauderdale by the Sea, FL | 2.0 | 2.0 | 1400 | $3,800 | $2.71 | 26d | 1 | 0.69mi |
| 5100 N Ocean Blvd #1205 Lauderdale by the Sea, FL | 2.0 | 2.0 | 1400 | $3,900 | $2.79 | 26d | 1 | 0.69mi |
| 5100 N Ocean Blvd #1504 Lauderdale by the Sea, FL | 2.0 | 2.0 | 1400 | $4,000 | $2.86 | 4d | 1 | 0.69mi |
| 1333 S Ocean Blvd Pompano Beach, FL | 1.0–2.0 | 1.0–2.0 | 977 | $3,996 | $4.09 | 0d | 13 | 0.73mi |
| 6299 Bay Club Dr #4 Fort Lauderdale, FL | 2.0 | 2.0 | 1200 | $4,900 | $4.08 | 26d | 1 | 0.76mi |
HOA detail condo
- Monthly dues
- $685 · $8,220/yr
- Likely covers
- pool
- Assessments
- None detected in remarks — confirm with the listing agent.
Listing history 19 events
-
2026-06-21days on market $399,000 Active 93 DOM
-
2026-06-18days on market $399,000 Active 90 DOM
-
2026-06-17days on market $399,000 Active 89 DOM
-
2026-06-16days on market $399,000 Active 88 DOM
-
2026-06-15days on market $399,000 Active 87 DOM
-
2026-06-13days on market $399,000 Active 85 DOM
-
2026-06-09days on market $399,000 Active 81 DOM
-
2026-06-08days on market $399,000 Active 80 DOM
-
2026-06-07days on market $399,000 Active 79 DOM
-
2026-06-04days on market $399,000 Active 76 DOM
-
2026-06-03days on market $399,000 Active 75 DOM
-
2026-06-02days on market $399,000 Active 74 DOM
-
2026-06-01days on market $399,000 Active 73 DOM
-
2026-05-31days on market $399,000 Active 72 DOM
-
2026-04-27status Active
-
2026-04-03historical Active Under Contract
-
2026-03-18$399,000 Active
-
1999-06-05soldstatus $92,000
-
1978-05-01soldstatus $48,000
ⓘ Source: listings_history table (triggers on properties + properties_extension) + one-shot
backfill from property_details.listing_events for pre-trigger history.
Tax reassessment forecast FL · Resets to sale price
- Current annual tax
- $1,809 · $151/mo
- Projected year-2 tax
- $3,312 · $276/mo
- Expected delta
- +$1,503/yr (+$125/mo · 83.1%)
ⓘ Screening estimate from a state-policy table — verify with the county assessor before closing.
Climate risk First Street
- Flood 4/10 Moderate FEMA zone X (unshaded) · 18% chance over 30 yrs
- Wildfire 1/10 Low
- Heat 10/10 Extreme 7 d/yr ≥105°F today · 26 d/yr by 30 yrs out
- Wind 10/10 Extreme 99% chance of damaging wind over 30 yrs
- Air quality 2/10 Low 1 unhealthy d/yr today · 2 by 30 yrs out
Nearby sold comps map
Loading sold comps map…
Walkable amenities ~0.75 mi
Loading nearby amenities…
Taxation est. · year 1
- Rental income
- $48,043
- − Mortgage interest
- −$22,350
- − Property taxes
- −$1,809
- − Insurance
- −$1,995
- − Repairs & maintenance
- −$3,843
- − Management
- −$3,843
- − HOA
- −$8,220
- − Depreciation
- −$11,607
- Taxable loss
- −$5,625
- Est. tax savings @ 24.0%
- +$1,350
- After-tax cash flow
- $2,171/yr
For passive investors: Depreciation is non-cash, so a rental often shows a tax loss while cash-flowing — sheltering income. Rental losses are passive: they offset passive income freely, and up to $25,000/yr can offset ordinary (W-2) income if you actively participate and your MAGI is under $100k (phasing out to $0 by $150k); unused losses carry forward. On sale, claimed depreciation is recaptured at up to 25%, and gains may owe capital-gains tax (a 1031 exchange can defer both). Figures are a year-1 estimate at your 24.0% rate — not tax advice; consult a CPA.
Schools (NCES district)
- District
- Broward
- NCES district ID
- 1200180
- Math proficiency
- 42% ▼ -18.00%
- Reading proficiency
- 53% ▼ -5.00%
- Median HH income
- $52,139
- Composite
- 40.88/100
- National rank
- #3621
- State rank
- #46 of 73 in FL
Livability — Lauderdale-by-the-Sea
No livability data for this city. (Only ~50 U.S. cities are tracked.)
Census & demographics
- Census place
- Lauderdale-by-the-Sea, FL
- County
- Broward County · 1,963,430 people
- Metro
- Miami-Fort Lauderdale-Pompano Beach, FL
- Population (ZIP)
- 24,920
- Household income
- $83,582
- Rent vs Own
- Severe rent burden
- 1298.0
Population outlook (Broward County) Hauer SSP2
- Today (2025)
- 2,207,033 people
- By 2030
- 2,360,704 · +7.0%
- By 2040
- 2,661,208 · +20.6%
- By 2050
- 2,946,698 · +33.5%
- By 2075
- 3,602,273 · +63.2%
- By 2100
- 3,970,984 · +79.9%
Race, ethnicity, and origin ACS 2023
- Neighborhood character
- Predominantly White (76%)
- Race & ethnicity
- White 76% Hispanic / Latino 16% Two or more races 12% Black 3%
- Hispanic origin (detail)
- Puerto Rican 4% Cuban 3%
- Common ancestry
- Romanian 4% Italian 3% Scotch-Irish 2%
- Foreign-born
- 22% · Canada, Jamaica, Dominican Republic
- Languages at home
- 74% English-only · Spanish 14% Other Indo-European 4% Russian/Polish/Slavic 2%
Political lean MEDSL · Broward
- 2024 margin
- D (+17.0) · D 58.0% · R 41.0%
- 2008→2024 swing
- -17.8pp toward R · 2008: 34.7pp · 2024: 17.0pp
- All cycles
- 2024: D+17.0 2020: D+29.8 2016: D+35.0 2012: D+34.9 2008: D+34.7
Not yet ingested
- Civics
- —
Market trends
- HPI YoY
- ▼ -427.01%
- Current HPI
- 342.9461
- Rent YoY
- ▼ -0.36%
- Metro
- Miami-Fort Lauderdale-Pompano Beach, FL
- State GDP YoY
- ▲ 3.28%
- F500 in state
- 36
Industry mix (Fortune 500 HQ in FL)
| Industry | F500 HQs | Revenue |
|---|---|---|
| Industrial Technology | 2 | $29B |
|
||
| Insurance | 2 | $17B |
|
||
| Retail | 1 | $60B |
|
||
| Technology Distribution | 1 | $58B |
|
||
| Homebuilding | 1 | $35B |
|
||
| Technology Manufacturing | 1 | $35B |
|
||
Price history
+731.2% since first listed5 events — show timeline
- 2026-04-27 Relisted — Beaches MLS
- 2026-04-03 Contingent — Beaches MLS
- 2026-03-18 Listed $399,000 Beaches MLS
- 1999-06-05 Sold (Public Records) $92,000 Public Records
- 1978-05-01 Sold (Public Records) $48,000 Public Records
Property tax history
+3.1%/yrLatest (2025): $1,809 · +10.9% YoY. Source: county tax records.
Cash-flow waterfall
monthlySold comps — $/sqft
last 12 mo · ≤1 miLoading sold comps…