1405 Vegas Valley Dr #281 · Winchester, NV
Flood risk 1/10 · Minimal
- FEMA flood zone
- X (unshaded)
- Chance of flooding over 30 yrs
- 0.0%
- Est. flood insurance / yr
- $507 – $1,088
Fire risk 1/10 · Minimal
- Est. fire insurance / yr
- $490 – $910
Heat risk 8/10 · Major
- Hot days now (above 107°F)
- 7 days/yr
- Hot days in 30 yrs
- 17 days/yr
Wind risk 1/10 · Minimal
- Chance of severe wind over 30 yrs
- —
Air-quality risk 3/10 · Minor
- Unhealthy air days now
- 3 days/yr
- Unhealthy air days in 30 yrs
- 4 days/yr
Risk factors via First Street. Map © Google.
Why this score? — see what drove the C- grade
The composite is a weighted blend of 9 inputs, each scored 0–100. Each bar is that input's sub-score; the figure is the points it added to the 100-point composite (weight × sub-score).
- Cash flow +20.0/30.0
- 1% rule +7.8/10.0
- ARV discount +7.5/15.0
- DSCR +6.3/10.0
- Livability +4.0/5.0
- Schools +2.6/10.0
- Condition / age +2.5/5.0
- Rent growth +1.4/5.0
- Appreciation +0.0/10.0
$160,000
🖨 Deal sheet (PDF) 📄 Offer letter ✓ Due diligence
Listing remarks MLS
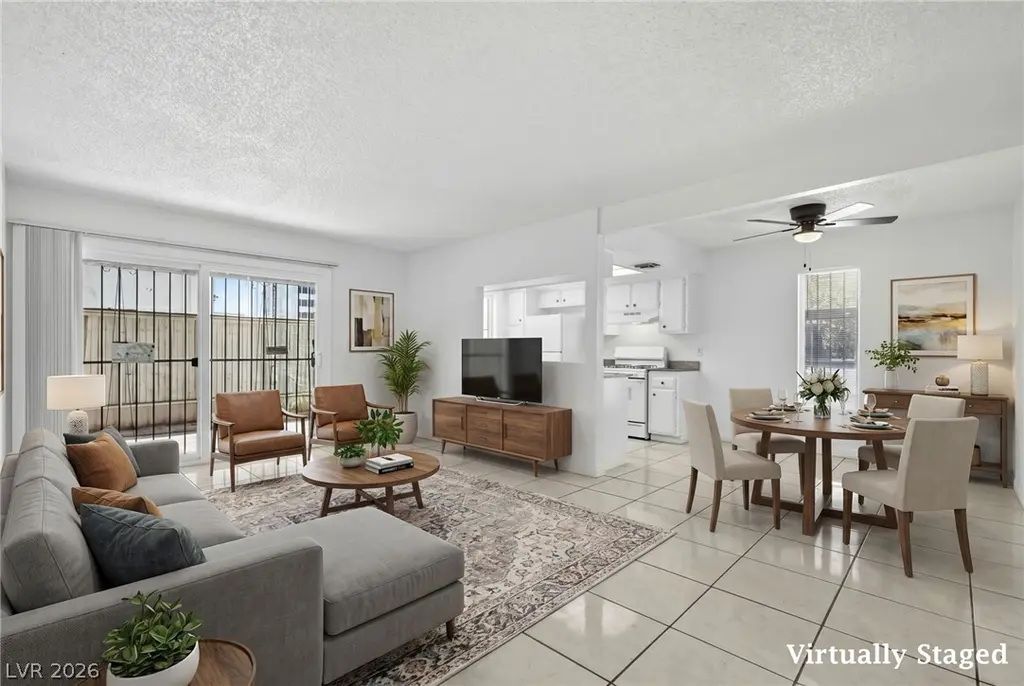
Priced BELOW market value for quick sale! This first floor 3 bedroom 2 bathroom Condominium can be your fist starter home. All 3 bedrooms have great size. Community offers pool and laundry area.
Key facts
- $469 HOA
- Parking
- Community pool
Neighborhood map
What this means for you Summary
Snapshot
- This is a 3-bed/2.0-bath condo listed at $160k.
Deal economics
- At list price, monthly cash flow is $197 ($2k/yr) — positive.
- The deal already cash-flows at list — no discount required.
- Meets the 1% rule at list price ($2k rent vs $160k).
- Recommended offer: $150k (6.0% below list) — sets the bar for market timing.
Location & tenants
- Location reads 79/100 on livability (#3 in NV, #2,272 nationally) — a middle-class / working-renter tenant base. Strengths: commute A+, cost of living A+, housing A+; Watch: crime F, employment D-.
- Clark County School District (urban): math 21% / reading 39% proficiency, ranked #11 of 17 in NV (top 65%) — families likely to look elsewhere, expect single-tenant / working-renter base with shorter leases.
- Zoned schools: Lake Robert E Es (math 14% / reading 27%, grade F, #280 of 402 statewide, top 70%, 642 students, 100% FRL); Martin Roy W Ms (reading 31%, 1,271 students, 100% FRL); Valley Hs (math 8% / reading 24%, grade F, #107 of 131 statewide, top 82%, 2,714 students, 100% FRL) — zoned schools average 100% FRL vs 52% district-wide (48 pts higher); higher-poverty schools than district average — tighter screening recommended.
- Market conditions: Rents falling (-4.4%/yr); 180 active listings in the ZIP; 40 comparable units currently listed for rent nearby; rentals at typical pace (median 26d on market — plan ~3-4 weeks tenant-placement turnaround); 45% of comp listings sitting > 30 days — soft ceiling on asking rent; lower-income renter base — watch delinquency; 14,754 units permitted in Clark County in 2024 (2,301 in 5+ unit buildings).
- At $2,045/mo this rent would consume 60% of the median local household income ($41k/yr) (locally 2744% of renters already pay >50% of income on rent) — very limited rent-growth headroom before tenants either downsize or default.
Forward outlook
- Local home prices are declining (-3.0%/yr); year-one equity from $1k of loan paydown is wiped out by about $5k of value loss. Plan a longer hold.
- Clark County population projected at +36% by 2050 — long-run rental-demand tailwind backs the buy-and-hold thesis.
Negotiation context
- It's been on market 68 days — a 6% lower offer ($150k) is reasonable based on typical stale-listing flexibility.
- 6 sale attempts since 17y ago with the ask held roughly flat each time — persistent listings suggest the price (not the market) is what's stuck; bring a comps-based counter.
- Current owner paid $46k; list at $160k implies a 247% gain — meaningful room to come down on a strong offer.
Risks & watch-outs
- Watch-outs: HOA is 23% of rent.
- Climate carrying-cost: extreme-heat days projected 7→17/yr by 2055 (HVAC capex compounding) — expect insurance premiums to compound above CPI over the hold.
Questions for the listing agent
- It's been on market 68 days. Have you received any prior offers? Is the seller open to a 6% concession, seller financing, or rate buy-down credit?
- Built in 1971 — when were the roof, HVAC, electrical panel, plumbing, and water heater last replaced?
- What does the HOA fee cover, when was the last increase, and are there any pending special assessments or reserve-fund shortfalls?
- Any open or pending special assessments — roof, HVAC, plumbing, elevator, façade? What's the per-unit balance and payoff schedule, and is the seller paying it off at close or rolling it to the buyer?
- Why hasn't it sold? Are there any deal-killer items the seller is aware of (foundation, flood, title, zoning, code violations)?
- Is there a deadline driving the sale (1031 exchange, divorce, estate, relocation)? That informs how much negotiation room exists.
- Crime grade is F in this area — have there been break-ins, vandalism, or insurance claims at this property in the last 3 years? What carrier currently insures it and at what premium?
- What's the average days-on-market for RENTAL listings here right now (not sales)? A rising rental-DOM trend means longer vacancies and softer asking-rent achievability than the comps imply.
- What's the recent tenant-quality profile in this submarket — average credit score on applications, eviction rate, late-payment / NSF rate, and stable-employment percentage? A property-management company in the area should have these aggregated.
- How much new apartment / multifamily construction is in the pipeline within 1–3 miles? Heavy new supply (>2% of stock underway) typically softens rents 12–24 months out; light construction supports rent growth.
Investment metrics
- 1% rule
- 1.28% ✓
- Cap rate
- 7.77%
- Cash-on-cash
- 5.27%
- DSCR
- 1.23
- GRM
- 6.5
CMA / ARV
No comps found within radius.
Projected returns pro-forma
-3.0% appreciation · 0.0% rent growth · sell at horizon
- IRR
- -12.3%
- Equity multiple
- 0.57×
- Total profit
- $-19,174
- Equity at exit
- $23,857
- IRR
- -10.0%
- Equity multiple
- 0.49×
- Total profit
- $-22,823
- Equity at exit
- $13,834
Cash invested: $44,800 (down + closing). Projections, not guarantees.
Landlord ↔ Tenant lean methodology
- Overall (STATE)
- 71 Landlord-Friendly
- State Nevada
- 71 Landlord-Friendly · R+1
- County
- — inherits STATE
- City
- — inherits STATE
ZIP-level market 89169
- Home prices YoY
- -33.4%
- Rents YoY
- -4.4%
- Active inventory
- 180
- Price-to-rent
- 6.5×
Monthly cashflow live
- Estimated rent
- $2,045 high interval (Pro) →
- Mortgage (P&I)
- −$839
- Tax from tax record
- −$44 /mo · $528/yr
- Insurance
- −$67
- HOA
- −$469
- Lot rent
- −$0
- Vacancy / Maint / Mgmt
- −$429
- Net cashflow
- $197
Break-even live
Sensitivity live
| Price | -10% $287 | -5% $242 | +0% $197 | +5% $151 | +10% $106 |
|---|---|---|---|---|---|
| Rent | -10% $35 | -5% $116 | +0% $197 | +5% $277 | +10% $358 |
| Rate | -1.0pp $277 | -0.5pp $237 | base $197 | +0.5pp $155 | +1.0pp $113 |
UW: 25.0% down · 7.5% · 30yr · 1.5% tax · 5.0% vac · 8.0% maint · 8.0% mgmt
Financing live
Cash to close
- Down payment
- $40,000
- Closing costs
- $4,800
- Reserves months
- —
- Total cash needed
- —
Loan-product check · same deal, 3 products live
Conventional
25% down · 7.5% · 30yr
- Down + closing
- —
- Monthly P&I
- —
- Monthly cashflow
- —
- DSCR
- —
- Eligible?
- —
Personal DTI + credit; lowest rate.
DSCR
20% down · 8.5% · 30yr
- Down + closing
- —
- Monthly P&I
- —
- Monthly cashflow
- —
- DSCR
- —
- Eligible?
- —
No personal income docs; deal must DSCR.
Hard money
10% down · 12.0% · 12mo
- Down + closing
- —
- Monthly P&I
- —
- Monthly cashflow
- —
- DSCR
- —
- Eligible?
- —
Short-term bridge; refi at stabilization.
Rent comps 40 comps
| Address | Beds | Baths | Sqft | Rent | $/sqft | DOM | Units | Dist |
|---|---|---|---|---|---|---|---|---|
| 2999 Bel Air Dr Las Vegas, NV | 2.0 | 2.0 | 1326 | $2,700 | $2.04 | 24d | 1 | 0.38mi |
| 1100 Tam O Shanter Las Vegas, NV | 2.0 | 2.0 | 1400 | $2,100 | $1.50 | 46d | 1 | 0.47mi |
| 3145 Bel Air Dr Las Vegas, NV | 2.0 | 2.0 | 1305 | $2,495 | $1.91 | 24d | 1 | 0.49mi |
| 3159 Bel Air Dr Las Vegas, NV | 2.0 | 2.0 | 1305 | $2,750 | $2.11 | 24d | 1 | 0.52mi |
| 900 E Desert Inn Rd Las Vegas, NV | 1.0–2.0 | 1.0–2.0 | 1077 | $1,800 | $1.67 | 46d | 5 | 0.63mi |
| 2080 Karen Ave Unit B63 Las Vegas, NV | 2.0 | 2.0 | 1188 | $1,175 | $0.99 | 26d | 1 | 0.70mi |
| 2080 Karen Ave #3 Las Vegas, NV | 2.0 | 2.0 | 1188 | $1,200 | $1.01 | 24d | 1 | 0.74mi |
| 2080 Karen Ave #46 Las Vegas, NV | 2.0 | 2.0 | 1360 | $2,000 | $1.47 | 46d | 1 | 0.74mi |
| 2158 E Desert Inn Rd Las Vegas, NV | 2.0 | 1.5 | 1210 | $1,100 | $0.91 | 22d | 1 | 0.74mi |
| 2236 E Desert Inn Rd Las Vegas, NV | 2.0 | 1.5 | 1178 | $1,545 | $1.31 | 1d | 1 | 0.81mi |
| 2831 Geary Pl #2909 Las Vegas, NV | 2.0 | 1.0 | 1112 | $1,899 | $1.71 | 46d | 1 | 0.88mi |
| 3152 S Eastern Ave Las Vegas, NV | 2.0 | 1.0 | 987 | $1,450 | $1.47 | 26d | 1 | 0.90mi |
| 596 Tam O Shanter Las Vegas, NV | 2.0 | 2.0 | 1350 | $1,750 | $1.30 | 46d | 1 | 0.93mi |
| 3317 Racquet St Las Vegas, NV | 2.0 | 2.0 | 1476 | $1,595 | $1.08 | 22d | 1 | 1.01mi |
| 1040 Canosa Ave Las Vegas, NV | 2.0 | 1.0 | 969 | $1,745 | $1.80 | 46d | 1 | 1.03mi |
| 3030 Plaza St Las Vegas, NV | 4.0 | 2.0 | 1500 | $2,000 | $1.33 | 46d | 1 | 1.03mi |
| 1601 E Katie Ave Las Vegas, NV | 1.0–2.0 | 1.0–2.0 | 809 | $1,852 | $2.29 | 46d | 13 | 1.06mi |
| 511 E Sahara Ave Las Vegas, NV | 1.0–2.0 | 1.0 | 900 | $1,600 | $1.78 | 46d | 3 | 1.09mi |
| 322 Karen Ave Las Vegas, NV | 1.0–2.0 | 1.5–2.0 | 1109 | $3,500 | $3.15 | 1d | 4 | 1.10mi |
| 322 Karen Ave Las Vegas, NV | 1.0–2.0 | 1.0–2.0 | 1109 | $3,500 | $3.15 | 6d | 3 | 1.10mi |
| 1700 E Viking Rd Las Vegas, NV | 2.0 | 2.0 | 1085 | $1,662 | $1.53 | 46d | 3 | 1.12mi |
| 701 Canosa Ave Las Vegas, NV | 4.0 | 3.0 | 1414 | $3,300 | $2.33 | 17d | 1 | 1.18mi |
| 701 Canosa Ave Las Vegas, NV | 4.0 | 3.0 | 1414 | $3,300 | $2.33 | 10d | 1 | 1.18mi |
| 595 S Royal Crest Cir #18 Las Vegas, NV | 2.0 | 1.0 | 816 | $1,575 | $1.93 | 46d | 1 | 1.18mi |
| 222 Karen Ave #4101 Las Vegas, NV | 2.0 | 2.0 | 1399 | $4,000 | $2.86 | 4d | 1 | 1.18mi |
| 544 Oakbrook Ln Las Vegas, NV | 2.0 | 1.5 | 1146 | $1,950 | $1.70 | 46d | 1 | 1.21mi |
| 2205 Santa Paula Dr Las Vegas, NV | 4.0 | 2.0 | 1455 | $3,495 | $2.40 | 26d | 1 | 1.22mi |
| 2898 Pacific Ave Unit N/A Las Vegas, NV | 3.0 | 2.0 | 1464 | $2,000 | $1.37 | 22d | 1 | 1.26mi |
| 1021 Griffith Ave Las Vegas, NV | 3.0 | 2.0 | 1094 | $2,200 | $2.01 | 46d | 1 | 1.26mi |
| 1916 Howard Ave Las Vegas, NV | 4.0 | 2.0 | 1296 | $3,000 | $2.31 | 26d | 1 | 1.27mi |
| 3550 Paradise Rd Las Vegas, NV | 3.0 | 1.0–2.0 | 947 | $1,750 | $1.85 | 46d | 20 | 1.28mi |
| 525 E Saint Louis Ave Las Vegas, NV | 2.0 | 2.0 | 1094 | $1,525 | $1.39 | 46d | 1 | 1.32mi |
| 3930 University Center Dr Las Vegas, NV | 2.0 | 2.0–3.0 | 1200 | $1,725 | $1.44 | 46d | 2 | 1.33mi |
| 2137 E Saint Louis Ave Las Vegas, NV | 3.0 | 1.0 | 1028 | $1,700 | $1.65 | 46d | 1 | 1.34mi |
| 2938 Karen Ave Unit 1 Las Vegas, NV | 3.0 | 2.0 | 1450 | $1,275 | $0.88 | 10d | 1 | 1.37mi |
| 2938 E Karen Ave Unit 3 Las Vegas, NV | 2.0 | 1.5 | 1200 | $1,325 | $1.10 | 10d | 1 | 1.37mi |
| 1816 Wengert Ave Las Vegas, NV | 2.0 | 2.0 | 1281 | $2,500 | $1.95 | 20d | 1 | 1.43mi |
| 818 E Flamingo Rd Las Vegas, NV | 1.0–2.0 | 1.0–2.5 | 1158 | $2,895 | $2.50 | 1d | 33 | 1.47mi |
| 350 E Desert Inn Rd Unit H203 Las Vegas, NV | 2.0 | 1.5 | 849 | $1,725 | $2.03 | 46d | 1 | 1.47mi |
| 2017 Bracken Ave Las Vegas, NV | 3.0 | 2.0 | 1414 | $1,880 | $1.33 | 13d | 1 | 1.48mi |
HOA detail condo
- Monthly dues
- $469 · $5,628/yr
- Likely covers
- pool
- Assessments
- None detected in remarks — confirm with the listing agent.
Listing history 28 events
-
2026-06-22days on market $160,000 Active 68 DOM
-
2026-06-21days on market $160,000 Active 67 DOM
-
2026-06-18days on market $160,000 Active 64 DOM
-
2026-06-17days on market $160,000 Active 63 DOM
-
2026-06-16days on market $160,000 Active 62 DOM
-
2026-06-15days on market $160,000 Active 61 DOM
-
2026-06-13days on market $160,000 Active 59 DOM
-
2026-06-09days on market $160,000 Active 55 DOM
-
2026-06-08days on market $160,000 Active 54 DOM
-
2026-06-07days on market $160,000 Active 53 DOM
-
2026-06-03days on market $160,000 Active 49 DOM
-
2026-06-02days on market $160,000 Active 48 DOM
-
2026-06-01days on market $160,000 Active 47 DOM
-
2026-05-31days on market $160,000 Active 46 DOM
-
2026-04-15$160,000 Active 194-char remark
Show marketing remark (194 chars)
Priced BELOW market value for quick sale! This first floor 3 bedroom 2 bathroom Condominium can be your fist starter home. All 3 bedrooms have great size. Community offers pool and laundry area.
-
2025-12-24historical $1,350
-
2025-12-17$175,000 Active
-
2025-11-14price $1,350
-
2025-10-22price $1,400
-
2025-10-09$1,500
-
2018-10-09historical
-
2018-08-21$119,900 Active
-
2013-12-31soldstatus $46,100 Sold
-
2013-12-30soldstatus $46,100
-
2013-11-10$45,500 Exclusive Right
-
2010-02-05historical
-
2009-12-08$45,000
-
1991-10-17soldstatus $65,000
ⓘ Source: listings_history table (triggers on properties + properties_extension) + one-shot
backfill from property_details.listing_events for pre-trigger history.
Tax reassessment forecast NV · Resets to sale price
- Current annual tax
- $528 · $44/mo
- Projected year-2 tax
- $944 · $79/mo
- Expected delta
- +$416/yr (+$35/mo · 78.7%)
ⓘ Screening estimate from a state-policy table — verify with the county assessor before closing.
Climate risk First Street
- Flood 1/10 Low FEMA zone X (unshaded) · 0% chance over 30 yrs
- Wildfire 1/10 Low
- Heat 8/10 Severe 7 d/yr ≥107°F today · 17 d/yr by 30 yrs out
- Wind 1/10 Low
- Air quality 3/10 Moderate 3 unhealthy d/yr today · 4 by 30 yrs out
Nearby sold comps map
Loading sold comps map…
Walkable amenities ~0.75 mi
Loading nearby amenities…
Taxation est. · year 1
- Rental income
- $24,537
- − Mortgage interest
- −$8,962
- − Property taxes
- −$528
- − Insurance
- −$800
- − Repairs & maintenance
- −$1,963
- − Management
- −$1,963
- − HOA
- −$5,628
- − Depreciation
- −$4,655
- Taxable income
- $38
- Est. tax owed @ 24.0%
- −$9
- After-tax cash flow
- $2,350/yr
For passive investors: Depreciation is non-cash, so a rental often shows a tax loss while cash-flowing — sheltering income. Rental losses are passive: they offset passive income freely, and up to $25,000/yr can offset ordinary (W-2) income if you actively participate and your MAGI is under $100k (phasing out to $0 by $150k); unused losses carry forward. On sale, claimed depreciation is recaptured at up to 25%, and gains may owe capital-gains tax (a 1031 exchange can defer both). Figures are a year-1 estimate at your 24.0% rate — not tax advice; consult a CPA.
Schools (NCES district)
- District
- Clark County School District
- NCES district ID
- 3200060
- Math proficiency
- 21% ▼ -13.00%
- Reading proficiency
- 39% ▼ -8.00%
- Median HH income
- $53,611
- Composite
- 26.48/100
- National rank
- #7211
- State rank
- #11 of 17 in NV
Livability — Winchester
- Score
- 79/100
- State rank
- #3
- US rank
- #2272
Category grades
Schools grade is shown separately in the Schools card above.
Census & demographics
- Census place
- Winchester, NV
- County
- Clark County · 2,306,105 people
- City population
- 39,883
- Metro
- Las Vegas-Henderson-Paradise, NV
- Population (ZIP)
- 22,171
- Household income
- $40,904
- Rent vs Own
- Severe rent burden
- 2744.0
Population outlook (Clark County) Hauer SSP2
- Today (2025)
- 2,504,101 people
- By 2030
- 2,693,770 · +7.6%
- By 2040
- 3,061,208 · +22.2%
- By 2050
- 3,400,072 · +35.8%
- By 2075
- 4,139,522 · +65.3%
- By 2100
- 4,596,916 · +83.6%
Race, ethnicity, and origin ACS 2023
- Neighborhood character
- Highly diverse neighborhood (Simpson 0.74)
- Race & ethnicity
- Hispanic / Latino 33% White 30% Black 23% Two or more races 13% Asian 9% Native American 2%
- Hispanic origin (detail)
- Mexican 21% Cuban 5%
- Common ancestry
- Iranian 1% Italian 1% Slovak 1%
- Foreign-born
- 30% · Canada, China
- Languages at home
- 59% English-only · Spanish 27% Tagalog/Filipino 4% Other Asian/Pacific 3%
Political lean MEDSL · Clark
- 2024 margin
- Toss-up / Even · D 50.4% · R 47.8% · Other 1.7%
- 2008→2024 swing
- -16.5pp toward R · 2008: 19.1pp · 2024: 2.6pp
- All cycles
- 2024: D+2.6 2020: D+9.3 2016: D+10.7 2012: D+14.5 2008: D+19.1
Not yet ingested
- Civics
- —
Market trends
- HPI YoY
- ▼ -136.91%
- Current HPI
- 272.6449
- Rent YoY
- ▼ -4.43%
- Metro
- Las Vegas-Henderson-Paradise, NV
- State GDP YoY
- ▲ 3.08%
- F500 in state
- 6
Industry mix (Fortune 500 HQ in NV)
| Industry | F500 HQs | Revenue |
|---|---|---|
| Hotels / Casinos | 3 | $36B |
|
||
Price history
+146.2% since first listed14 events — show timeline
- 2026-04-15 Listed $160,000 GLVAR
- 2025-12-24 Rental Removed $1,350 GLVAR
- 2025-12-17 Listed $175,000 GLVAR
- 2025-11-14 Price Changed $1,350 GLVAR
- 2025-10-22 Price Changed $1,400 GLVAR
- 2025-10-09 Listed for Rent $1,500 GLVAR
- 2018-10-09 Listing Removed — GLVAR
- 2018-08-21 Listed $119,900 GLVAR
- 2013-12-31 Sold (MLS) $46,100 GLVAR
- 2013-12-30 Sold (Public Records) $46,100 Public Records
- 2013-11-10 Listed $45,500 GLVAR
- 2010-02-05 Listing Removed — GLVAR
- 2009-12-08 Listed $45,000 GLVAR
- 1991-10-17 Sold (Public Records) $65,000 Public Records
Property tax history
-0.2%/yrLatest (2025): $528 · +7.4% YoY. Source: county tax records.
Cash-flow waterfall
monthlySold comps — $/sqft
last 12 mo · ≤1 miLoading sold comps…