4531 Little Rock Rd · Concord, MO
Flood risk 1/10 · Minimal
- FEMA flood zone
- X (unshaded)
- Chance of flooding over 30 yrs
- 0.0%
- Est. flood insurance / yr
- $507 – $1,088
Fire risk 1/10 · Minimal
- Est. fire insurance / yr
- $1,054 – $1,958
Heat risk 5/10 · Moderate
- Hot days now (above 107°F)
- 7 days/yr
- Hot days in 30 yrs
- 21 days/yr
Wind risk 2/10 · Minimal
- Chance of severe wind over 30 yrs
- 1.0%
Air-quality risk 3/10 · Minor
- Unhealthy air days now
- 2 days/yr
- Unhealthy air days in 30 yrs
- 3 days/yr
Risk factors via First Street. Map © Google.
Why this score? — see what drove the D grade
The composite is a weighted blend of 9 inputs, each scored 0–100. Each bar is that input's sub-score; the figure is the points it added to the 100-point composite (weight × sub-score).
- Cash flow +12.5/30.0
- ARV discount +7.5/15.0
- 1% rule +4.6/10.0
- DSCR +3.7/10.0
- Schools +3.5/10.0
- Livability +3.4/5.0
- Rent growth +3.0/5.0
- Condition / age +2.5/5.0
- Appreciation +0.0/10.0
$154,900
🖨 Deal sheet (PDF) 📄 Offer letter ✓ Due diligence
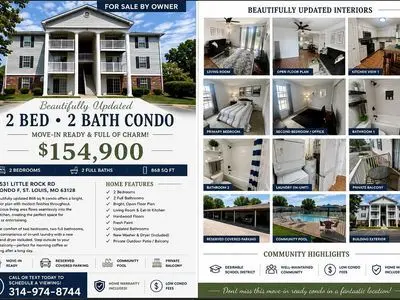
Listing remarks
Beautifully updated 2 bedroom and 2 full bath condo. Open living room and eat-in kitchen. Both bedrooms have enormous closet space. Hardwood floors throughout. Private patio with additional storage space. All appliances stay including newer refrigerator and washer/dryer combo. Community pool and reserved covered parking spot! Offering home warranty as well!
Key facts
- Open living room
- Private patio
- Eat-in kitchen
Tags
Property features AI
Exterior
- Home design: Built in 1987
- Construction: 1987 construction
- Exterior features: Located in the Concord subdivision
Neighborhood map
What this means for you Summary
Snapshot
- This is a 2-bed/1.0-bath condo listed at $155k.
Deal economics
- At list price, monthly cash flow is $-22 ($-263/yr) — negative.
- The deal already cash-flows at list — no discount required.
- To meet the 1% rule (rent ≥ 1% of price), the offer needs to be $149k (3.6% below list).
- Recommended offer: $149k (3.6% below list) — sets the bar for 1% rule.
- Cap rate 6.1% vs local median 3.9% in Concord — top-decile yield for the area; either an underpriced asset or a hidden risk that comps aren't pricing in. Stress-test before assuming the spread holds.
Location & tenants
- Location reads 68/100 on livability (#175 in MO) — a middle-class / working-renter tenant base. Strengths: employment A+, housing A+, cost of living A-; Watch: amenities F, commute F, health & safety F.
- Mehlville R-IX (suburban): math 31% / reading 48% proficiency, ranked #126 of 324 in MO (top 39%) — families likely to look elsewhere, expect single-tenant / working-renter base with shorter leases.
- Zoned schools: Trautwein Elem. (math 17% / reading 37%, grade F, #850 of 1,115 statewide, top 78%, 359 students, 42% FRL); Washington Middle (math 32% / reading 47%, grade F, #189 of 391 statewide, top 51%, 429 students, 40% FRL); Mehlville High School (math 26% / reading 54%, grade F, #243 of 521 statewide, top 47%, 1,440 students, 43% FRL) — zoned schools average 42% FRL vs 22% district-wide (20 pts higher); higher-poverty schools than district average — tighter screening recommended.
- Market conditions: Rents rising (+2.0%/yr); 138 active listings in the ZIP; 16 comparable units currently listed for rent nearby; rentals at typical pace (median 21d on market — plan ~3-4 weeks tenant-placement turnaround); solid renter incomes; 920 units permitted in St. Louis County in 2024 (250 in 5+ unit buildings).
Forward outlook
- Local home prices are declining (-3.0%/yr); year-one equity from $1k of loan paydown is wiped out by about $5k of value loss. Plan a longer hold.
Negotiation context
- Only 7 days on market — expect competitive offers; lowballing is unlikely to land.
- Current owner paid $78k; list at $155k implies a 100% gain — meaningful room to come down on a strong offer.
Risks & watch-outs
- Climate carrying-cost: extreme-heat days projected 7→21/yr by 2055 (HVAC capex compounding) — expect insurance premiums to compound above CPI over the hold.
Questions for the listing agent
- What do current leases actually rent for vs. the listed asking? Can we see a recent rent roll and the last 12 months of T-12 income?
- What does the HOA fee cover, when was the last increase, and are there any pending special assessments or reserve-fund shortfalls?
- Any open or pending special assessments — roof, HVAC, plumbing, elevator, façade? What's the per-unit balance and payoff schedule, and is the seller paying it off at close or rolling it to the buyer?
- Is there a deadline driving the sale (1031 exchange, divorce, estate, relocation)? That informs how much negotiation room exists.
- The area grade is low — what's the realistic commute time and amenity access for the typical tenant pool here? Any planned neighborhood developments (good or bad) we should know about?
- What's the average days-on-market for RENTAL listings here right now (not sales)? A rising rental-DOM trend means longer vacancies and softer asking-rent achievability than the comps imply.
- What's the recent tenant-quality profile in this submarket — average credit score on applications, eviction rate, late-payment / NSF rate, and stable-employment percentage? A property-management company in the area should have these aggregated.
- How much new apartment / multifamily construction is in the pipeline within 1–3 miles? Heavy new supply (>2% of stock underway) typically softens rents 12–24 months out; light construction supports rent growth.
Investment metrics
- 1% rule
- 0.96% ✗
- Cap rate
- 6.12%
- Cash-on-cash
- -0.61%
- DSCR
- 0.97
- GRM
- 8.6
CMA / ARV
No comps found within radius.
Projected returns pro-forma
-3.0% appreciation · 2.05% rent growth · sell at horizon
- IRR
- -18.4%
- Equity multiple
- 0.36×
- Total profit
- $-27,810
- Equity at exit
- $23,096
- IRR
- -12.9%
- Equity multiple
- 0.28×
- Total profit
- $-31,291
- Equity at exit
- $13,393
Cash invested: $43,372 (down + closing). Projections, not guarantees.
Landlord ↔ Tenant lean methodology
- Overall (STATE)
- 81 Strongly Landlord-Friendly
- State Missouri
- 81 Strongly Landlord-Friendly · R+10
- County
- — inherits STATE
- City
- — inherits STATE
ZIP-level market 63128
- Rents YoY
- 2.0%
- Active inventory
- 138
- Price-to-rent
- 8.6×
Monthly cashflow live
- Estimated rent
- $1,494 high interval (Pro) →
- Mortgage (P&I)
- −$812
- Tax from tax record
- −$106 /mo · $1,274/yr
- Insurance
- −$65
- HOA est. from 6 same-building comps
- −$219
- Vacancy / Maint / Mgmt
- −$314
- Net cashflow
- $-22
Break-even live
Sensitivity live
| Price | -10% $66 | -5% $22 | +0% $-22 | +5% $-66 | +10% $-110 |
|---|---|---|---|---|---|
| Rent | -10% $-140 | -5% $-81 | +0% $-22 | +5% $37 | +10% $96 |
| Rate | -1.0pp $56 | -0.5pp $17 | base $-22 | +0.5pp $-62 | +1.0pp $-103 |
UW: 25.0% down · 7.5% · 30yr · 1.5% tax · 5.0% vac · 8.0% maint · 8.0% mgmt
Financing live
Cash to close
- Down payment
- $38,725
- Closing costs
- $4,647
- Reserves months
- —
- Total cash needed
- —
Loan-product check · same deal, 3 products live
Conventional
25% down · 7.5% · 30yr
- Down + closing
- —
- Monthly P&I
- —
- Monthly cashflow
- —
- DSCR
- —
- Eligible?
- —
Personal DTI + credit; lowest rate.
DSCR
20% down · 8.5% · 30yr
- Down + closing
- —
- Monthly P&I
- —
- Monthly cashflow
- —
- DSCR
- —
- Eligible?
- —
No personal income docs; deal must DSCR.
Hard money
10% down · 12.0% · 12mo
- Down + closing
- —
- Monthly P&I
- —
- Monthly cashflow
- —
- DSCR
- —
- Eligible?
- —
Short-term bridge; refi at stabilization.
Rent comps 16 comps
| Address | Beds | Baths | Sqft | Rent | $/sqft | DOM | Units | Dist |
|---|---|---|---|---|---|---|---|---|
| 4333 Arrow Tree Dr Saint Louis, MO | 2.0 | 2.0 | 899 | $1,550 | $1.72 | 45d | 1 | 0.06mi |
| 3779 Swiss Dr St. Louis, MO | 1.0–2.0 | 1.0–1.5 | 806 | $1,719 | $2.13 | 0d | 6 | 0.38mi |
| 6905 Colonial Woods Dr St. Louis, MO | 2.0 | 1.0 | 868 | $1,450 | $1.67 | 45d | 1 | 0.47mi |
| 39 Kassebaum Ln #206 Saint Louis, MO | 2.0 | 2.0 | 1000 | $1,425 | $1.43 | 9d | 1 | 0.66mi |
| 4372 Casa Brazilia Dr St. Louis, MO | 1.0–2.0 | 1.0–2.0 | 845 | $1,400 | $1.66 | 0d | 14 | 0.74mi |
| 4650 E Concord Rd Saint Louis, MO | 2.0 | 1.0 | 962 | $1,895 | $1.97 | 3d | 1 | 0.79mi |
| 4650 E Concord Rd Saint Louis, MO | 2.0 | 1.0 | 962 | $1,850 | $1.92 | 0d | 1 | 0.79mi |
| 4334 Mcadoo Ct St. Louis, MO | 2.0 | 1.0 | 800 | $950 | $1.19 | 21d | 1 | 0.81mi |
| 4320 Mcadoo Ct St. Louis, MO | 2.0 | 1.0 | 800 | $950 | $1.19 | 45d | 1 | 0.82mi |
| 4851 Lemay Ferry Rd Saint Louis, MO | 1.0–2.0 | 1.0–2.0 | 955 | $1,665 | $1.74 | 0d | 8 | 0.92mi |
| 4278 Chateau de Ville Dr Saint Louis, MO | 2.0 | 2.0 | 1025 | $1,350 | $1.32 | 45d | 1 | 0.95mi |
| 1100 Kingbolt Circle Dr Unit 1106B St. Louis, MO | 2.0 | 1.0 | 740 | $1,125 | $1.52 | 25d | 1 | 1.08mi |
| 4227 Drambuie Ln St. Louis, MO | 1.0–3.0 | 1.0–2.0 | 824 | $960 | $1.17 | 45d | 1 | 1.08mi |
| 5010 Clayridge Dr Saint Louis, MO | 1.0–3.0 | 1.0–2.0 | 919 | $975 | $1.06 | 45d | 1 | 1.25mi |
| 5226 Lemay Ferry Rd Saint Louis, MO | 1.0–2.0 | 1.0 | 775 | $1,025 | $1.32 | 4d | 7 | 1.42mi |
| 9435 Green Park Gardens Dr St. Louis, MO | 2.0 | 2.0 | 1000 | $1,300 | $1.30 | 17d | 1 | 1.47mi |
HOA detail condo
- Monthly dues
- $0 · $0/yr
- Likely covers
- pool
- Assessments
- None detected in remarks — confirm with the listing agent.
Listing history 6 events
-
2026-06-21days on market $154,900 Active 7 DOM
-
2026-06-18days on market $154,900 Active 4 DOM
-
2026-06-17days on market $154,900 Active 3 DOM
-
2026-06-16days on market $154,900 Active 2 DOM
-
2026-06-15remarks 361-char remark
-
2026-06-15$154,900 Active 1 DOM
ⓘ Source: listings_history table (triggers on properties + properties_extension) + one-shot
backfill from property_details.listing_events for pre-trigger history.
Tax reassessment forecast MO · Resets to sale price
- Current annual tax
- $1,274 · $106/mo
- Projected year-2 tax
- $1,503 · $125/mo
- Expected delta
- +$228/yr (+$19/mo · 17.9%)
ⓘ Screening estimate from a state-policy table — verify with the county assessor before closing.
Climate risk First Street
- Flood 1/10 Low FEMA zone X (unshaded) · 0% chance over 30 yrs
- Wildfire 1/10 Low
- Heat 5/10 Major 7 d/yr ≥107°F today · 21 d/yr by 30 yrs out
- Wind 2/10 Low 100% chance of damaging wind over 30 yrs
- Air quality 3/10 Moderate 2 unhealthy d/yr today · 3 by 30 yrs out
Nearby sold comps map
Loading sold comps map…
Walkable amenities ~0.75 mi
Loading nearby amenities…
Taxation est. · year 1
- Rental income
- $17,926
- − Mortgage interest
- −$8,677
- − Property taxes
- −$1,274
- − Insurance
- −$774
- − Repairs & maintenance
- −$1,434
- − Management
- −$1,434
- − HOA
- −$2,628
- − Depreciation
- −$4,506
- Taxable loss
- −$2,802
- Est. tax savings @ 24.0%
- +$673
- After-tax cash flow
- $409/yr
For passive investors: Depreciation is non-cash, so a rental often shows a tax loss while cash-flowing — sheltering income. Rental losses are passive: they offset passive income freely, and up to $25,000/yr can offset ordinary (W-2) income if you actively participate and your MAGI is under $100k (phasing out to $0 by $150k); unused losses carry forward. On sale, claimed depreciation is recaptured at up to 25%, and gains may owe capital-gains tax (a 1031 exchange can defer both). Figures are a year-1 estimate at your 24.0% rate — not tax advice; consult a CPA.
Schools (NCES district)
- District
- Mehlville R-IX
- NCES district ID
- 2920670
- Math proficiency
- 31% ▼ -14.00%
- Reading proficiency
- 48% ▼ -5.00%
- Median HH income
- $62,254
- Composite
- 35.19/100
- National rank
- #4995
- State rank
- #126 of 324 in MO
Livability — Concord
- Score
- 68/100
- State rank
- #175
- US rank
- #9260
Category grades
Schools grade is shown separately in the Schools card above.
Census & demographics
- Census place
- Concord, MO
- County
- Saint Louis County · 888,823 people
- City population
- 30,540
- Metro
- St. Louis, MO-IL
- Population (ZIP)
- 30,540
- Household income
- $92,359
- Rent vs Own
- Severe rent burden
- 729.0
Population outlook (St. Louis County) Hauer SSP2
- Today (2025)
- 1,025,227 people
- By 2030
- 1,028,023 · +0.3%
- By 2040
- 1,020,940 · -0.4%
- By 2050
- 1,007,280 · -1.8%
- By 2075
- 987,277 · -3.7%
- By 2100
- 921,984 · -10.1%
Race, ethnicity, and origin ACS 2023
- Neighborhood character
- Predominantly White (92%)
- Race & ethnicity
- White 92% Two or more races 5% Black 1% Hispanic / Latino 1%
- Common ancestry
- Romanian 4% Lithuanian 4% Italian 2%
- Foreign-born
- 4% · Canada
- Languages at home
- 94% English-only · Russian/Polish/Slavic 2% Spanish 1% Other Indo-European 1%
Political lean MEDSL · St. Louis
- 2024 margin
- Strong D (+23.4) · D 60.8% · R 37.4% · Other 1.7%
- 2008→2024 swing
- +3.5pp toward D · 2008: 19.9pp · 2024: 23.4pp
- All cycles
- 2024: D+23.4 2020: D+24.0 2016: D+16.2 2012: D+13.7 2008: D+19.9
Not yet ingested
- Civics
- —
Market trends
- HPI YoY
- ▼ -228.34%
- Current HPI
- 211.4603
- Rent YoY
- ▲ 2.05%
- Metro
- St. Louis, MO-IL
- State GDP YoY
- ▲ 1.84%
- F500 in state
- 20
Industry mix (Fortune 500 HQ in MO)
| Industry | F500 HQs | Revenue |
|---|---|---|
| Healthcare | 1 | $163B |
|
||
| Insurance | 1 | $21B |
|
||
| Industrial Technology | 1 | $17B |
|
||
| Retail | 1 | $16B |
|
||
| Industrial Distribution | 1 | $10B |
|
||
| Utilities | 1 | $9B |
|
||
Price history
+119.7% since first listed4 events — show timeline
- 2026-06-15 Listed $154,900 FSBO.com
- 2023-06-06 Sold (Public Records) — Public Records
- 2001-10-05 Sold (Public Records) $77,500 Public Records
- 2000-09-29 Sold (Public Records) $70,500 Public Records
Property tax history
+2.4%/yrLatest (2022): $1,274 · +3.3% YoY. Source: county tax records.
Cash-flow waterfall
monthlySold comps — $/sqft
last 12 mo · ≤1 miLoading sold comps…