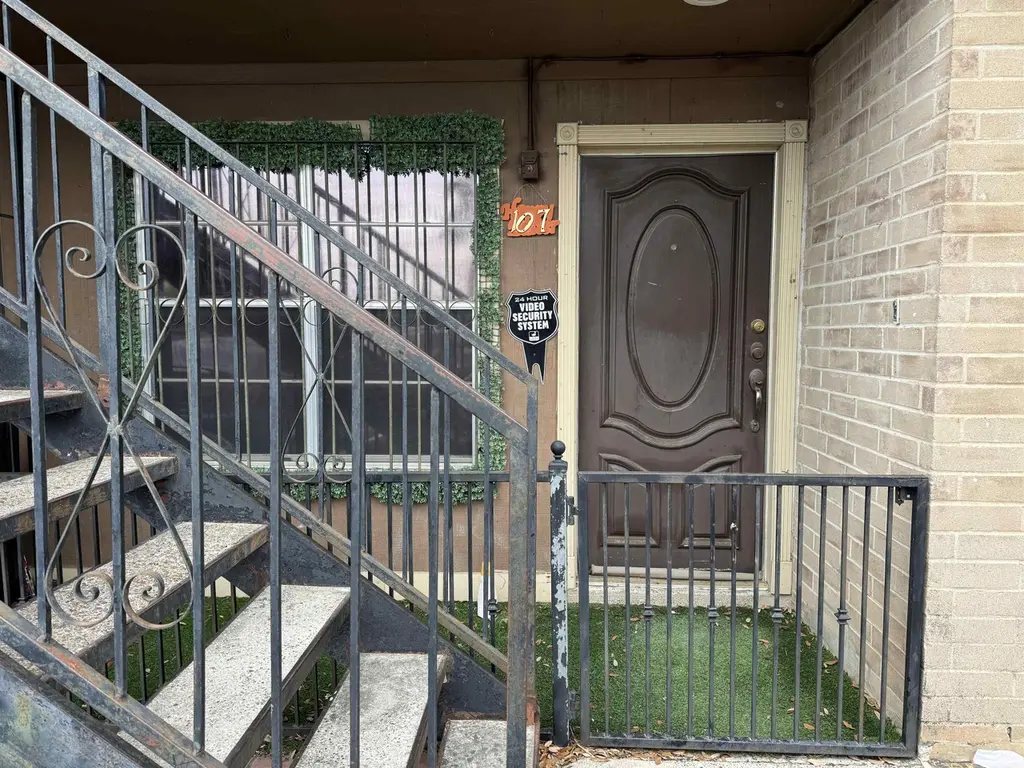
4902 Marcella Ave #107 · Laredo, TX
Flood risk No data
- FEMA flood zone
- —
- Chance of flooding over 30 yrs
- —
- Est. flood insurance / yr
- —
Fire risk No data
- Est. fire insurance / yr
- —
Heat risk No data
- Hot days now (above threshold)
- —
- Hot days in 30 yrs
- —
Wind risk No data
- Chance of severe wind over 30 yrs
- —
Air-quality risk No data
- Unhealthy air days now
- —
- Unhealthy air days in 30 yrs
- —
Risk factors via First Street. Map © Google.
Why this score? — see what drove the C grade
The composite is a weighted blend of 9 inputs, each scored 0–100. Each bar is that input's sub-score; the figure is the points it added to the 100-point composite (weight × sub-score).
- Cash flow +24.1/30.0
- DSCR +7.8/10.0
- ARV discount +7.5/15.0
- 1% rule +6.2/10.0
- Livability +3.7/5.0
- Schools +2.8/10.0
- Rent growth +2.5/5.0
- Condition / age +2.5/5.0
- Appreciation +0.0/10.0
$95,000
🖨 Deal sheet (PDF) 📄 Offer letter ✓ Due diligence
Listing remarks
Investor opportunity!! Well-maintained condo full of charm, warmth, and classic appeal, featuring spacious living areas, solid construction, and thoughtful layout design. Conveniently located near shopping, dining, and parks. This condo combines established neighborhood charm with everyday convenience.
Key facts
- Solid construction
- 1,555 sq ft lot
- Built 1981
Tags
Property features AI
Finance
- Other: Located in Calton Gardens subdivision
Exterior
- Utilities: Public water; Underground utilities
- Home design: Condo/Townhouse (residential); Single-story
- Construction: Brick veneer exterior; Slab foundation
- Exterior features: Front porch; Wood fencing; Level lot
Interior
- Kitchen: Range; Refrigerator
- Flooring: Tile
- Bathrooms: 1 full bathroom
- Heating & cooling: Central heating (electric); Central air; Ceiling fan(s)
- Interior features: Range, Refrigerator, Electric water heater; Tile flooring; Central air and ceiling fans; Central electric heating
- Laundry & utility: Electric water heater
Neighborhood map
What this means for you Summary
Snapshot
- This is a 2-bed/1.0-bath condo listed at $95k.
Deal economics
- At list price, monthly cash flow is $188 ($2k/yr) — positive.
- The deal already cash-flows at list — no discount required.
- Meets the 1% rule at list price ($1k rent vs $95k).
- Recommended offer: $92k (3.0% below list) — sets the bar for market timing.
- Cap rate 8.7% vs local median 4.1% in Laredo — top-decile yield for the area; either an underpriced asset or a hidden risk that comps aren't pricing in. Stress-test before assuming the spread holds.
Location & tenants
- Location reads 73/100 on livability (#227 in TX) — a middle-class / working-renter tenant base. Strengths: cost of living A+, housing A+, health & safety A+; Watch: crime C-, employment D+, amenities F.
- United ISD (urban): math 27% / reading 38% proficiency, ranked #568 of 826 in TX (top 69%) — families likely to look elsewhere, expect single-tenant / working-renter base with shorter leases; 72% free/reduced lunch — lower-income household profile, screen leases tightly.
- Zoned schools: Clark El (math 22% / reading 27%, grade F, #3,052 of 4,322 statewide, top 74%, 404 students, 91% FRL); Clark Middle (math 24% / reading 29%, grade F, #1,200 of 1,662 statewide, top 73%, 568 students, 88% FRL); John B Alexander H S (math 36% / reading 59%, grade D, #583 of 1,632 statewide, top 36%, 3,070 students, 60% FRL).
- Market conditions: 128 active listings in the ZIP; 26 comparable units currently listed for rent nearby; rentals lingering (median 46d on market — plan ~5-8 weeks vacancy on turnover, expect pricing pressure); 100% of comp listings sitting > 30 days — soft ceiling on asking rent; 1,448 units permitted in Webb County in 2024 (245 in 5+ unit buildings).
Forward outlook
- Local home prices are declining (-3.0%/yr); year-one equity from $657 of loan paydown is wiped out by about $3k of value loss. Plan a longer hold.
- Webb County population projected at +23% by 2050 — long-run rental-demand tailwind backs the buy-and-hold thesis.
Negotiation context
- It's been on market 43 days — a 3% lower offer ($92k) is reasonable based on typical stale-listing flexibility.
Questions for the listing agent
- It's been on market 43 days. Have you received any prior offers? Is the seller open to a 3% concession, seller financing, or rate buy-down credit?
- Any open or pending special assessments — roof, HVAC, plumbing, elevator, façade? What's the per-unit balance and payoff schedule, and is the seller paying it off at close or rolling it to the buyer?
- Is there a deadline driving the sale (1031 exchange, divorce, estate, relocation)? That informs how much negotiation room exists.
- What's the average days-on-market for RENTAL listings here right now (not sales)? A rising rental-DOM trend means longer vacancies and softer asking-rent achievability than the comps imply.
- What's the recent tenant-quality profile in this submarket — average credit score on applications, eviction rate, late-payment / NSF rate, and stable-employment percentage? A property-management company in the area should have these aggregated.
- How much new apartment / multifamily construction is in the pipeline within 1–3 miles? Heavy new supply (>2% of stock underway) typically softens rents 12–24 months out; light construction supports rent growth.
Investment metrics
- 1% rule
- 1.12% ✓
- Cap rate
- 8.66%
- Cash-on-cash
- 8.46%
- DSCR
- 1.38
- GRM
- 7.5
CMA / ARV
No comps found within radius.
Projected returns pro-forma
-3.0% appreciation · 3.0% rent growth · sell at horizon
- IRR
- -3.4%
- Equity multiple
- 0.87×
- Total profit
- $-3,436
- Equity at exit
- $14,165
- IRR
- 6.3%
- Equity multiple
- 1.47×
- Total profit
- $12,441
- Equity at exit
- $8,214
Cash invested: $26,600 (down + closing). Projections, not guarantees.
Landlord ↔ Tenant lean methodology
- Overall (STATE)
- 87 Strongly Landlord-Friendly
- State Texas
- 87 Strongly Landlord-Friendly · R+5
- County
- — inherits STATE
- City
- — inherits STATE
ZIP-level market 78041
- Active inventory
- 128
- Price-to-rent
- 7.5×
Monthly cashflow live
- Estimated rent
- $1,062 high interval (Pro) →
- Mortgage (P&I)
- −$498
- Tax from tax record
- −$114 /mo · $1,363/yr
- Insurance
- −$40
- HOA
- −$0
- Lot rent
- −$0
- Vacancy / Maint / Mgmt
- −$223
- Net cashflow
- $188
Break-even live
Sensitivity live
| Price | -10% $241 | -5% $214 | +0% $188 | +5% $161 | +10% $134 |
|---|---|---|---|---|---|
| Rent | -10% $104 | -5% $146 | +0% $188 | +5% $229 | +10% $271 |
| Rate | -1.0pp $235 | -0.5pp $212 | base $188 | +0.5pp $163 | +1.0pp $138 |
UW: 25.0% down · 7.5% · 30yr · 1.5% tax · 5.0% vac · 8.0% maint · 8.0% mgmt
Financing live
Cash to close
- Down payment
- $23,750
- Closing costs
- $2,850
- Reserves months
- —
- Total cash needed
- —
Loan-product check · same deal, 3 products live
Conventional
25% down · 7.5% · 30yr
- Down + closing
- —
- Monthly P&I
- —
- Monthly cashflow
- —
- DSCR
- —
- Eligible?
- —
Personal DTI + credit; lowest rate.
DSCR
20% down · 8.5% · 30yr
- Down + closing
- —
- Monthly P&I
- —
- Monthly cashflow
- —
- DSCR
- —
- Eligible?
- —
No personal income docs; deal must DSCR.
Hard money
10% down · 12.0% · 12mo
- Down + closing
- —
- Monthly P&I
- —
- Monthly cashflow
- —
- DSCR
- —
- Eligible?
- —
Short-term bridge; refi at stabilization.
Rent comps 26 comps
| Address | Beds | Baths | Sqft | Rent | $/sqft | DOM | Units | Dist |
|---|---|---|---|---|---|---|---|---|
| 5402 Marcella Ave Unit 209B Laredo, TX | 2.0 | 1.5 | 754 | $1,150 | $1.53 | 46d | 1 | 0.26mi |
| 5402 Marcella Ave Unit 103A Laredo, TX | 1.0 | 1.0 | 754 | $925 | $1.23 | 46d | 1 | 0.26mi |
| 5402 Marcella Ave Unit 102A Laredo, TX | 2.0 | 1.5 | 783 | $1,200 | $1.53 | 46d | 1 | 0.26mi |
| 5402 Marcella Ave Unit 201A Laredo, TX | 3.0 | 2.0 | 807 | $1,300 | $1.61 | 46d | 1 | 0.27mi |
| 5402 Marcella Ave Unit 302 A Laredo, TX | 2.0 | 1.5 | 754 | $1,040 | $1.38 | 46d | 1 | 0.27mi |
| 5410 Marcella Ave #9 Laredo, TX | 2.0 | 2.0 | 945 | $1,300 | $1.38 | 46d | 1 | 0.30mi |
| 5410 Marcella Ave Unit 13 Laredo, TX | 2.0 | 2.0 | 945 | $1,200 | $1.27 | 46d | 1 | 0.30mi |
| 4505 Springfield Ave Laredo, TX | 1.0–3.0 | 1.0–2.0 | 740 | $875 | $1.18 | 46d | 3 | 0.31mi |
| 419 W Eistetter St Unit 7 Laredo, TX | 2.0 | 1.0 | 756 | $980 | $1.30 | 46d | 1 | 0.55mi |
| 705 Bustamante St Unit 6 Laredo, TX | 2.0 | 1.0 | 585 | $850 | $1.45 | 46d | 1 | 0.57mi |
| 1204 E Hillside Rd Laredo, TX | 1.0–2.0 | 1.0 | 755 | $950 | $1.26 | 46d | 1 | 0.82mi |
| 1315 E Hillside Rd Laredo, TX | 2.0 | 1.5 | 920 | $1,000 | $1.09 | 46d | 1 | 0.88mi |
| 3801 Salinas Ave Unit 12 Laredo, TX | 2.0 | 1.0 | 654 | $925 | $1.41 | 46d | 1 | 0.97mi |
| 1502 E San Pedro St Unit 11 Laredo, TX | 2.0 | 1.0 | 793 | $900 | $1.13 | 46d | 1 | 0.99mi |
| 1502 E San Pedro St Laredo, TX | 2.0 | 1.0 | 793 | $900 | $1.13 | 46d | 1 | 0.99mi |
| 1303 Philadelphia St Unit 3 Laredo, TX | 1.0 | 1.0 | 554 | $850 | $1.53 | 46d | 1 | 1.00mi |
| 5816 Longoria Loop Laredo, TX | 3.0 | 2.0 | 1007 | $1,300 | $1.29 | 46d | 1 | 1.05mi |
| 508 Gale St Laredo, TX | 1.0 | 1.0 | 660 | $760 | $1.15 | 46d | 1 | 1.19mi |
| 508 Gale St Apt 9 Laredo, TX | 2.0 | 1.0 | 850 | $975 | $1.15 | 46d | 1 | 1.19mi |
| 508 Gale St Apt 21 Laredo, TX | 2.0 | 1.0 | 850 | $950 | $1.12 | 46d | 1 | 1.19mi |
| 1502 Quail Ct Laredo, TX | 1.0 | 1.0 | 650 | $1,100 | $1.69 | 46d | 1 | 1.30mi |
| 1502 Calle del Norte Laredo, TX | 1.0 | 1.0 | 660 | $760 | $1.15 | 46d | 1 | 1.32mi |
| 1502 Calle del Norte Unit 47 Up Laredo, TX | 2.0 | 1.0 | 850 | $950 | $1.12 | 46d | 1 | 1.35mi |
| 1616 Calle del Norte Laredo, TX | 1.0–2.0 | 1.0 | 755 | $950 | $1.26 | 46d | 1 | 1.40mi |
| 2605 Springfield Ave Unit 4 Laredo, TX | 2.0 | 1.0 | 728 | $850 | $1.17 | 46d | 1 | 1.45mi |
| 6718 Springfield Ave Laredo, TX | 1.0–3.0 | 1.0–2.5 | 967 | $1,370 | $1.42 | 46d | 13 | 1.48mi |
HOA detail condo
- Monthly dues
- $0 · $0/yr
- Assessments
- None detected in remarks — confirm with the listing agent.
Listing history 20 events
-
2026-06-22days on market $95,000 Active 43 DOM
-
2026-06-21days on market $95,000 Active 42 DOM
-
2026-06-19days on market $95,000 Active 40 DOM
-
2026-06-18days on market $95,000 Active 39 DOM
-
2026-06-17days on market $95,000 Active 38 DOM
-
2026-06-16days on market $95,000 Active 37 DOM
-
2026-06-15days on market $95,000 Active 36 DOM
-
2026-06-14days on market $95,000 Active 34 DOM
-
2026-06-13days on market $95,000 Active 33 DOM
-
2026-06-10days on market $95,000 Active 31 DOM
-
2026-06-09days on market $95,000 Active 30 DOM
-
2026-06-08days on market $95,000 Active 29 DOM
-
2026-06-07days on market $95,000 Active 28 DOM
-
2026-06-03days on market $95,000 Active 24 DOM
-
2026-06-02days on market $95,000 Active 23 DOM
-
2026-06-01days on market $95,000 Active 22 DOM
-
2026-05-31days on market $95,000 Active 21 DOM
-
2026-05-30days on market $95,000 Active 20 DOM
-
2026-05-10$95,000 Active 303-char remark
-
2012-11-05soldstatus
ⓘ Source: listings_history table (triggers on properties + properties_extension) + one-shot
backfill from property_details.listing_events for pre-trigger history.
Tax reassessment forecast TX · Resets to sale price
- Current annual tax
- $1,363 · $114/mo
- Projected year-2 tax
- $1,738 · $145/mo
- Expected delta
- +$375/yr (+$31/mo · 27.5%)
ⓘ Screening estimate from a state-policy table — verify with the county assessor before closing.
Nearby sold comps map
Loading sold comps map…
Walkable amenities ~0.75 mi
Loading nearby amenities…
Taxation est. · year 1
- Rental income
- $12,743
- − Mortgage interest
- −$5,321
- − Property taxes
- −$1,363
- − Insurance
- −$475
- − Repairs & maintenance
- −$1,019
- − Management
- −$1,019
- − Depreciation
- −$2,764
- Taxable income
- $781
- Est. tax owed @ 24.0%
- −$187
- After-tax cash flow
- $2,063/yr
For passive investors: Depreciation is non-cash, so a rental often shows a tax loss while cash-flowing — sheltering income. Rental losses are passive: they offset passive income freely, and up to $25,000/yr can offset ordinary (W-2) income if you actively participate and your MAGI is under $100k (phasing out to $0 by $150k); unused losses carry forward. On sale, claimed depreciation is recaptured at up to 25%, and gains may owe capital-gains tax (a 1031 exchange can defer both). Figures are a year-1 estimate at your 24.0% rate — not tax advice; consult a CPA.
Schools (NCES district)
- District
- United ISD
- NCES district ID
- 4843650
- Math proficiency
- 27% ▼ -36.00%
- Reading proficiency
- 38% ▼ -11.00%
- Median HH income
- $47,780
- Composite
- 28.02/100
- National rank
- #6848
- State rank
- #568 of 826 in TX
Livability — Laredo
- Score
- 73/100
- State rank
- #227
- US rank
- #5399
Category grades
Schools grade is shown separately in the Schools card above.
Census & demographics
- Census place
- Laredo, TX
- City population
- 67,333
- Population (ZIP)
- 47,089
Population outlook (Webb County) Hauer SSP2
- Today (2025)
- 301,387 people
- By 2030
- 316,307 · +5.0%
- By 2040
- 345,636 · +14.7%
- By 2050
- 370,647 · +23.0%
- By 2075
- 413,907 · +37.3%
- By 2100
- 416,458 · +38.2%
Race, ethnicity, and origin ACS 2023
- Neighborhood character
- Predominantly Hispanic (93%)
- Race & ethnicity
- Hispanic / Latino 93% Two or more races 52% White 5% Asian 1%
- Hispanic origin (detail)
- Mexican 87%
- Foreign-born
- 24% · Canada, South Korea
- Languages at home
- 14% English-only · Spanish 85%
Political lean MEDSL · Webb
- 2024 margin
- Toss-up / Even · D 48.5% · R 50.7%
- 2008→2024 swing
- -45.6pp toward R · 2008: 43.4pp · 2024: -2.2pp
- All cycles
- 2024: R+2.2 2020: D+23.3 2016: D+51.6 2012: D+54.0 2008: D+43.4
Not yet ingested
- Civics
- —
Market trends
- HPI YoY
- ▼ -188.15%
- Current HPI
- 162.152
- Rent YoY
- —
- Metro
- —
- State GDP YoY
- ▲ 3.95%
- F500 in state
- 110
Industry mix (Fortune 500 HQ in TX)
| Industry | F500 HQs | Revenue |
|---|---|---|
| Energy | 16 | $1,198B |
|
||
| Technology | 5 | $198B |
|
||
| Engineering / Construction | 4 | $72B |
|
||
| Energy Services | 3 | $60B |
|
||
| Utilities | 3 | $41B |
|
||
| Healthcare | 2 | $330B |
|
||
Price history
2 events — show timeline
- 2026-05-10 Listed $95,000 LAOR
- 2012-11-05 Sold (Public Records) — Public Records
Property tax history
+0.5%/yrLatest (2025): $1,363 · +5.3% YoY. Source: county tax records.
Cash-flow waterfall
monthlySold comps — $/sqft
last 12 mo · ≤1 miLoading sold comps…