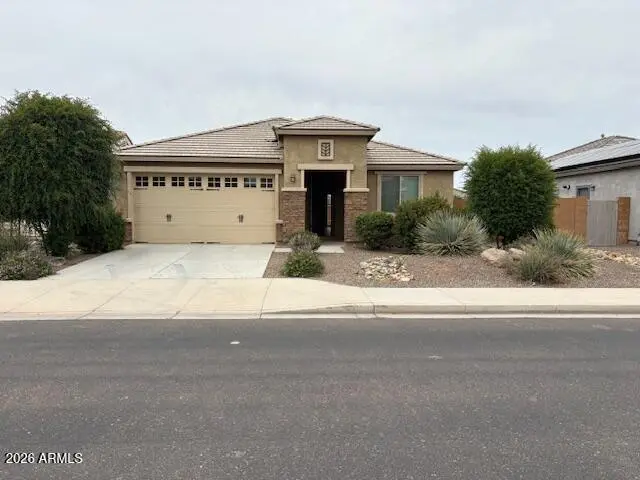
25932 W Quail Ave · Buckeye, AZ
Flood risk 1/10 · Minimal
- FEMA flood zone
- X (shaded)
- Chance of flooding over 30 yrs
- 0.0%
- Est. flood insurance / yr
- $507 – $1,088
Fire risk 5/10 · Moderate
- Est. fire insurance / yr
- $610 – $1,132
Heat risk 9/10 · Severe
- Hot days now (above 111°F)
- 7 days/yr
- Hot days in 30 yrs
- 18 days/yr
Wind risk 1/10 · Minimal
- Chance of severe wind over 30 yrs
- —
Air-quality risk 2/10 · Minimal
- Unhealthy air days now
- 0 days/yr
- Unhealthy air days in 30 yrs
- 1 days/yr
Risk factors via First Street. Map © Google.
Why this score? — see what drove the D- grade
The composite is a weighted blend of 9 inputs, each scored 0–100. Each bar is that input's sub-score; the figure is the points it added to the 100-point composite (weight × sub-score).
- ARV discount +12.7/15.0
- Cash flow +8.7/30.0
- Rent growth +3.4/5.0
- Livability +3.4/5.0
- Schools +2.9/10.0
- Condition / age +2.5/5.0
- DSCR +2.4/10.0
- 1% rule +2.2/10.0
- Appreciation +0.0/10.0
$376,000
🖨 Deal sheet (PDF) 📄 Offer letter ✓ Due diligence
Listing remarks MLS
PRICE REDUCED Step into a beautifully upgraded home centered around a spacious great room and an inviting island kitchen. The kitchen features Harbor Grey maple cabinetry, sleek granite countertops, and stainless steel Whirlpool appliances, including a gas range.. Throughout the home, all major living areas are finished with upgraded light grey ceramic tile flooring. This home is Green Star Certified, helping keep utility costs exceptionally low. Features include advanced cellulose insulation, energy-efficient windows, a tankless water heater, and solar panels. The private rear yard with no 2 story homes near by. Seller has spent thousands on raised garden planters, large paver patio and mature citrus trees. Do the comps, priced to sell!
Key facts
- Island kitchen
- Green star certified
- Granite countertops
Tags
Neighborhood map
What this means for you Summary
Snapshot
- This is a 3-bed/3.0-bath single-family listed at $376k.
Deal economics
- At list price, monthly cash flow is $-316 ($-4k/yr) — negative.
- To cash-flow at today's rent, offer at most $320k (14.9% below list).
- To meet the 1% rule (rent ≥ 1% of price), the offer needs to be $269k (28.4% below list).
- Recommended offer: $269k (28.4% below list) — sets the bar for 1% rule.
- Cap rate 5.3% vs local median 3.1% in Buckeye — top-decile yield for the area; either an underpriced asset or a hidden risk that comps aren't pricing in. Stress-test before assuming the spread holds.
Location & tenants
- Location reads 68/100 on livability (#53 in AZ) — a middle-class / working-renter tenant base. Strengths: employment A+, housing A+, crime A; Watch: amenities F, commute F, health & safety F.
- Wickenburg Unified District (4236) (rural): math 33% / reading 35% proficiency, ranked #92 of 249 in AZ (top 37%) — families likely to look elsewhere, expect single-tenant / working-renter base with shorter leases.
- Zoned schools: Festival Foothills Elementary School (math 47% / reading 47%, grade D-, #308 of 1,109 statewide, top 29%, 314 students, 31% FRL); Vulture Peak Middle School (math 27% / reading 32%, grade F, #84 of 218 statewide, top 41%, 162 students, 51% FRL); Wickenburg High School (math 27% / reading 32%, grade F, #120 of 381 statewide, top 34%, 460 students, 40% FRL).
- Market conditions: Rents rising (+3.4%/yr); 951 active listings in the ZIP; 25 comparable units currently listed for rent nearby; rentals leasing fast (median 5d on market — plan ~1-2 weeks tenant-placement turnaround); high-income renter base; 36,011 units permitted in Maricopa County in 2024 (12,801 in 5+ unit buildings).
Forward outlook
- Local home prices are declining (-3.0%/yr); year-one equity from $3k of loan paydown is wiped out by about $11k of value loss. Plan a longer hold.
- Maricopa County population projected at +38% by 2050 — long-run rental-demand tailwind backs the buy-and-hold thesis.
Negotiation context
- It's been on market 65 days — a 6% lower offer ($353k) is reasonable based on typical stale-listing flexibility.
- 10 sale attempts since 7y ago with the ask held roughly flat each time — persistent listings suggest the price (not the market) is what's stuck; bring a comps-based counter.
- Current owner paid $275k; 37% above their basis — modest negotiation headroom, anchor on the comps not their cost.
Risks & watch-outs
- Climate carrying-cost: moderate wildfire risk; extreme-heat days projected 7→18/yr by 2055 (HVAC capex compounding) — expect insurance premiums to compound above CPI over the hold.
Questions for the listing agent
- What do current leases actually rent for vs. the listed asking? Can we see a recent rent roll and the last 12 months of T-12 income?
- It's been on market 65 days. Have you received any prior offers? Is the seller open to a 28% concession, seller financing, or rate buy-down credit?
- What does the HOA fee cover, when was the last increase, and are there any pending special assessments or reserve-fund shortfalls?
- Why hasn't it sold? Are there any deal-killer items the seller is aware of (foundation, flood, title, zoning, code violations)?
- Is there a deadline driving the sale (1031 exchange, divorce, estate, relocation)? That informs how much negotiation room exists.
- Schools are D-rated, which usually means shorter tenancies and higher turnover. Who's the typical renter profile here, and what's been the actual vacancy rate?
- The area grade is low — what's the realistic commute time and amenity access for the typical tenant pool here? Any planned neighborhood developments (good or bad) we should know about?
- What's the average days-on-market for RENTAL listings here right now (not sales)? A rising rental-DOM trend means longer vacancies and softer asking-rent achievability than the comps imply.
- What's the recent tenant-quality profile in this submarket — average credit score on applications, eviction rate, late-payment / NSF rate, and stable-employment percentage? A property-management company in the area should have these aggregated.
- How much new for-sale + rental construction is in the pipeline within 1–3 miles? Heavy new supply typically softens prices + rents 12–24 months out; constrained supply supports both.
Investment metrics
- 1% rule
- 0.72% ✗
- Cap rate
- 5.28%
- Cash-on-cash
- -3.61%
- DSCR
- 0.84
- GRM
- 11.6
CMA / ARV
- ARV (median comp)
- $425,464
- List price
- $376,000
- Delta
- -11.63%
- Verdict
- UNDERPRICED
- Comps
- 20 within 1.0 mi
Show comp detail 12 sales within ~0.75 mi
| Address | Dist | Beds/Ba | Sqft | Sold | Price | $/sf | Match |
|---|---|---|---|---|---|---|---|
| 25915 W Tina Ln | 0.47mi | 3/2.0 | 1,993 (+0%) | 1mo | $365,000 | $183 | 74 |
| 21139 N 259th Ave | 0.08mi | 3/2.0 | 1,783 (-10%) | 2mo | $372,400 | $209 | 73 |
| 25915 W Deer Valley Rd | 0.30mi | 3/2.0 | 2,137 (+7%) | 3mo | $485,000 | $227 | 68 |
| 22065 N 259th Ave | 0.61mi | 3/2.0 | 1,985 (-0%) | 1mo | $355,000 | $179 | 66 |
| 25965 W Via Del Sol Dr | 0.35mi | 4/2.0 (+1) | 1,879 (-6%) | 2mo | $370,000 | $197 | 64 |
| 21912 N 259th Ln | 0.45mi | 4/2.0 (+1) | 2,129 (+7%) | 1mo | $375,000 | $176 | 58 |
| 20294 N 262nd Dr | 0.70mi | 3/3.0 | 2,092 (+5%) | 3mo | $525,000 | $251 | 56 |
| 26421 W Zachary Dr | 0.60mi | 2/2.5 (-1) | 1,884 (-5%) | 1mo | $472,000 | $251 | 56 |
| 20389 N 259th Ave | 0.52mi | 3/2.0 | 1,766 (-11%) | 0mo | $360,000 | $204 | 53 |
| 25967 W Sands Dr | 0.57mi | 3/2.0 | 2,172 (+9%) | 3mo | $395,000 | $182 | 52 |
| 26058 W Yukon Dr | 0.58mi | 4/2.0 (+1) | 1,776 (-11%) | 3mo | $318,000 | $179 | 44 |
| 26456 W Cat Balue Dr | 0.69mi | 2/2.0 (-1) | 1,829 (-8%) | 2mo | $380,000 | $208 | 43 |
Match score weights: distance 35% · size 25% · config 20% · recency 20%. Top-matched comps best support the ARV.
Projected returns pro-forma
-3.0% appreciation · 3.41% rent growth · sell at horizon
- IRR
- -21.9%
- Equity multiple
- 0.24×
- Total profit
- $-80,015
- Equity at exit
- $56,063
- IRR
- -15.0%
- Equity multiple
- 0.13×
- Total profit
- $-91,224
- Equity at exit
- $32,510
Cash invested: $105,280 (down + closing). Projections, not guarantees.
Landlord ↔ Tenant lean methodology
- Overall (STATE)
- 87 Strongly Landlord-Friendly
- State Arizona
- 87 Strongly Landlord-Friendly · R+3
- County
- — inherits STATE
- City
- — inherits STATE
ZIP-level market 85396
- Home prices YoY
- -18.8%
- Rents YoY
- 3.4%
- Active inventory
- 951
- Price-to-rent
- 11.6×
Monthly cashflow live
- Estimated rent
- $2,693 high interval (Pro) →
- Mortgage (P&I)
- −$1,972
- Tax from tax record
- −$190 /mo · $2,286/yr
- Insurance
- −$157
- HOA
- −$125
- Vacancy / Maint / Mgmt
- −$566
- Net cashflow
- $-316
Break-even live
Sensitivity live
| Price | -10% $-103 | -5% $-210 | +0% $-316 | +5% $-423 | +10% $-529 |
|---|---|---|---|---|---|
| Rent | -10% $-529 | -5% $-423 | +0% $-316 | +5% $-210 | +10% $-104 |
| Rate | -1.0pp $-127 | -0.5pp $-221 | base $-316 | +0.5pp $-414 | +1.0pp $-513 |
UW: 25.0% down · 7.5% · 30yr · 1.5% tax · 5.0% vac · 8.0% maint · 8.0% mgmt
Financing live
Cash to close
- Down payment
- $94,000
- Closing costs
- $11,280
- Reserves months
- —
- Total cash needed
- —
Loan-product check · same deal, 3 products live
Conventional
25% down · 7.5% · 30yr
- Down + closing
- —
- Monthly P&I
- —
- Monthly cashflow
- —
- DSCR
- —
- Eligible?
- —
Personal DTI + credit; lowest rate.
DSCR
20% down · 8.5% · 30yr
- Down + closing
- —
- Monthly P&I
- —
- Monthly cashflow
- —
- DSCR
- —
- Eligible?
- —
No personal income docs; deal must DSCR.
Hard money
10% down · 12.0% · 12mo
- Down + closing
- —
- Monthly P&I
- —
- Monthly cashflow
- —
- DSCR
- —
- Eligible?
- —
Short-term bridge; refi at stabilization.
Rent comps 25 comps
| Address | Beds | Baths | Sqft | Rent | $/sqft | DOM | Units | Dist |
|---|---|---|---|---|---|---|---|---|
| 26028 W Matthew Dr Unit NA Buckeye, AZ | 3.0 | 2.0 | 2000 | $2,750 | $1.38 | 0d | 1 | 0.15mi |
| 26043 W Potter Dr Buckeye, AZ | 3.0 | 2.5 | 2025 | $1,900 | $0.94 | 4d | 1 | 0.33mi |
| 26043 W Potter Dr Buckeye, AZ | 3.0 | 2.5 | 2025 | $1,900 | $0.94 | 0d | 1 | 0.33mi |
| 26237 W Matthew Dr Buckeye, AZ | 2.0 | 2.0 | 1646 | $3,500 | $2.13 | 0d | 1 | 0.39mi |
| 26197 W Vista North Dr Buckeye, AZ | 2.0 | 2.0 | 1375 | $2,850 | $2.07 | 12d | 1 | 0.42mi |
| 26197 W Vista North Dr Buckeye, AZ | 2.0 | 2.0 | 1375 | $2,900 | $2.11 | 0d | 1 | 0.42mi |
| 26195 W Via del Sol Dr Buckeye, AZ | 2.0 | 2.0 | 1493 | $3,300 | $2.21 | 0d | 1 | 0.46mi |
| 26208 W Tina Ln Buckeye, AZ | 2.0 | 2.0 | 1612 | $1,999 | $1.24 | 14d | 1 | 0.54mi |
| 26477 W Ross Ave Buckeye, AZ | 3.0 | 2.0 | 1375 | $1,500 | $1.09 | 45d | 1 | 0.70mi |
| 20493 N 264th Ave Buckeye, AZ | 2.0 | 2.0 | 1961 | $4,200 | $2.14 | 0d | 1 | 0.74mi |
| 20669 N 266th Ave Buckeye, AZ | 3.0 | 2.0 | 1612 | $4,200 | $2.61 | 26d | 1 | 0.84mi |
| 26653 W Firehawk Dr Unit 1302342P Buckeye, AZ | 2.0 | 2.0 | 1883 | $2,459 | $1.31 | 3d | 1 | 0.87mi |
| 26182 W Tonto Ln Buckeye, AZ | 3.0 | 2.0 | 1625 | $1,695 | $1.04 | 4d | 1 | 0.90mi |
| 25925 W Tonto Ln Buckeye, AZ | 4.0 | 2.0 | 2131 | $1,999 | $0.94 | 7d | 1 | 0.94mi |
| 25925 W Tonto Ln Buckeye, AZ | 4.0 | 2.0 | 2131 | $2,200 | $1.03 | 45d | 1 | 0.94mi |
| 26087 W Tonto Ln Buckeye, AZ | 2.0 | 2.0 | 1625 | $2,300 | $1.42 | 45d | 1 | 0.95mi |
| 26766 W Mohawk Ln Buckeye, AZ | 2.0 | 2.0 | 1375 | $2,500 | $1.82 | 0d | 1 | 1.08mi |
| 26824 W Potter Dr Buckeye, AZ | 2.0 | 2.0 | 2092 | $3,500 | $1.67 | 45d | 1 | 1.11mi |
| 26731 W Pontiac Dr Buckeye, AZ | 2.0 | 2.0 | 1373 | $1,475 | $1.07 | 4d | 1 | 1.12mi |
| 20540 N 268th Dr Buckeye, AZ | 3.0 | 2.0 | 1961 | $2,000 | $1.02 | 0d | 1 | 1.20mi |
| 26990 W Burnett Rd Buckeye, AZ | 2.0 | 2.0 | 1961 | $4,000 | $2.04 | 0d | 1 | 1.32mi |
| 27013 W Potter Dr Buckeye, AZ | 2.0 | 2.0 | 1612 | $4,200 | $2.61 | 45d | 1 | 1.33mi |
| 26473 W Sack Dr Buckeye, AZ | 2.0 | 2.5 | 2310 | $2,500 | $1.08 | 0d | 1 | 1.42mi |
| 26781 W Oraibi Dr Buckeye, AZ | 2.0 | 2.0 | 1561 | $2,000 | $1.28 | 20d | 1 | 1.46mi |
| 20002 N 269th Dr Buckeye, AZ | 2.0 | 2.0 | 1961 | $3,500 | $1.78 | 0d | 1 | 1.48mi |
HOA detail
- Monthly dues
- $125 · $1,500/yr
- Likely covers
- watergaspool
Listing history 49 events
-
2026-06-21days on market $376,000 Active 65 DOM
-
2026-06-18days on market $376,000 Active 62 DOM
-
2026-06-17days on market $376,000 Active 61 DOM
-
2026-06-16days on market $376,000 Active 60 DOM
-
2026-06-15days on market $376,000 Active 59 DOM
-
2026-06-13days on market $376,000 Active 57 DOM
-
2026-06-13days on market $376,000 Active 56 DOM
-
2026-06-09days on market $376,000 Active 53 DOM
-
2026-06-08days on market $376,000 Active 52 DOM
-
2026-06-07days on market $376,000 Active 51 DOM
-
2026-06-04days on market $376,000 Active 48 DOM
-
2026-06-03days on market $376,000 Active 47 DOM
-
2026-06-02days on market $376,000 Active 46 DOM
-
2026-06-01days on market $376,000 Active 45 DOM
-
2026-05-31days on market $376,000 Active 44 DOM
-
2026-05-04price $376,000 750-char remark
Show marketing remark (750 chars)
PRICE REDUCED Step into a beautifully upgraded home centered around a spacious great room and an inviting island kitchen. The kitchen features Harbor Grey maple cabinetry, sleek granite countertops, and stainless steel Whirlpool appliances, including a gas range.. Throughout the home, all major living areas are finished with upgraded light grey ceramic tile flooring. This home is Green Star Certified, helping keep utility costs exceptionally low. Features include advanced cellulose insulation, energy-efficient windows, a tankless water heater, and solar panels. The private rear yard with no 2 story homes near by. Seller has spent thousands on raised garden planters, large paver patio and mature citrus trees. Do the comps, priced to sell!
-
2026-04-23historical $1,975
-
2026-04-18price $1,975
-
2026-04-17$379,000 Active 750-char remark
Show marketing remark (750 chars)
PRICE REDUCED Step into a beautifully upgraded home centered around a spacious great room and an inviting island kitchen. The kitchen features Harbor Grey maple cabinetry, sleek granite countertops, and stainless steel Whirlpool appliances, including a gas range.. Throughout the home, all major living areas are finished with upgraded light grey ceramic tile flooring. This home is Green Star Certified, helping keep utility costs exceptionally low. Features include advanced cellulose insulation, energy-efficient windows, a tankless water heater, and solar panels. The private rear yard with no 2 story homes near by. Seller has spent thousands on raised garden planters, large paver patio and mature citrus trees. Do the comps, priced to sell!
-
2026-04-02$2,000
-
2026-01-19historical
-
2025-12-04price $379,000
-
2025-12-01price $385,000
-
2025-11-05$389,000 Active
-
2023-12-26historical
-
2023-10-12$395,000 Active
-
2023-10-11price $395,000
-
2022-12-28historical
-
2022-12-08price $415,000
-
2022-11-29price $425,000
-
2022-11-21price $428,000
-
2022-11-09price $429,000
-
2022-09-12$439,000 Active
-
2022-09-09historical
-
2022-09-02$380,000
-
2020-08-11soldstatus $274,990 Closed
-
2020-05-28status Pending
-
2020-05-08status Active
-
2020-04-22status Pending
-
2020-04-22$279,990 Active
-
2020-04-21soldstatus $274,990 Closed
-
2020-04-15status Pending
-
2020-04-14soldstatus $274,990 Closed
-
2020-02-04status Pending
-
2020-01-31price $279,990
-
2020-01-03price $280,990
-
2019-11-11status Active
-
2019-11-06status Pending
-
2019-10-28$283,041 Active
ⓘ Source: listings_history table (triggers on properties + properties_extension) + one-shot
backfill from property_details.listing_events for pre-trigger history.
Tax reassessment forecast AZ · Resets to sale price
- Current annual tax
- $2,286 · $190/mo
- Projected year-2 tax
- $2,482 · $207/mo
- Expected delta
- +$196/yr (+$16/mo · 8.6%)
ⓘ Screening estimate from a state-policy table — verify with the county assessor before closing.
Climate risk First Street
- Flood 1/10 Low FEMA zone X (shaded) · 0% chance over 30 yrs
- Wildfire 5/10 Major
- Heat 9/10 Extreme 7 d/yr ≥111°F today · 18 d/yr by 30 yrs out
- Wind 1/10 Low
- Air quality 2/10 Low 0 unhealthy d/yr today · 1 by 30 yrs out
Nearby sold comps map
Loading sold comps map…
Walkable amenities ~0.75 mi
Loading nearby amenities…
Taxation est. · year 1
- Rental income
- $32,318
- − Mortgage interest
- −$21,062
- − Property taxes
- −$2,286
- − Insurance
- −$1,880
- − Repairs & maintenance
- −$2,585
- − Management
- −$2,585
- − HOA
- −$1,500
- − Depreciation
- −$10,938
- Taxable loss
- −$10,519
- Est. tax savings @ 24.0%
- +$2,525
- After-tax cash flow
- $-1,272/yr
For passive investors: Depreciation is non-cash, so a rental often shows a tax loss while cash-flowing — sheltering income. Rental losses are passive: they offset passive income freely, and up to $25,000/yr can offset ordinary (W-2) income if you actively participate and your MAGI is under $100k (phasing out to $0 by $150k); unused losses carry forward. On sale, claimed depreciation is recaptured at up to 25%, and gains may owe capital-gains tax (a 1031 exchange can defer both). Figures are a year-1 estimate at your 24.0% rate — not tax advice; consult a CPA.
Schools (NCES district)
- District
- Wickenburg Unified District (4236)
- NCES district ID
- 0409190
- Math proficiency
- 33% ▼ -10.00%
- Reading proficiency
- 35% ▼ -7.00%
- Median HH income
- $47,369
- Composite
- 29.27/100
- National rank
- #6560
- State rank
- #92 of 249 in AZ
Livability — Buckeye
- Score
- 68/100
- State rank
- #53
- US rank
- #9428
Category grades
Schools grade is shown separately in the Schools card above.
Census & demographics
- Census place
- Buckeye, AZ
- County
- Maricopa County · 4,537,380 people
- City population
- 117,540
- Metro
- Phoenix-Mesa-Chandler, AZ
- Population (ZIP)
- 42,181
- Household income
- $114,056
- Rent vs Own
- Severe rent burden
- 156.0
Population outlook (Maricopa County) Hauer SSP2
- Today (2025)
- 4,979,203 people
- By 2030
- 5,378,229 · +8.0%
- By 2040
- 6,156,598 · +23.6%
- By 2050
- 6,872,376 · +38.0%
- By 2075
- 8,401,270 · +68.7%
- By 2100
- 9,247,439 · +85.7%
Race, ethnicity, and origin ACS 2023
- Neighborhood character
- Diverse neighborhood (Simpson 0.56)
- Race & ethnicity
- White 59% Hispanic / Latino 31% Two or more races 18% Black 4% Asian 2% Native American 1%
- Hispanic origin (detail)
- Mexican 25%
- Common ancestry
- Slovak 4% Portuguese 2% Italian 2%
- Foreign-born
- 8% · Canada, Vietnam
- Languages at home
- 85% English-only · Spanish 12% German/W. Germanic 1% Other Indo-European 1%
Political lean MEDSL · Maricopa
- 2024 margin
- Toss-up / Even · D 47.7% · R 51.2% · Other 1.1%
- 2008→2024 swing
- +7.1pp toward D · 2008: -10.6pp · 2024: -3.5pp
- All cycles
- 2024: R+3.5 2020: D+2.2 2016: R+3.5 2012: R+12.0 2008: R+10.6
Not yet ingested
- Civics
- —
Market trends
- HPI YoY
- ▼ -56.97%
- Current HPI
- 246.4705
- Rent YoY
- ▲ 3.41%
- Metro
- Phoenix-Mesa-Chandler, AZ
- State GDP YoY
- ▲ 4.54%
- F500 in state
- 20
Industry mix (Fortune 500 HQ in AZ)
| Industry | F500 HQs | Revenue |
|---|---|---|
| Technology | 2 | $13B |
|
||
| Mining / Metals | 1 | $23B |
|
||
| Environmental Services | 1 | $16B |
|
||
| Metals / Steel | 1 | $14B |
|
||
| Technology Distribution | 1 | $9B |
|
||
| Homebuilding | 1 | $8B |
|
||
Price history
+32.8% since first listed34 events — show timeline
- 2026-05-04 Price Changed $376,000 ARMLS
- 2026-04-23 Rental Removed $1,975 SHOWMOJO
- 2026-04-18 Price Changed $1,975 SHOWMOJO
- 2026-04-17 Listed $379,000 ARMLS
- 2026-04-02 Listed for Rent $2,000 SHOWMOJO
- 2026-01-19 Listing Removed — ARMLS
- 2025-12-04 Price Changed $379,000 ARMLS
- 2025-12-01 Price Changed $385,000 ARMLS
- 2025-11-05 Listed $389,000 ARMLS
- 2023-12-26 Listing Removed — ARMLS
- 2023-10-12 Listed $395,000 ARMLS
- 2023-10-11 Price Changed $395,000 ARMLS
- 2022-12-28 Listing Removed — ARMLS
- 2022-12-08 Price Changed $415,000 ARMLS
- 2022-11-29 Price Changed $425,000 ARMLS
- 2022-11-21 Price Changed $428,000 ARMLS
- 2022-11-09 Price Changed $429,000 ARMLS
- 2022-09-12 Listed $439,000 ARMLS
- 2022-09-09 Listing Removed — ARMLS
- 2022-09-02 Listed $380,000 ARMLS
- 2020-08-11 Sold (MLS) $274,990 ARMLS
- 2020-05-28 Pending — ARMLS
- 2020-05-08 Relisted — ARMLS
- 2020-04-22 Pending — ARMLS
- 2020-04-22 Listed $279,990 ARMLS
- 2020-04-21 Sold (MLS) $274,990 ARMLS
- 2020-04-15 Pending — ARMLS
- 2020-04-14 Sold (MLS) $274,990 ARMLS
- 2020-02-04 Pending — ARMLS
- 2020-01-31 Price Changed $279,990 ARMLS
- 2020-01-03 Price Changed $280,990 ARMLS
- 2019-11-11 Relisted — ARMLS
- 2019-11-06 Pending — ARMLS
- 2019-10-28 Listed $283,041 ARMLS
Property tax history
+77.7%/yrLatest (2025): $2,286 · -0.7% YoY. Source: county tax records.
Cash-flow waterfall
monthlySold comps — $/sqft
last 12 mo · ≤1 miLoading sold comps…