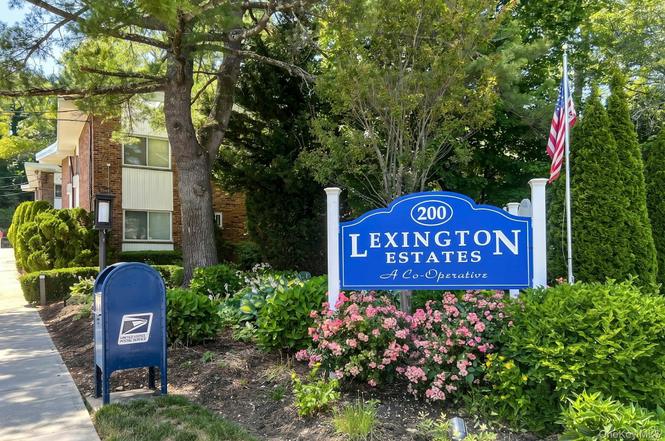
200 Lexington Ave Unit 8B · Oyster Bay, NY
Flood risk 1/10 · Minimal
- FEMA flood zone
- X (unshaded)
- Chance of flooding over 30 yrs
- 0.0%
- Est. flood insurance / yr
- $473 – $860
Fire risk 4/10 · Minor
- Est. fire insurance / yr
- $691 – $1,283
Heat risk 5/10 · Moderate
- Hot days now (above 97°F)
- 7 days/yr
- Hot days in 30 yrs
- 16 days/yr
Wind risk 6/10 · Moderate
- Chance of severe wind over 30 yrs
- 71.0%
Air-quality risk 4/10 · Minor
- Unhealthy air days now
- 4 days/yr
- Unhealthy air days in 30 yrs
- 6 days/yr
Risk factors via First Street. Map © Google.
Why this score? — see what drove the F grade
The composite is a weighted blend of 9 inputs, each scored 0–100. Each bar is that input's sub-score; the figure is the points it added to the 100-point composite (weight × sub-score).
- ARV discount +7.5/15.0
- Schools +6.2/10.0
- Cash flow +4.0/30.0
- Condition / age +4.0/5.0
- 1% rule +3.5/10.0
- Livability +3.5/5.0
- Rent growth +2.5/5.0
- DSCR +0.0/10.0
- Appreciation +0.0/10.0
$375,000
🖨 Deal sheet 📄 Offer letter ✓ Due diligence
Listing remarks
Welcome to Lexington Estates in the heart of Oyster Bay! This bright & spacious corner one bedroom co-op offers an abundance of natural light, a desirable open layout, and the added privacy of a corner location. Featuring hardwood floors, oversized windows, a generously sized living room and dining area, and a well-appointed kitchen, this home provides comfortable everyday living. Nestled within a beautifully maintained garden-style community with landscaped grounds, residents enjoy on-site laundry, storage, & ample parking. Conveniently located just moments from Oyster Bay Village, restaurants, shops, parks, beaches, marinas & the LIRR, offering an ideal blend of North Sho
Key facts
- Landscaped grounds
- Ample parking
- Hardwood floors
Tags
Property features AI
Exterior
- Parking: Two parking spaces; Parking lot with unassigned spaces
- Utilities: Electric service: PSEG; Public sewer; Natural gas connected
- Home design: Stock cooperative; Entry level: 1
- Construction: Brick exterior
- Exterior features: Brick construction; Not waterfront
Interior
- Kitchen: Dishwasher; Range; Refrigerator
- Bedrooms: Entry level: 1
- Flooring: Wood flooring
- Bathrooms: 1 full bathroom
- Heating & cooling: Hot water heating (natural gas); Wall/window air conditioning units
- Interior features: Ceiling fans; Entrance foyer; Galley-style kitchen; Granite counters; Common-area basement and storage space; Common laundry area; Cats allowed
- Laundry & utility: Common area laundry
Neighborhood map
What this means for you Summary
Snapshot
- This is a 1-bed/1.0-bath condo listed at $375k. Condition is rated good.
Deal economics
- At list price, monthly cash flow is $-1k ($-13k/yr) — negative.
- To cash-flow at today's rent, offer at most $364k (2.9% below list).
- To meet the 1% rule (rent ≥ 1% of price), the offer needs to be $318k (15.1% below list).
- Recommended offer: $318k (15.1% below list) — sets the bar for 1% rule.
Location & tenants
- Location reads 70/100 on livability (#436 in NY) — a middle-class / working-renter tenant base. Strengths: crime A+, employment A+, health & safety A; Watch: housing D+, commute F, cost of living F.
- Oyster Bay-East Norwich Central School District (suburban): math 68% / reading 67% proficiency, ranked #120 of 590 in NY (top 20%) — acceptable for families but not a draw, mixed tenant base, ~2y average lease; only 15% free/reduced lunch — higher-income household profile.
- Zoned schools: Theodore Roosevelt School (325 students, 19% FRL); Oyster Bay Middle School (217 students, 19% FRL); Oyster Bay High School (math 63% / reading 68%, grade B, #773 of 1,100 statewide, top 70%, 415 students, 23% FRL).
- Market conditions: 71 active listings in the ZIP; 7 comparable units currently listed for rent nearby; rentals at typical pace (median 22d on market — plan ~3-4 weeks tenant-placement turnaround); 824 units permitted in Nassau County in 2024 (153 in 5+ unit buildings).
Forward outlook
- Local home prices are declining (-3.0%/yr); year-one equity from $3k of loan paydown is wiped out by about $11k of value loss. Plan a longer hold.
- Nassau County population projected at +7% by 2050 — modest demand growth; plan on rents tracking national, not racing it.
Negotiation context
- Only 2 days on market — expect competitive offers; lowballing is unlikely to land.
Risks & watch-outs
- Watch-outs: HOA is 30% of rent.
- Climate carrying-cost: major wind risk, 71% chance of damaging wind over 30y; extreme-heat days projected 7→16/yr by 2055 (HVAC capex compounding) — expect insurance premiums to compound above CPI over the hold.
Questions for the listing agent
- What do current leases actually rent for vs. the listed asking? Can we see a recent rent roll and the last 12 months of T-12 income?
- Built in 1960 — when were the roof, HVAC, electrical panel, plumbing, and water heater last replaced?
- What does the HOA fee cover, when was the last increase, and are there any pending special assessments or reserve-fund shortfalls?
- Any open or pending special assessments — roof, HVAC, plumbing, elevator, façade? What's the per-unit balance and payoff schedule, and is the seller paying it off at close or rolling it to the buyer?
- Is there a deadline driving the sale (1031 exchange, divorce, estate, relocation)? That informs how much negotiation room exists.
- Schools are A-rated — typically a magnet for longer-tenancy family renters. What's the average tenant stay here, and is there a school-zone premium baked into asking?
- The area grade is low — what's the realistic commute time and amenity access for the typical tenant pool here? Any planned neighborhood developments (good or bad) we should know about?
- What's the average days-on-market for RENTAL listings here right now (not sales)? A rising rental-DOM trend means longer vacancies and softer asking-rent achievability than the comps imply.
- What's the recent tenant-quality profile in this submarket — average credit score on applications, eviction rate, late-payment / NSF rate, and stable-employment percentage? A property-management company in the area should have these aggregated.
- How much new apartment / multifamily construction is in the pipeline within 1–3 miles? Heavy new supply (>2% of stock underway) typically softens rents 12–24 months out; light construction supports rent growth.
Investment metrics
- 1% rule
- 0.85% ✗
- Cap rate
- 2.96%
- Cash-on-cash
- -11.91%
- DSCR
- 0.47
- GRM
- 9.8
CMA / ARV
No comps found within radius.
Projected returns pro-forma
-3.0% appreciation · 3.0% rent growth · sell at horizon
- IRR
- -37.9%
- Equity multiple
- -0.20×
- Total profit
- $-126,500
- Equity at exit
- $55,914
- IRR
- -54.0%
- Equity multiple
- -0.84×
- Total profit
- $-193,016
- Equity at exit
- $32,423
Cash invested: $105,000 (down + closing). Projections, not guarantees.
Landlord ↔ Tenant lean methodology
- Overall (STATE)
- 15 Strongly Tenant-Friendly
- State New York
- 15 Strongly Tenant-Friendly · D+10
- County
- — inherits STATE
- City
- — inherits STATE
ZIP-level market 11771
- Home prices YoY
- -28.8%
- Active inventory
- 71
- Price-to-rent
- 9.8×
Monthly cashflow live
- Estimated rent
- $3,184 high interval (Pro) →
- Mortgage (P&I)
- −$1,967
- Tax est. 1.5%
- −$469 /mo · $5,625/yr
- Insurance
- −$156
- HOA est. from 1 same-building comp
- −$966
- Vacancy / Maint / Mgmt
- −$669
- Net cashflow
- $-1,042
Break-even live
UW: 25.0% down · 7.5% · 30yr · 1.5% tax · 5.0% vac · 8.0% maint · 8.0% mgmt
Financing live
Cash to close
- Down payment
- $93,750
- Closing costs
- $11,250
- Reserves months
- —
- Total cash needed
- —
Loan-product check · same deal, 3 products live
Conventional
25% down · 7.5% · 30yr
- Down + closing
- —
- Monthly P&I
- —
- Monthly cashflow
- —
- DSCR
- —
- Eligible?
- —
Personal DTI + credit; lowest rate.
DSCR
20% down · 8.5% · 30yr
- Down + closing
- —
- Monthly P&I
- —
- Monthly cashflow
- —
- DSCR
- —
- Eligible?
- —
No personal income docs; deal must DSCR.
Hard money
10% down · 12.0% · 12mo
- Down + closing
- —
- Monthly P&I
- —
- Monthly cashflow
- —
- DSCR
- —
- Eligible?
- —
Short-term bridge; refi at stabilization.
Rent comps 7 comps
| Address | Beds | Baths | Sqft | Rent | $/sqft | DOM | Units | Dist |
|---|---|---|---|---|---|---|---|---|
| 108 South St Oyster Bay, NY | 2.0 | 1.0 | 855 | $4,150 | $4.85 | 1d | 1 | 0.44mi |
| 108 South St Unit D Oyster Bay, NY | 1.0 | 1.0 | 663 | $3,150 | $4.75 | 21d | 1 | 0.44mi |
| 21 Audrey Ave Unit D Oyster Bay, NY | 1.0 | 1.0 | 600 | $2,400 | $4.00 | 21d | 1 | 0.47mi |
| 75 South St Oyster Bay, NY | 2.0 | 1.0 | 800 | $2,975 | $3.72 | 24d | 1 | 0.50mi |
| 75 Maxwell Ave Apt B Oyster Bay, NY | 2.0 | 1.0 | 836 | $3,000 | $3.59 | 43d | 1 | 0.51mi |
| 46 Maxwell Ave Oyster Bay, NY | 2.0 | 1.5 | 850 | $3,300 | $3.88 | 43d | 1 | 0.57mi |
| 600 Pine Hollow Rd East Norwich, NY | 1.0–2.0 | 1.0–2.0 | 1000 | $3,204 | $3.20 | 1d | 27 | 0.73mi |
HOA detail condo
- Monthly dues
- $0 · $0/yr
- Likely covers
- landscaping
- Assessments
- None detected in remarks — confirm with the listing agent.
Listing history 3 events
-
2026-06-18days on market $375,000 Active 2 DOM
-
2026-06-17remarks 687-char remark
-
2026-06-17$375,000 Active 1 DOM
ⓘ Source: listings_history table (triggers on properties + properties_extension) + one-shot
backfill from property_details.listing_events for pre-trigger history.
Climate risk First Street
- Flood 1/10 Low FEMA zone X (unshaded) · 0% chance over 30 yrs
- Wildfire 4/10 Moderate
- Heat 5/10 Major 7 d/yr ≥97°F today · 16 d/yr by 30 yrs out
- Wind 6/10 Major 71% chance of damaging wind over 30 yrs
- Air quality 4/10 Moderate 4 unhealthy d/yr today · 6 by 30 yrs out
Nearby sold comps map
Loading sold comps map…
Walkable amenities ~0.75 mi
Loading nearby amenities…
Taxation est. · year 1
- Rental income
- $38,208
- − Mortgage interest
- −$21,006
- − Property taxes
- −$5,625
- − Insurance
- −$1,875
- − Repairs & maintenance
- −$3,057
- − Management
- −$3,057
- − HOA
- −$11,592
- − Depreciation
- −$10,909
- Taxable loss
- −$18,912
- Est. tax savings @ 24.0%
- +$4,539
- After-tax cash flow
- $-7,967/yr
For passive investors: Depreciation is non-cash, so a rental often shows a tax loss while cash-flowing — sheltering income. Rental losses are passive: they offset passive income freely, and up to $25,000/yr can offset ordinary (W-2) income if you actively participate and your MAGI is under $100k (phasing out to $0 by $150k); unused losses carry forward. On sale, claimed depreciation is recaptured at up to 25%, and gains may owe capital-gains tax (a 1031 exchange can defer both). Figures are a year-1 estimate at your 24.0% rate — not tax advice; consult a CPA.
Condition & rehab AI · 12 photos
This well-maintained one-bedroom co-op in Lexington Estates offers a bright and spacious living environment with modern amenities and a desirable corner location. The property is in good condition with minimal maintenance required.
Value-add opportunities
- Resale Paint exterior trim — Fresh paint can enhance curb appeal and property value.
- Rental Clean gutters — Clean gutters improve drainage and prevent water damage, which is important for rental properties.
Renovation cost estimate screening
Value-add ROI direction
- Resale Paint exterior trim — Fresh paint can enhance curb appeal and property value. ↑
- Rental Clean gutters — Clean gutters improve drainage and prevent water damage, which is important for rental properties. ↑
ⓘ Cost ranges are severity-bucket heuristics (US national rule-of-thumb). Get contractor quotes + a written scope before underwriting a rehab budget.
Schools (NCES district)
- District
- Oyster Bay-East Norwich Central School District
- NCES district ID
- 3622290
- Math proficiency
- 68% ▼ -2.00%
- Reading proficiency
- 67% ▼ -4.00%
- Median HH income
- $100,262
- Composite
- 62.11/100
- National rank
- #710
- State rank
- #120 of 590 in NY
Livability — Oyster Bay
- Score
- 70/100
- State rank
- #436
- US rank
- #7650
Category grades
Schools grade is shown separately in the Schools card above.
Census & demographics
- Census place
- Oyster Bay, NY
- City population
- 10,173
- Population (ZIP)
- 10,173
Population outlook (Nassau County) Hauer SSP2
- Today (2025)
- 1,409,302 people
- By 2030
- 1,431,482 · +1.6%
- By 2040
- 1,471,607 · +4.4%
- By 2050
- 1,502,845 · +6.6%
- By 2075
- 1,575,403 · +11.8%
- By 2100
- 1,554,356 · +10.3%
Race, ethnicity, and origin ACS 2023
- Neighborhood character
- Predominantly White (66%)
- Race & ethnicity
- White 66% Hispanic / Latino 21% Two or more races 9% Asian 5% Black 2%
- Hispanic origin (detail)
- Mexican 3%
- Common ancestry
- Romanian 3% Scotch-Irish 3% Italian 2%
- Foreign-born
- 14% · Canada, China
- Languages at home
- 77% English-only · Spanish 13% Other Indo-European 5% German/W. Germanic 1%
Political lean MEDSL · Nassau
- 2024 margin
- Toss-up / Even · D 47.9% · R 52.1%
- 2008→2024 swing
- -12.6pp toward R · 2008: 8.4pp · 2024: -4.2pp
- All cycles
- 2024: R+4.2 2020: D+9.5 2016: D+5.3 2012: D+6.7 2008: D+8.4
Not yet ingested
- Civics
- —
Market trends
- HPI YoY
- ▼ -103.23%
- Current HPI
- 255.4961
- Rent YoY
- —
- Metro
- —
- State GDP YoY
- ▲ 2.60%
- F500 in state
- 92
Industry mix (Fortune 500 HQ in NY)
| Industry | F500 HQs | Revenue |
|---|---|---|
| Financial Services | 10 | $950B |
|
||
| Consumer Goods | 9 | $162B |
|
||
| Insurance | 4 | $225B |
|
||
| Telecommunications | 2 | $144B |
|
||
| Pharmaceuticals | 2 | $112B |
|
||
| Media / Entertainment | 2 | $69B |
|
||
Price history
1 event — show timeline
- 2026-06-16 Listed $375,000 OneKey® MLS as Distributed by MLS Grid
Cash-flow waterfall
monthlySold comps — $/sqft
last 12 mo · ≤1 miLoading sold comps…