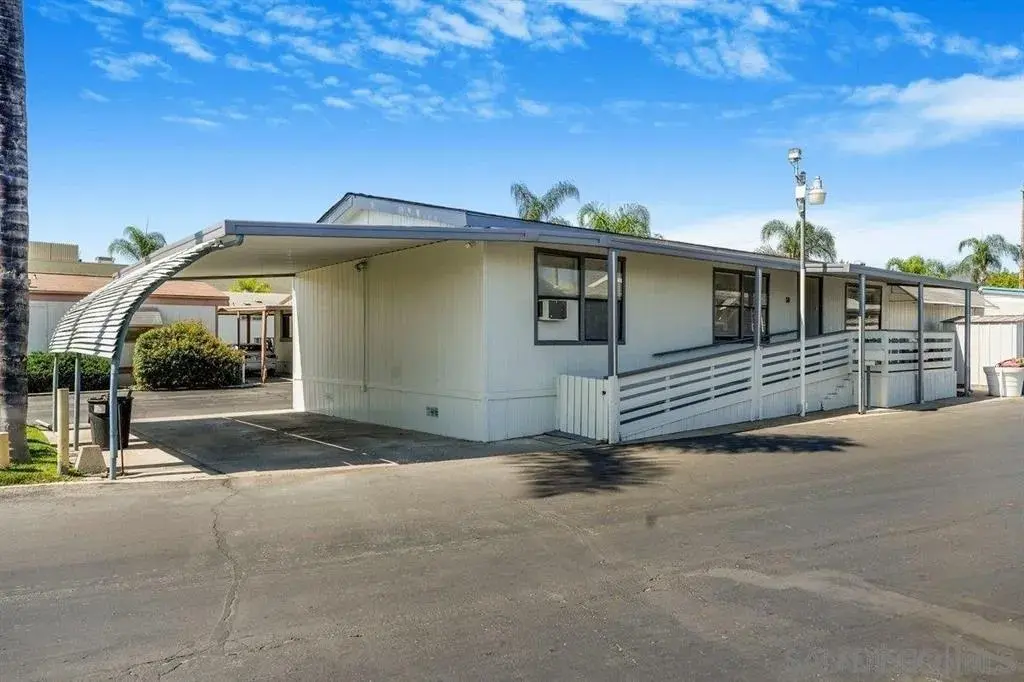
211 N Citrus Ave #50 · Escondido, CA
Flood risk 3/10 · Minor
- FEMA flood zone
- X (shaded)
- Chance of flooding over 30 yrs
- 0.2%
- Est. flood insurance / yr
- $507 – $1,088
Fire risk 7/10 · Major
- Est. fire insurance / yr
- $659 – $1,223
Heat risk 6/10 · Moderate
- Hot days now (above 99°F)
- 7 days/yr
- Hot days in 30 yrs
- 21 days/yr
Wind risk 1/10 · Minimal
- Chance of severe wind over 30 yrs
- —
Air-quality risk 4/10 · Minor
- Unhealthy air days now
- 6 days/yr
- Unhealthy air days in 30 yrs
- 7 days/yr
Risk factors via First Street. Map © Google.
Why this score? — see what drove the B+ grade
The composite is a weighted blend of 9 inputs, each scored 0–100. Each bar is that input's sub-score; the figure is the points it added to the 100-point composite (weight × sub-score).
- Cash flow +30.0/30.0
- ARV discount +15.0/15.0
- 1% rule +10.0/10.0
- DSCR +10.0/10.0
- Livability +3.5/5.0
- Schools +3.3/10.0
- Rent growth +3.1/5.0
- Condition / age +2.5/5.0
- Appreciation +0.0/10.0
$210,000
🖨 Deal sheet 📄 Offer letter ✓ Due diligence
Listing remarks
Don't miss this 55 and up move-in ready home with brand new roof, brand new HVAC system, brand new front entrance ramp, convenient in-house laundry unit, newly upgraded floors, new kitchen counters and backsplash. Open, light and bright! New paint and new window blinds. House is very conveniently located near the park entrance, heated pool and large club house with fitness equipment. Park management approval required.
Key facts
- Upgraded floors
- Front entrance ramp
- Kitchen counters
Tags
Property features AI
Finance
- HOA & community: Located in a senior community (Carefree Ranch); Common-interest lot
Exterior
- Parking: Assigned parking (2 spaces)
- Utilities: Public water; Sewer connected
- Home design: Manufactured home; Single-story
- Construction: Stucco construction; Shingle roof
- Exterior features: Community pool
Interior
- Kitchen: Built-in range; Gas oven; Gas range; Cooktop; Gas cooktop; Dishwasher; Disposal; Refrigerator
- Bedrooms: Up to 3 bedrooms
- Bathrooms: 2 full bathrooms
- Heating & cooling: Central air conditioning; Forced air heating; Natural gas heating
- Interior features: Dishwasher; Disposal; Refrigerator; Built-in range; Gas oven; Gas range; Cooktop; Gas cooktop
- Laundry & utility: Washer; Dryer
Neighborhood map
What this means for you Summary
Snapshot
- This is a 3-bed/2.0-bath manufactured listed at $210k.
Deal economics
- At list price, monthly cash flow is $2k ($18k/yr) — positive.
- The deal already cash-flows at list — no discount required.
- Meets the 1% rule at list price ($3k rent vs $210k).
- Cap rate 15.0% vs local median 2.5% in Escondido — top-decile yield for the area; either an underpriced asset or a hidden risk that comps aren't pricing in. Stress-test before assuming the spread holds.
Location & tenants
- Location reads 70/100 on livability (#238 in CA) — a middle-class / working-renter tenant base. Strengths: amenities A+, commute A+, employment B; Watch: health & safety C-, schools D+, crime D+.
- Escondido Union High (suburban): math 19% / reading 56% proficiency, ranked #247 of 517 in CA (top 48%) — families likely to look elsewhere, expect single-tenant / working-renter base with shorter leases.
- Market conditions: Rents rising (+2.5%/yr); 136 active listings in the ZIP; 10 comparable units currently listed for rent nearby; rentals leasing fast (median 2d on market — plan ~1-2 weeks tenant-placement turnaround); solid renter incomes; 11,759 units permitted in San Diego County in 2024 (7,244 in 5+ unit buildings).
- This rent runs 45% of the median local income ($93k/yr) — at the standard rent-burdened threshold; future hikes will face affordability resistance.
Forward outlook
- Local home prices are declining (-3.0%/yr); year-one equity from $1k of loan paydown is wiped out by about $6k of value loss. Plan a longer hold.
- San Diego County population projected at +20% by 2050 — long-run rental-demand tailwind backs the buy-and-hold thesis.
- At projected returns (-3.0% appreciation + 2.5% rent growth), your $59k cash investment doubles in ~4 years — after that, you're playing with house money.
Negotiation context
- Only 10 days on market — expect competitive offers; lowballing is unlikely to land.
- 8 sale attempts since 13y ago with the ask held roughly flat each time — persistent listings suggest the price (not the market) is what's stuck; bring a comps-based counter.
- Current owner paid $160k; 31% above their basis — modest negotiation headroom, anchor on the comps not their cost.
Risks & watch-outs
- Climate carrying-cost: major wildfire risk; extreme-heat days projected 7→21/yr by 2055 (HVAC capex compounding) — expect insurance premiums to compound above CPI over the hold.
Questions for the listing agent
- Is there a deadline driving the sale (1031 exchange, divorce, estate, relocation)? That informs how much negotiation room exists.
- Schools are D-rated, which usually means shorter tenancies and higher turnover. Who's the typical renter profile here, and what's been the actual vacancy rate?
- Crime grade is D in this area — have there been break-ins, vandalism, or insurance claims at this property in the last 3 years? What carrier currently insures it and at what premium?
- What's the average days-on-market for RENTAL listings here right now (not sales)? A rising rental-DOM trend means longer vacancies and softer asking-rent achievability than the comps imply.
- What's the recent tenant-quality profile in this submarket — average credit score on applications, eviction rate, late-payment / NSF rate, and stable-employment percentage? A property-management company in the area should have these aggregated.
- How much new for-sale + rental construction is in the pipeline within 1–3 miles? Heavy new supply typically softens prices + rents 12–24 months out; constrained supply supports both.
Investment metrics
- 1% rule
- 1.65% ✓
- Cap rate
- 14.97%
- Cash-on-cash
- 30.99%
- DSCR
- 2.38
- GRM
- 5.0
CMA / ARV
- ARV (on-the-fly)
- $274,560
- Comps found
- 12
Show comp detail 12 sales within ~0.75 mi
| Address | Dist | Beds/Ba | Sqft | Sold | Price | $/sf | Match |
|---|---|---|---|---|---|---|---|
| 2300 E Valley Pkwy #145 | 0.29mi | 3/2.0 | 1,564 (+0%) | 9mo | $260,000 | $166 | 79 |
| 2280 E Valley Pkwy #74 | 0.40mi | 3/2.0 | 1,593 (+2%) | 3mo | $279,500 | $175 | 75 |
| 2300 E Valley Pkwy Spc 125 Pkwy | 0.34mi | 3/2.0 | 1,535 (-2%) | 8mo | $270,000 | $176 | 75 |
| 211 N Citrus Ave #270 | 0.00mi | 2/2.0 (-1) | 1,344 (-14%) | 0mo | $147,000 | $109 | 72 |
| 2300 E Valley Pkwy #237 | 0.29mi | 2/2.0 (-1) | 1,440 (-8%) | 6mo | $150,000 | $104 | 64 |
| 2300 E Valley #84 | 0.29mi | 2/2.0 (-1) | 1,440 (-8%) | 6mo | $179,000 | $124 | 63 |
| 2300 E Valley Pkwy #111 | 0.29mi | 3/2.0 | 1,356 (-13%) | 9mo | $245,000 | $181 | 57 |
| 2280 E Valley Pkwy #4 | 0.40mi | 2/2.0 (-1) | 1,362 (-13%) | 2mo | $259,999 | $191 | 54 |
| 2280 E Valley Pkwy #79 | 0.40mi | 2/2.0 (-1) | 1,368 (-12%) | 4mo | $160,000 | $117 | 53 |
| 2550 E Valley Pkwy #77 | 0.52mi | 3/2.0 | 1,344 (-14%) | 0mo | $370,000 | $275 | 52 |
| 2700 E Valley Pkwy #272 | 0.66mi | 3/2.0 | 1,344 (-14%) | 3mo | $280,000 | $208 | 43 |
| 2700 E Valley Pkwy #298 | 0.72mi | 3/2.0 | 1,404 (-10%) | 8mo | $362,000 | $258 | 43 |
Match score weights: distance 35% · size 25% · config 20% · recency 20%. Top-matched comps best support the ARV.
Projected returns pro-forma
-3.0% appreciation · 2.5% rent growth · sell at horizon
- IRR
- 25.2%
- Equity multiple
- 2.03×
- Total profit
- $60,851
- Equity at exit
- $31,312
- IRR
- 32.7%
- Equity multiple
- 3.89×
- Total profit
- $170,098
- Equity at exit
- $18,157
Cash invested: $58,800 (down + closing). Projections, not guarantees.
Landlord ↔ Tenant lean methodology
- Overall (STATE)
- 18 Strongly Tenant-Friendly
- State California
- 18 Strongly Tenant-Friendly · D+13
- County
- — inherits STATE
- City
- — inherits STATE
ZIP-level market 92027
- Rents YoY
- 2.5%
- Active inventory
- 136
- Price-to-rent
- 5.0×
Monthly cashflow live
- Estimated rent
- $3,473 high interval (Pro) →
- Mortgage (P&I)
- −$1,101
- Tax from tax record
- −$37 /mo · $439/yr
- Insurance
- −$88
- HOA
- −$0
- Vacancy / Maint / Mgmt
- −$729
- Net cashflow
- $1,518
Break-even live
UW: 25.0% down · 7.5% · 30yr · 1.5% tax · 5.0% vac · 8.0% maint · 8.0% mgmt
Financing live
Cash to close
- Down payment
- $52,500
- Closing costs
- $6,300
- Reserves months
- —
- Total cash needed
- —
Loan-product check · same deal, 3 products live
Conventional
25% down · 7.5% · 30yr
- Down + closing
- —
- Monthly P&I
- —
- Monthly cashflow
- —
- DSCR
- —
- Eligible?
- —
Personal DTI + credit; lowest rate.
DSCR
20% down · 8.5% · 30yr
- Down + closing
- —
- Monthly P&I
- —
- Monthly cashflow
- —
- DSCR
- —
- Eligible?
- —
No personal income docs; deal must DSCR.
Hard money
10% down · 12.0% · 12mo
- Down + closing
- —
- Monthly P&I
- —
- Monthly cashflow
- —
- DSCR
- —
- Eligible?
- —
Short-term bridge; refi at stabilization.
Rent comps 10 comps
| Address | Beds | Baths | Sqft | Rent | $/sqft | DOM | Units | Dist |
|---|---|---|---|---|---|---|---|---|
| 2460 Bear Valley Pkwy Escondido, CA | 2.0–3.0 | 2.0 | 1049 | $3,379 | $3.22 | 2d | 4 | 0.33mi |
| 610 Daisy St Escondido, CA | 3.0 | 2.0 | 1100 | $3,995 | $3.63 | 2d | 1 | 0.61mi |
| 521 Sandalwood Pl #8 Escondido, CA | 3.0 | 2.0 | 1095 | $3,000 | $2.74 | 2d | 1 | 0.74mi |
| 1695 Kenora Dr Escondido, CA | 3.0 | 2.0 | 1610 | $4,275 | $2.66 | 2d | 1 | 0.78mi |
| 2723 Malibu Pl Escondido, CA | 3.0 | 2.0 | 1204 | $3,400 | $2.82 | 24d | 1 | 0.87mi |
| 330 James St Escondido, CA | 4.0 | 2.0 | 1200 | $3,800 | $3.17 | 15d | 1 | 0.96mi |
| 2932 Soledad Pl Escondido, CA | 4.0 | 2.0 | 1692 | $4,500 | $2.66 | 20d | 1 | 0.99mi |
| 1333 E Grand Ave Escondido, CA | 1.0–2.0 | 1.0–2.0 | 914 | $2,800 | $3.06 | 2d | 13 | 1.04mi |
| 1315 E Grand Ave Escondido, CA | 2.0 | 2.0 | 1120 | $2,400 | $2.14 | 2d | 1 | 1.10mi |
| 505 San Pasqual Valley Rd Escondido, CA | 1.0–2.0 | 1.0–2.5 | 904 | $2,950 | $3.26 | 2d | 1 | 1.34mi |
Listing history 7 events
-
2026-06-18days on market $210,000 Active 10 DOM
-
2026-06-17days on market $210,000 Active 9 DOM
-
2026-06-16days on market $210,000 Active 8 DOM
-
2026-06-15days on market $210,000 Active 7 DOM
-
2026-06-13days on market $210,000 Active 5 DOM
-
2026-06-09remarks 421-char remark
-
2026-06-09$210,000 Active 1 DOM
ⓘ Source: listings_history table (triggers on properties + properties_extension) + one-shot
backfill from property_details.listing_events for pre-trigger history.
Tax reassessment forecast CA · Resets to sale price
- Current annual tax
- $439 · $37/mo
- Projected year-2 tax
- $1,596 · $133/mo
- Expected delta
- +$1,157/yr (+$96/mo · 263.6%)
ⓘ Screening estimate from a state-policy table — verify with the county assessor before closing.
Climate risk First Street
- Flood 3/10 Moderate FEMA zone X (shaded) · 20% chance over 30 yrs
- Wildfire 7/10 Severe
- Heat 6/10 Major 7 d/yr ≥99°F today · 21 d/yr by 30 yrs out
- Wind 1/10 Low
- Air quality 4/10 Moderate 6 unhealthy d/yr today · 7 by 30 yrs out
Nearby sold comps map
Loading sold comps map…
Walkable amenities ~0.75 mi
Loading nearby amenities…
Taxation est. · year 1
- Rental income
- $41,677
- − Mortgage interest
- −$11,763
- − Property taxes
- −$439
- − Insurance
- −$1,050
- − Repairs & maintenance
- −$3,334
- − Management
- −$3,334
- − Depreciation
- −$6,109
- Taxable income
- $15,647
- Est. tax owed @ 24.0%
- −$3,755
- After-tax cash flow
- $14,465/yr
For passive investors: Depreciation is non-cash, so a rental often shows a tax loss while cash-flowing — sheltering income. Rental losses are passive: they offset passive income freely, and up to $25,000/yr can offset ordinary (W-2) income if you actively participate and your MAGI is under $100k (phasing out to $0 by $150k); unused losses carry forward. On sale, claimed depreciation is recaptured at up to 25%, and gains may owe capital-gains tax (a 1031 exchange can defer both). Figures are a year-1 estimate at your 24.0% rate — not tax advice; consult a CPA.
Schools (NCES district)
- District
- Escondido Union High
- NCES district ID
- 0612910
- Math proficiency
- 19% ▼ -2.00%
- Reading proficiency
- 56% ▼ -1.00%
- Median HH income
- $55,731
- Composite
- 32.82/100
- National rank
- #5620
- State rank
- #247 of 517 in CA
Livability — Escondido
- Score
- 70/100
- State rank
- #238
- US rank
- #7829
Category grades
Schools grade is shown separately in the Schools card above.
Census & demographics
- Census place
- Escondido, CA
- County
- San Diego County · 3,178,799 people
- City population
- 177,903
- Metro
- San Diego-Chula Vista-Carlsbad, CA
- Population (ZIP)
- 54,113
- Household income
- $93,338
- Rent vs Own
- Severe rent burden
- 1638.0
Population outlook (San Diego County) Hauer SSP2
- Today (2025)
- 3,678,185 people
- By 2030
- 3,856,546 · +4.8%
- By 2040
- 4,171,407 · +13.4%
- By 2050
- 4,421,607 · +20.2%
- By 2075
- 4,831,599 · +31.4%
- By 2100
- 4,832,502 · +31.4%
Race, ethnicity, and origin ACS 2023
- Neighborhood character
- Diverse neighborhood (Simpson 0.58)
- Race & ethnicity
- Hispanic / Latino 57% White 32% Two or more races 24% Asian 6% Native American 2% Black 2%
- Hispanic origin (detail)
- Mexican 51% Puerto Rican 1%
- Common ancestry
- Italian 2% Lithuanian 2% Romanian 1%
- Foreign-born
- 30% · Canada, Vietnam, China
- Languages at home
- 54% English-only · Spanish 39% Tagalog/Filipino 2% Vietnamese 2%
Political lean MEDSL · San Diego
- 2024 margin
- D (+16.8) · D 56.9% · R 40.1% · Other 2.9%
- 2008→2024 swing
- +6.6pp toward D · 2008: 10.2pp · 2024: 16.8pp
- All cycles
- 2024: D+16.8 2020: D+22.8 2016: D+17.8 2012: D+5.1 2008: D+10.2
Not yet ingested
- Civics
- —
Market trends
- HPI YoY
- ▼ -768.40%
- Current HPI
- 362.1027
- Rent YoY
- ▲ 2.50%
- Metro
- San Diego-Chula Vista-Carlsbad, CA
- State GDP YoY
- ▲ 3.21%
- F500 in state
- 116
Industry mix (Fortune 500 HQ in CA)
| Industry | F500 HQs | Revenue |
|---|---|---|
| Technology | 27 | $1,492B |
|
||
| Financial Services | 3 | $174B |
|
||
| Retail | 3 | $44B |
|
||
| Insurance | 3 | $26B |
|
||
| Media / Entertainment | 2 | $115B |
|
||
| Pharmaceuticals / Biotech | 2 | $62B |
|
||
Price history
+346.8% since first listed19 events — show timeline
- 2026-06-03 Listed $210,000 SDMLS
- 2026-04-26 Listing Removed — SDMLS
- 2026-02-16 Price Changed $225,000 SDMLS
- 2025-11-08 Price Changed $250,000 SDMLS
- 2025-07-24 Listed $290,000 SDMLS
- 2025-01-18 Listing Removed — SDMLS
- 2021-10-29 Sold (MLS) $160,000 SDMLS
- 2021-10-09 Pending — SDMLS
- 2021-07-22 Listed $175,000 SDMLS
- 2021-07-01 Listed $175,000 SDMLS
- 2015-04-01 Listing Removed — SDMLS
- 2015-01-22 Listed $79,900 SDMLS
- 2013-08-02 Sold (MLS) $47,000 CRMLS
- 2013-08-02 Sold (MLS) $47,000 SDMLS
- 2013-06-09 Pending — SDMLS
- 2013-03-22 Relisted — SDMLS
- 2013-03-12 Pending — SDMLS
- 2013-02-13 Listed $47,000 SDMLS
- 2013-02-08 Listed $47,000 CRMLS
Property tax history
+0.3%/yrLatest (2013): $439 · +1.5% YoY. Source: county tax records.
Cash-flow waterfall
monthlySold comps — $/sqft
last 12 mo · ≤1 miLoading sold comps…