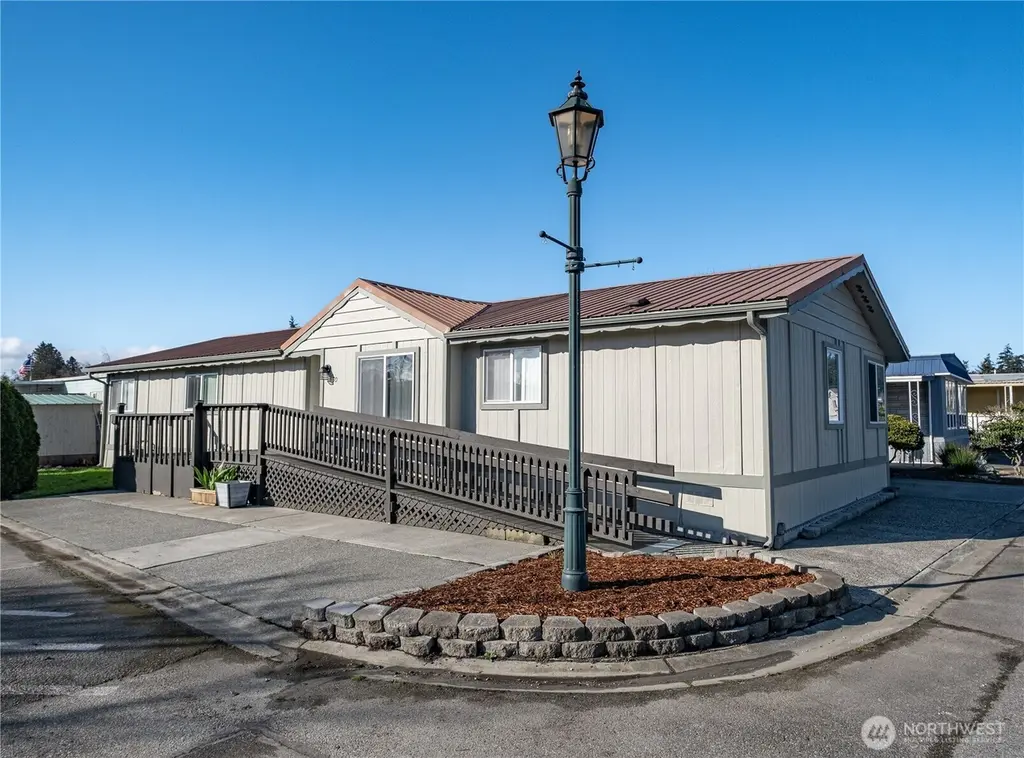
225 NE Ernst #50 · Oak Harbor, WA
Flood risk 1/10 · Minimal
- FEMA flood zone
- X (unshaded)
- Chance of flooding over 30 yrs
- 0.0%
- Est. flood insurance / yr
- $507 – $1,088
Fire risk 3/10 · Minor
- Est. fire insurance / yr
- $604 – $1,122
Heat risk 2/10 · Minimal
- Hot days now (above 78°F)
- 7 days/yr
- Hot days in 30 yrs
- 20 days/yr
Wind risk 1/10 · Minimal
- Chance of severe wind over 30 yrs
- —
Air-quality risk 6/10 · Moderate
- Unhealthy air days now
- 7 days/yr
- Unhealthy air days in 30 yrs
- 8 days/yr
Risk factors via First Street. Map © Google.
Why this score? — see what drove the B grade
The composite is a weighted blend of 9 inputs, each scored 0–100. Each bar is that input's sub-score; the figure is the points it added to the 100-point composite (weight × sub-score).
- Cash flow +30.0/30.0
- 1% rule +10.0/10.0
- DSCR +10.0/10.0
- ARV discount +7.5/15.0
- Schools +4.9/10.0
- Livability +3.9/5.0
- Rent growth +3.8/5.0
- Condition / age +2.5/5.0
- Appreciation +0.0/10.0
$139,000
🖨 Deal sheet 📄 Offer letter ✓ Due diligence
Listing remarks
Beautifully renovated 3 bedroom 2 bath manufactured home in Western Village 55+ community. Home has had lots of upgrades including; new paint inside and out, new cabinets and counter tops, all new appliances, furnace, heat pump, windows, flooring, and hot water tank. The home also already has a ramp installed. Carport has room for two vehicles and there is a storage shed. All you have to do is unpack. Western Village is a level flat park within short distance to shops and services such as groceries, pharmacy and restaurants as well as the Elks club. Come enjoy all that this area has to offer in an affordable comfortable place to live. Pets OK but park has size restriction. Park rent is a
Key facts
- Renovated
- New paint
- New cabinets
Tags
Neighborhood map
What this means for you Summary
Snapshot
- This is a 3-bed/2.0-bath manufactured listed at $139k.
Deal economics
- At list price, monthly cash flow is $1k ($12k/yr) — positive.
- The deal already cash-flows at list — no discount required.
- Meets the 1% rule at list price ($2k rent vs $139k).
- Recommended offer: $131k (6.0% below list) — sets the bar for market timing.
- Cap rate 15.3% vs local median 2.7% in Oak Harbor — top-decile yield for the area; either an underpriced asset or a hidden risk that comps aren't pricing in. Stress-test before assuming the spread holds.
Location & tenants
- Location reads 77/100 on livability (#149 in WA, #3,120 nationally) — a middle-class / working-renter tenant base. Strengths: crime A+, health & safety A+, housing A; Watch: amenities D+, cost of living D+.
- Oak Harbor School District (town): math 49% / reading 61% proficiency, ranked #98 of 291 in WA (top 34%) — acceptable for families but not a draw, mixed tenant base, ~2y average lease.
- Market conditions: Rents rising fast (+5.4%/yr); 277 active listings in the ZIP; 14 comparable units currently listed for rent nearby; rentals lingering (median 44d on market — plan ~5-8 weeks vacancy on turnover, expect pricing pressure); 93% of comp listings sitting > 30 days — soft ceiling on asking rent; solid renter incomes; 402 units permitted in Island County in 2024 (54 in 5+ unit buildings).
- This rent runs 34% of the median local income ($83k/yr) — at the standard rent-burdened threshold; future hikes will face affordability resistance.
Forward outlook
- Local home prices are declining (-3.0%/yr); year-one equity from $961 of loan paydown is wiped out by about $4k of value loss. Plan a longer hold.
- Island County population projected to shrink 6% by 2050 — rents likely to lag national; underwrite the cash flow, not the appreciation.
- At projected returns (-3.0% appreciation + 5.4% rent growth), your $39k cash investment doubles in ~4 years — after that, you're playing with house money.
Negotiation context
- It's been on market 66 days — a 6% lower offer ($131k) is reasonable based on typical stale-listing flexibility.
- 3 sale attempts since 23y ago; this cycle's ask has dropped $11k (7%) from the opening price — seller is motivated, your offer sets the floor, not the list.
- Current owner paid $38k; list at $139k implies a 261% gain — meaningful room to come down on a strong offer.
Questions for the listing agent
- It's been on market 66 days. Have you received any prior offers? Is the seller open to a 6% concession, seller financing, or rate buy-down credit?
- Why hasn't it sold? Are there any deal-killer items the seller is aware of (foundation, flood, title, zoning, code violations)?
- Is there a deadline driving the sale (1031 exchange, divorce, estate, relocation)? That informs how much negotiation room exists.
- Schools are B-rated — typically a magnet for longer-tenancy family renters. What's the average tenant stay here, and is there a school-zone premium baked into asking?
- What's the average days-on-market for RENTAL listings here right now (not sales)? A rising rental-DOM trend means longer vacancies and softer asking-rent achievability than the comps imply.
- What's the recent tenant-quality profile in this submarket — average credit score on applications, eviction rate, late-payment / NSF rate, and stable-employment percentage? A property-management company in the area should have these aggregated.
- How much new for-sale + rental construction is in the pipeline within 1–3 miles? Heavy new supply typically softens prices + rents 12–24 months out; constrained supply supports both.
Investment metrics
- 1% rule
- 1.71% ✓
- Cap rate
- 15.27%
- Cash-on-cash
- 32.07%
- DSCR
- 2.43
- GRM
- 4.9
CMA / ARV
- ARV (median comp)
- $75,000
- List price
- $139,000
- Delta
- 85.33%
- Verdict
- OVERPRICED
- Comps
- 7 within 1.0 mi
Show comp detail 9 sales within ~0.75 mi
| Address | Dist | Beds/Ba | Sqft | Sold | Price | $/sf | Match |
|---|---|---|---|---|---|---|---|
| 225 NE Ernst St #85 | 0.00mi | 2/2.0 (-1) | 1,412 (-6%) | 1mo | $65,000 | $46 | 84 |
| 225 NE Ernst St #99 | 0.00mi | 3/2.0 | 1,440 (-4%) | 15mo | $80,000 | $56 | 80 |
| 225 NE Ernst #51 | 0.12mi | 2/2.0 (-1) | 1,426 (-5%) | 4mo | $80,000 | $56 | 77 |
| 225 NE Ernst, St #83 | 0.00mi | 2/2.0 (-1) | 1,440 (-4%) | 20mo | $65,000 | $45 | 71 |
| 225 NE Ernst #43 | 0.12mi | 2/2.0 (-1) | 1,378 (-8%) | 5mo | $75,000 | $54 | 71 |
| 225 NE Ernst St #70 | 0.12mi | 3/2.0 | 1,344 (-11%) | 12mo | $85,000 | $63 | 66 |
| 225 NE Ernst St #94 | 0.00mi | 3/2.0 | 1,344 (-11%) | 22mo | $59,900 | $45 | 64 |
| 225 NE Ernst St #76 | 0.00mi | 2/2.0 (-1) | 1,344 (-11%) | 21mo | $65,000 | $48 | 59 |
| 1320 Oak Harbor St #190 | 0.64mi | 3/2.0 | 1,344 (-11%) | 7mo | $40,000 | $30 | 47 |
Match score weights: distance 35% · size 25% · config 20% · recency 20%. Top-matched comps best support the ARV.
Projected returns pro-forma
-3.0% appreciation · 5.36% rent growth · sell at horizon
- IRR
- 29.5%
- Equity multiple
- 2.27×
- Total profit
- $49,457
- Equity at exit
- $20,725
- IRR
- 38.1%
- Equity multiple
- 4.93×
- Total profit
- $153,078
- Equity at exit
- $12,018
Cash invested: $38,920 (down + closing). Projections, not guarantees.
Landlord ↔ Tenant lean methodology
- Overall (STATE)
- 28 Tenant-Leaning
- State Washington
- 28 Tenant-Leaning · D+8
- County
- — inherits STATE
- City
- — inherits STATE
ZIP-level market 98277
- Rents YoY
- 5.4%
- Active inventory
- 277
- Price-to-rent
- 4.9×
Monthly cashflow live
- Estimated rent
- $2,376 high interval (Pro) →
- Mortgage (P&I)
- −$729
- Tax from tax record
- −$50 /mo · $602/yr
- Insurance
- −$58
- HOA
- −$0
- Vacancy / Maint / Mgmt
- −$499
- Net cashflow
- $1,040
Break-even live
UW: 25.0% down · 7.5% · 30yr · 1.5% tax · 5.0% vac · 8.0% maint · 8.0% mgmt
Financing live
Cash to close
- Down payment
- $34,750
- Closing costs
- $4,170
- Reserves months
- —
- Total cash needed
- —
Loan-product check · same deal, 3 products live
Conventional
25% down · 7.5% · 30yr
- Down + closing
- —
- Monthly P&I
- —
- Monthly cashflow
- —
- DSCR
- —
- Eligible?
- —
Personal DTI + credit; lowest rate.
DSCR
20% down · 8.5% · 30yr
- Down + closing
- —
- Monthly P&I
- —
- Monthly cashflow
- —
- DSCR
- —
- Eligible?
- —
No personal income docs; deal must DSCR.
Hard money
10% down · 12.0% · 12mo
- Down + closing
- —
- Monthly P&I
- —
- Monthly cashflow
- —
- DSCR
- —
- Eligible?
- —
Short-term bridge; refi at stabilization.
Rent comps 14 comps
| Address | Beds | Baths | Sqft | Rent | $/sqft | DOM | Units | Dist |
|---|---|---|---|---|---|---|---|---|
| 300 N Oak Harbor St Unit B102 Oak Harbor, WA | 3.0 | 2.0 | 1284 | $2,015 | $1.57 | 43d | 1 | 0.05mi |
| 120 NE 10th Ave Unit I2 [[?]180] Oak Harbor, WA | 3.0 | 2.5 | 1784 | $2,800 | $1.57 | 43d | 1 | 0.42mi |
| 120 NE 10th Ave Unit I1 [[?]180] Oak Harbor, WA | 3.0 | 2.5 | 1784 | $2,900 | $1.63 | 43d | 1 | 0.42mi |
| 563 NE Kettle St Unit A2 Oak Harbor, WA | 3.0 | 2.5 | 1241 | $2,415 | $1.95 | 43d | 1 | 0.52mi |
| 650 SW 4th Ave Oak Harbor, WA | 3.0 | 2.0 | 1640 | $2,415 | $1.47 | 43d | 1 | 0.57mi |
| 790 NW Dory Dr Oak Harbor, WA | 3.0 | 2.0 | 1344 | $2,415 | $1.80 | 43d | 1 | 0.63mi |
| 33010 State Route 20 Unit B Oak Harbor, WA | 2.0 | 1.0 | 1100 | $2,440 | $2.22 | 43d | 1 | 0.75mi |
| 1282 NW Lanyard Loop #2 Oak Harbor, WA | 3.0 | 2.5 | 1330 | $2,315 | $1.74 | 43d | 1 | 0.82mi |
| 1205 NW Crosby Ave Oak Harbor, WA | 3.0 | 2.5 | 1766 | $2,600 | $1.47 | 43d | 1 | 0.84mi |
| 1518 NW 9th Pl Oak Harbor, WA | 3.0 | 2.0 | 1167 | $2,415 | $2.07 | 20d | 1 | 1.00mi |
| 30875 State Route 20 Unit M3 Oak Harbor, WA | 3.0 | 2.5 | 1437 | $2,415 | $1.68 | 43d | 1 | 1.22mi |
| 1850 SW Scenic Heights St Unit B102 Oak Harbor, WA | 2.0 | 2.0 | 1540 | $2,415 | $1.57 | 43d | 1 | 1.27mi |
| 1651 SW Mulberry Pl Unit E101 Oak Harbor, WA | 3.0 | 2.0 | 1296 | $2,215 | $1.71 | 43d | 1 | 1.40mi |
| 1725 SW Nienhuis St Oak Harbor, WA | 3.0 | 2.0 | 1326 | $2,515 | $1.90 | 43d | 1 | 1.44mi |
Listing history 21 events
-
2026-06-19days on market $139,000 Active 66 DOM
-
2026-06-18days on market $139,000 Active 65 DOM
-
2026-06-17days on market $139,000 Active 64 DOM
-
2026-06-16days on market $139,000 Active 63 DOM
-
2026-06-15days on market $139,000 Active 62 DOM
-
2026-06-14days on market $139,000 Active 60 DOM
-
2026-06-13days on market $139,000 Active 59 DOM
-
2026-06-10days on market $139,000 Active 57 DOM
-
2026-06-09days on market $139,000 Active 56 DOM
-
2026-06-08days on market $139,000 Active 55 DOM
-
2026-06-07days on market $139,000 Active 54 DOM
-
2026-06-03days on market $139,000 Active 50 DOM
-
2026-06-03status $139,000 Active 49 DOM
-
2026-05-11status Pending - Backup Offer Requested
-
2026-05-08price $139,000
-
2026-03-23$150,000 Active
-
2006-05-31soldstatus $38,500
-
2006-04-21$39,900
-
2003-12-24soldstatus $34,000
-
2003-11-03$35,900
-
1982-08-01soldstatus $38,000
ⓘ Source: listings_history table (triggers on properties + properties_extension) + one-shot
backfill from property_details.listing_events for pre-trigger history.
Tax reassessment forecast WA · Resets to sale price
- Current annual tax
- $602 · $50/mo
- Projected year-2 tax
- $1,362 · $114/mo
- Expected delta
- +$760/yr (+$63/mo · 126.1%)
ⓘ Screening estimate from a state-policy table — verify with the county assessor before closing.
Climate risk First Street
- Flood 1/10 Low FEMA zone X (unshaded) · 0% chance over 30 yrs
- Wildfire 3/10 Moderate
- Heat 2/10 Low 7 d/yr ≥78°F today · 20 d/yr by 30 yrs out
- Wind 1/10 Low
- Air quality 6/10 Major 7 unhealthy d/yr today · 8 by 30 yrs out
Nearby sold comps map
Loading sold comps map…
Walkable amenities ~0.75 mi
Loading nearby amenities…
Taxation est. · year 1
- Rental income
- $28,514
- − Mortgage interest
- −$7,786
- − Property taxes
- −$602
- − Insurance
- −$695
- − Repairs & maintenance
- −$2,281
- − Management
- −$2,281
- − Depreciation
- −$4,044
- Taxable income
- $10,825
- Est. tax owed @ 24.0%
- −$2,598
- After-tax cash flow
- $9,884/yr
For passive investors: Depreciation is non-cash, so a rental often shows a tax loss while cash-flowing — sheltering income. Rental losses are passive: they offset passive income freely, and up to $25,000/yr can offset ordinary (W-2) income if you actively participate and your MAGI is under $100k (phasing out to $0 by $150k); unused losses carry forward. On sale, claimed depreciation is recaptured at up to 25%, and gains may owe capital-gains tax (a 1031 exchange can defer both). Figures are a year-1 estimate at your 24.0% rate — not tax advice; consult a CPA.
Schools (NCES district)
- District
- Oak Harbor School District
- NCES district ID
- 5305940
- Math proficiency
- 49% ▲ 1.00%
- Reading proficiency
- 61% ▲ 1.00%
- Median HH income
- $53,606
- Composite
- 49.07/100
- National rank
- #4427
- State rank
- #98 of 291 in WA
Livability — Oak Harbor
- Score
- 77/100
- State rank
- #149
- US rank
- #3120
Category grades
Schools grade is shown separately in the Schools card above.
Census & demographics
- Census place
- Oak Harbor, WA
- County
- Island County · 71,196 people
- City population
- 40,917
- Metro
- Oak Harbor, WA
- Population (ZIP)
- 40,917
- Household income
- $83,253
- Rent vs Own
- Severe rent burden
- 1359.0
Population outlook (Island County) Hauer SSP2
- Today (2025)
- 82,019 people
- By 2030
- 81,329 · -0.8%
- By 2040
- 78,552 · -4.2%
- By 2050
- 77,042 · -6.1%
- By 2075
- 80,799 · -1.5%
- By 2100
- 84,451 · +3.0%
Race, ethnicity, and origin ACS 2023
- Neighborhood character
- Predominantly White (66%)
- Race & ethnicity
- White 66% Two or more races 14% Hispanic / Latino 12% Asian 8% Black 4%
- Hispanic origin (detail)
- Mexican 9%
- Common ancestry
- Portuguese 4% Slovak 3% Iranian 3%
- Foreign-born
- 9% · Canada, Vietnam
- Languages at home
- 87% English-only · Spanish 5% Tagalog/Filipino 4% Other Asian/Pacific 1%
Political lean MEDSL · Island
- 2024 margin
- D (+16.6) · D 56.8% · R 40.3% · Other 2.9%
- 2008→2024 swing
- +10.3pp toward D · 2008: 6.2pp · 2024: 16.6pp
- All cycles
- 2024: D+16.6 2020: D+12.0 2016: D+5.9 2012: D+4.4 2008: D+6.2
Not yet ingested
- Civics
- —
Market trends
- HPI YoY
- ▼ -608.47%
- Current HPI
- 188.2874
- Rent YoY
- ▲ 5.36%
- Metro
- Oak Harbor, WA
- State GDP YoY
- ▲ 4.65%
- F500 in state
- 22
Industry mix (Fortune 500 HQ in WA)
| Industry | F500 HQs | Revenue |
|---|---|---|
| Retail | 2 | $269B |
|
||
| Technology / Retail | 1 | $638B |
|
||
| Technology | 1 | $245B |
|
||
| Telecommunications | 1 | $38B |
|
||
| Food / Beverage | 1 | $36B |
|
||
| Automotive / Trucks | 1 | $34B |
|
||
Price history
+265.8% since first listed8 events — show timeline
- 2026-05-11 Pending — NWMLS as Distributed by MLS Grid
- 2026-05-08 Price Changed $139,000 NWMLS as Distributed by MLS Grid
- 2026-03-23 Listed $150,000 NWMLS as Distributed by MLS Grid
- 2006-05-31 Sold (MLS) $38,500 NWMLS as Distributed by MLS Grid
- 2006-04-21 Listed $39,900 NWMLS as Distributed by MLS Grid
- 2003-12-24 Sold (MLS) $34,000 NWMLS as Distributed by MLS Grid
- 2003-11-03 Listed $35,900 NWMLS as Distributed by MLS Grid
- 1982-08-01 Sold (Public Records) $38,000 Public Records
Property tax history
+3.3%/yrLatest (2026): $602 · +2.4% YoY. Source: county tax records.
Cash-flow waterfall
monthlySold comps — $/sqft
last 12 mo · ≤1 miLoading sold comps…