 🏗️ New Construction
1935 Stargazer Ln · Angleton, TX
Flood risk 7/10 · Major
- FEMA flood zone
- X (unshaded)
- Chance of flooding over 30 yrs
- 0.99%
- Est. flood insurance / yr
- $507 – $1,088
Fire risk 4/10 · Minor
- Est. fire insurance / yr
- $1,222 – $2,270
Heat risk 9/10 · Severe
- Hot days now (above 111°F)
- 6 days/yr
- Hot days in 30 yrs
- 22 days/yr
Wind risk 9/10 · Severe
- Chance of severe wind over 30 yrs
- 99.0%
Air-quality risk 2/10 · Minimal
- Unhealthy air days now
- 1 days/yr
- Unhealthy air days in 30 yrs
- 1 days/yr
Risk factors via First Street. Map © Google.
Why this score? — see what drove the F grade
The composite is a weighted blend of 9 inputs, each scored 0–100. Each bar is that input's sub-score; the figure is the points it added to the 100-point composite (weight × sub-score).
- Cash flow +7.5/30.0
- ARV discount +7.5/15.0
- Condition / age +4.8/5.0
- Livability +3.7/5.0
- Schools +3.5/10.0
- 1% rule +2.5/10.0
- Rent growth +2.5/5.0
- DSCR +1.6/10.0
- Appreciation +0.0/10.0
$252,990
🖨 Deal sheet (PDF) 📄 Offer letter ✓ Due diligence
Listing remarks
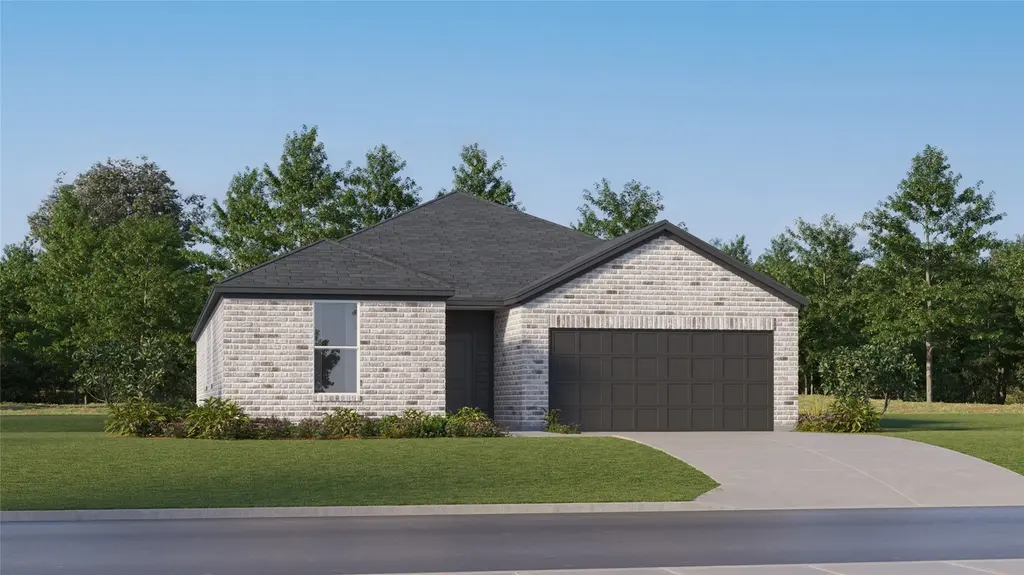
The Hendrix Floor Plan - This single-level home features a modern, low-maintenance layout, with an open-concept floorplan and inviting covered patio perfect for entertaining. Three secondary bedrooms are located off the foyer, with a convenient flex space near the main living area ready to be used as a studio or home office. The luxe owner’s suite is tucked into a private corner at the back of the home. The completion date, prices and features may vary and are subject to change. Please verify with Lennar directly. Photos are for illustrative purposes only.
Key facts
- Flex space
- Single-level home
- Covered patio
Tags
Property features AI
Finance
- HOA & community: Community managed by Preferred Management Services; Annual association fee
Exterior
- Parking: Attached 2-car garage
- Utilities: Public water; Public sewer
- Home design: Residential property; Under construction (new construction); Slab foundation
- Construction: Built in 2026; Brick construction; Composition roof
- Exterior features: Fence with backyard fencing; Subdivision lot
Interior
- Kitchen: Dishwasher; Electric oven; Electric range; Gas oven; Gas range
- Bedrooms: Primary bedroom (first floor); Bedroom (first floor) — 12 x 11; Bedroom (first floor) — 12 x 11; Bedroom (first floor) — 11 x 12
- Flooring: Carpet; Vinyl
- Bathrooms: 3 full bathrooms
- Heating & cooling: Central heating (electric and gas); Central air conditioning (electric and gas)
- Interior features: Breakfast bar; Double vanity; Kitchen/family room combo; Separate shower; Tub/shower
- Laundry & utility: Washer hookup; Electric dryer hookup; Gas dryer hookup
Neighborhood map
What this means for you Summary
Snapshot
- This is a 4-bed/3.0-bath single-family listed at $253k. Condition is rated excellent.
Deal economics
- At list price, monthly cash flow is $-461 ($-6k/yr) — negative.
- To cash-flow at today's rent, offer at most $252k (0.5% below list).
- To meet the 1% rule (rent ≥ 1% of price), the offer needs to be $237k (6.2% below list).
- Recommended offer: $237k (6.2% below list) — sets the bar for 1% rule.
Location & tenants
- Location reads 74/100 on livability (#171 in TX, #4,520 nationally) — a middle-class / working-renter tenant base. Strengths: cost of living A+, housing A+, employment A-; Watch: amenities F, commute F.
- Angleton ISD (suburban): math 36% / reading 44% proficiency, ranked #375 of 826 in TX (top 45%) — families likely to look elsewhere, expect single-tenant / working-renter base with shorter leases.
- Zoned schools: Rancho Isabella El (math 42% / reading 47%, grade F, #1,155 of 4,322 statewide, top 29%, 418 students, 68% FRL); Angleton J H School (math 26% / reading 41%, grade F, #911 of 1,662 statewide, top 56%, 1,561 students, 68% FRL); Angleton H S (math 22% / reading 45%, grade F, #1,011 of 1,632 statewide, top 63%, 2,066 students, 67% FRL).
- Market conditions: 932 active listings in the ZIP; 2 comparable units currently listed for rent nearby; solid renter incomes; 3,960 units permitted in Brazoria County in 2024 (593 in 5+ unit buildings).
- This rent runs 32% of the median local income ($89k/yr) — at the standard rent-burdened threshold; future hikes will face affordability resistance.
Forward outlook
- Local home prices are declining (-3.0%/yr); year-one equity from $2k of loan paydown is wiped out by about $10k of value loss. Plan a longer hold.
- Brazoria County population projected at +44% by 2050 — long-run rental-demand tailwind backs the buy-and-hold thesis.
Negotiation context
- Only 11 days on market — expect competitive offers; lowballing is unlikely to land.
- 2 sale attempts; this cycle's ask is 3% above the opening price — seller raised mid-cycle; expect resistance to lowballs.
Risks & watch-outs
- Watch-outs: flood insurance adds $66/mo.
- Climate carrying-cost: major flood risk; severe wind risk, 99% chance of damaging wind over 30y; extreme-heat days projected 6→22/yr by 2055 (HVAC capex compounding) — expect insurance premiums to compound above CPI over the hold.
Questions for the listing agent
- What do current leases actually rent for vs. the listed asking? Can we see a recent rent roll and the last 12 months of T-12 income?
- What's the actual annual flood-insurance premium (NFIP or private), and is the property in a SFHA with mandatory coverage?
- What does the HOA fee cover, when was the last increase, and are there any pending special assessments or reserve-fund shortfalls?
- Is there a deadline driving the sale (1031 exchange, divorce, estate, relocation)? That informs how much negotiation room exists.
- Schools are D-rated, which usually means shorter tenancies and higher turnover. Who's the typical renter profile here, and what's been the actual vacancy rate?
- The area grade is low — what's the realistic commute time and amenity access for the typical tenant pool here? Any planned neighborhood developments (good or bad) we should know about?
- What's the average days-on-market for RENTAL listings here right now (not sales)? A rising rental-DOM trend means longer vacancies and softer asking-rent achievability than the comps imply.
- What's the recent tenant-quality profile in this submarket — average credit score on applications, eviction rate, late-payment / NSF rate, and stable-employment percentage? A property-management company in the area should have these aggregated.
- How much new for-sale + rental construction is in the pipeline within 1–3 miles? Heavy new supply typically softens prices + rents 12–24 months out; constrained supply supports both.
Investment metrics
- 1% rule
- 0.75% ✗
- Cap rate
- 4.81%
- Cash-on-cash
- -5.31%
- DSCR
- 0.76
- GRM
- 11.2
CMA / ARV
- ARV (median comp)
- $318,289
- List price
- $252,990
- Delta
- -20.52%
- Verdict
- UNDERPRICED
- Comps
- 20 within 1.0 mi
Show comp detail 12 sales within ~0.75 mi
| Address | Dist | Beds/Ba | Sqft | Sold | Price | $/sf | Match |
|---|---|---|---|---|---|---|---|
| 1935 Stargazer Ln | 0.00mi | 4/3.0 | 2,229 (0%) | 0mo | $252,990 | $113 | 100 |
| 28815 Golden Wheat Ct | 0.12mi | 4/2.5 | 2,263 (+2%) | 1mo | $350,990 | $155 | 89 |
| 2103 Mosaic Valley Ct | 0.12mi | 4/2.5 | 2,263 (+2%) | 1mo | $313,990 | $139 | 89 |
| 3623 Atlas Point Ln | 0.13mi | 4/2.5 | 2,263 (+2%) | 1mo | $311,990 | $138 | 88 |
| 2119 Mosaic Valley Ct | 0.15mi | 4/2.5 | 2,263 (+2%) | 2mo | $310,990 | $137 | 87 |
| 3552 Atlas Point Ln | 0.13mi | 4/2.5 | 2,073 (-7%) | 1mo | $279,990 | $135 | 80 |
| 3603 Atlas Point Ct | 0.10mi | 4/2.5 | 2,015 (-10%) | 0mo | $305,990 | $152 | 77 |
| 2126 Mosaic Valley Ct | 0.17mi | 4/2.5 | 1,984 (-11%) | 1mo | $303,990 | $153 | 71 |
| 3507 Atlas Point Ln | 0.11mi | 3/2.5 (-1) | 2,539 (+14%) | 0mo | $265,790 | $105 | 65 |
| 1523 Windrose Bnd | 0.50mi | 4/2.5 | 2,388 (+7%) | 1mo | $299,500 | $125 | 62 |
| 2943 Summer Breeze Way | 0.64mi | 4/2.5 | 2,066 (-7%) | 2mo | $292,990 | $142 | 55 |
| 2931 Summer Breeze Way | 0.66mi | 4/2.5 | 2,066 (-7%) | 2mo | $292,990 | $142 | 54 |
Match score weights: distance 35% · size 25% · config 20% · recency 20%. Top-matched comps best support the ARV.
Projected returns pro-forma
-3.0% appreciation · 3.0% rent growth · sell at horizon
- IRR
- -26.9%
- Equity multiple
- 0.09×
- Total profit
- $-80,801
- Equity at exit
- $47,458
- IRR
- -24.4%
- Equity multiple
- -0.21×
- Total profit
- $-107,661
- Equity at exit
- $27,520
Cash invested: $89,121 (down + closing). Projections, not guarantees.
Landlord ↔ Tenant lean methodology
- Overall (STATE)
- 87 Strongly Landlord-Friendly
- State Texas
- 87 Strongly Landlord-Friendly · R+5
- County
- — inherits STATE
- City
- — inherits STATE
ZIP-level market 77515
- Home prices YoY
- -5.1%
- Active inventory
- 932
- Price-to-rent
- 8.9×
Monthly cashflow live
- Estimated rent
- $2,373 medium interval (Pro) →
- Mortgage (P&I)
- −$1,669
- Tax est. 1.5%
- −$398 /mo · $4,774/yr
- Insurance
- −$133
- Flood insurance flood zone
- −$66 /mo · $798/yr
- HOA
- −$69
- Vacancy / Maint / Mgmt
- −$498
- Net cashflow
- $-461
Break-even live
Sensitivity live
| Price | -10% $-241 | -5% $-351 | +0% $-461 | +5% $-571 | +10% $-681 |
|---|---|---|---|---|---|
| Rent | -10% $-648 | -5% $-554 | +0% $-461 | +5% $-367 | +10% $-273 |
| Rate | -1.0pp $-300 | -0.5pp $-380 | base $-461 | +0.5pp $-543 | +1.0pp $-627 |
UW: 25.0% down · 7.5% · 30yr · 1.5% tax · 5.0% vac · 8.0% maint · 8.0% mgmt
Financing live
Cash to close
- Down payment
- $79,572
- Closing costs
- $9,549
- Reserves months
- —
- Total cash needed
- —
Loan-product check · same deal, 3 products live
Conventional
25% down · 7.5% · 30yr
- Down + closing
- —
- Monthly P&I
- —
- Monthly cashflow
- —
- DSCR
- —
- Eligible?
- —
Personal DTI + credit; lowest rate.
DSCR
20% down · 8.5% · 30yr
- Down + closing
- —
- Monthly P&I
- —
- Monthly cashflow
- —
- DSCR
- —
- Eligible?
- —
No personal income docs; deal must DSCR.
Hard money
10% down · 12.0% · 12mo
- Down + closing
- —
- Monthly P&I
- —
- Monthly cashflow
- —
- DSCR
- —
- Eligible?
- —
Short-term bridge; refi at stabilization.
Rent comps 2 comps
| Address | Beds | Baths | Sqft | Rent | $/sqft | DOM | Units | Dist |
|---|---|---|---|---|---|---|---|---|
| 3606 Atlas Point Ln Angleton, TX | 3.0 | 2.0 | 1876 | $2,250 | $1.20 | 0d | 1 | 0.11mi |
| 513 Robin St Angleton, TX | 4.0 | 2.0 | 1900 | $2,495 | $1.31 | 23d | 1 | 1.21mi |
HOA detail
- Monthly dues
- $69 · $828/yr
Listing history 16 events
-
2026-05-15price $252,990 381-char remark
-
2026-05-14price $252,990 568-char remark
-
2026-05-11$244,540 Active 568-char remark
-
2026-05-11historical
-
2026-05-05price $244,540 381-char remark
-
2026-05-04price $244,540
-
2026-04-29price $258,990 381-char remark
-
2026-04-29price $258,990
-
2026-04-17price $264,740 381-char remark
-
2026-04-17price $264,740
-
2026-04-07price $278,990 381-char remark
-
2026-04-06price $278,990
-
2026-04-06price $284,890 381-char remark
-
2026-01-08price $299,990
-
2026-01-08$342,990 Active
-
2026-01-06$299,990 Active 381-char remark
ⓘ Source: listings_history table (triggers on properties + properties_extension) + one-shot
backfill from property_details.listing_events for pre-trigger history.
Climate risk First Street
- Flood 7/10 Severe FEMA zone X (unshaded) · 99% chance over 30 yrs
- Wildfire 4/10 Moderate
- Heat 9/10 Extreme 6 d/yr ≥111°F today · 22 d/yr by 30 yrs out
- Wind 9/10 Extreme 99% chance of damaging wind over 30 yrs
- Air quality 2/10 Low 1 unhealthy d/yr today · 1 by 30 yrs out
Nearby sold comps map
Loading sold comps map…
Walkable amenities ~0.75 mi
Loading nearby amenities…
Taxation est. · year 1
- Rental income
- $28,471
- − Mortgage interest
- −$17,829
- − Property taxes
- −$4,774
- − Insurance
- −$2,389
- − Repairs & maintenance
- −$2,278
- − Management
- −$2,278
- − HOA
- −$828
- − Depreciation
- −$9,259
- Taxable loss
- −$11,164
- Est. tax savings @ 24.0%
- +$2,679
- After-tax cash flow
- $-2,849/yr
For passive investors: Depreciation is non-cash, so a rental often shows a tax loss while cash-flowing — sheltering income. Rental losses are passive: they offset passive income freely, and up to $25,000/yr can offset ordinary (W-2) income if you actively participate and your MAGI is under $100k (phasing out to $0 by $150k); unused losses carry forward. On sale, claimed depreciation is recaptured at up to 25%, and gains may owe capital-gains tax (a 1031 exchange can defer both). Figures are a year-1 estimate at your 24.0% rate — not tax advice; consult a CPA.
Condition & rehab AI · 1 photo
This single-level home is in excellent condition with no visible repairs or maintenance needed. It offers a modern, low-maintenance layout and is ready for immediate occupancy.
Value-add opportunities
- Both Paint exterior and interior — Fresh paint enhances curb appeal and interior aesthetics
- Both Install smart home devices — Modernizes home and adds value for both buyers and renters
- Both Add smart thermostat — Improves energy efficiency and adds value
- Both Install smart locks — Enhances security and adds value
Renovation cost estimate screening
Value-add ROI direction
- Both Paint exterior and interior — Fresh paint enhances curb appeal and interior aesthetics ↑
- Both Install smart home devices — Modernizes home and adds value for both buyers and renters ↑
- Both Add smart thermostat — Improves energy efficiency and adds value ↑
- Both Install smart locks — Enhances security and adds value ↑
ⓘ Cost ranges are severity-bucket heuristics (US national rule-of-thumb). Get contractor quotes + a written scope before underwriting a rehab budget.
Schools (NCES district)
- District
- Angleton ISD
- NCES district ID
- 4808310
- Math proficiency
- 36% ▼ -8.00%
- Reading proficiency
- 44% ▲ 1.00%
- Median HH income
- $55,670
- Composite
- 35.01/100
- National rank
- #5046
- State rank
- #375 of 826 in TX
Livability — Angleton
- Score
- 74/100
- State rank
- #171
- US rank
- #4520
Category grades
Schools grade is shown separately in the Schools card above.
Census & demographics
- County
- Brazoria County · 374,982 people
- City population
- 34,088
- Metro
- Houston-The Woodlands-Sugar Land, TX
- Population (ZIP)
- 34,088
- Household income
- $88,787
- Rent vs Own
- Severe rent burden
- 785.0
Population outlook (Brazoria County) Hauer SSP2
- Today (2025)
- 420,414 people
- By 2030
- 457,585 · +8.8%
- By 2040
- 532,232 · +26.6%
- By 2050
- 605,399 · +44.0%
- By 2075
- 779,358 · +85.4%
- By 2100
- 883,759 · +110.2%
Race, ethnicity, and origin ACS 2023
- Neighborhood character
- Diverse neighborhood (Simpson 0.58)
- Race & ethnicity
- White 55% Hispanic / Latino 33% Two or more races 18% Black 8% Asian 2%
- Hispanic origin (detail)
- Mexican 28%
- Common ancestry
- Lithuanian 3% Romanian 2% Slovak 1%
- Foreign-born
- 8% · Canada, Vietnam
- Languages at home
- 78% English-only · Spanish 20% Other Asian/Pacific 1%
Political lean MEDSL · Brazoria
- 2024 margin
- R (+19.7) · D 39.5% · R 59.2% · Other 1.3%
- 2008→2024 swing
- +9.9pp toward D · 2008: -29.6pp · 2024: -19.7pp
- All cycles
- 2024: R+19.7 2020: R+18.2 2016: R+24.6 2012: R+34.2 2008: R+29.6
Not yet ingested
- Civics
- —
Market trends
- HPI YoY
- ▼ -15.59%
- Current HPI
- 288.7286
- Rent YoY
- —
- Metro
- Houston-The Woodlands-Sugar Land, TX
- State GDP YoY
- ▲ 3.95%
- F500 in state
- 110
Industry mix (Fortune 500 HQ in TX)
| Industry | F500 HQs | Revenue |
|---|---|---|
| Energy | 16 | $1,198B |
|
||
| Technology | 5 | $198B |
|
||
| Engineering / Construction | 4 | $72B |
|
||
| Energy Services | 3 | $60B |
|
||
| Utilities | 3 | $41B |
|
||
| Healthcare | 2 | $330B |
|
||
Price history
-26.2% since first listed10 events — show timeline
- 2026-05-22 Pending — HARMLS
- 2026-05-14 Price Changed $252,990 HARMLS
- 2026-05-11 Listing Removed — HARMLS
- 2026-05-11 Listed $244,540 HARMLS
- 2026-05-04 Price Changed $244,540 HARMLS
- 2026-04-29 Price Changed $258,990 HARMLS
- 2026-04-17 Price Changed $264,740 HARMLS
- 2026-04-06 Price Changed $278,990 HARMLS
- 2026-01-08 Price Changed $299,990 HARMLS
- 2026-01-08 Listed $342,990 HARMLS
Cash-flow waterfall
monthlySold comps — $/sqft
last 12 mo · ≤1 miLoading sold comps…