3207 English Oaks Blvd · Pearland, TX
Flood risk 4/10 · Minor
- FEMA flood zone
- X (unshaded)
- Chance of flooding over 30 yrs
- 0.22%
- Est. flood insurance / yr
- $507 – $1,088
Fire risk 1/10 · Minimal
- Est. fire insurance / yr
- $1,222 – $2,270
Heat risk 9/10 · Severe
- Hot days now (above 109°F)
- 7 days/yr
- Hot days in 30 yrs
- 24 days/yr
Wind risk 9/10 · Severe
- Chance of severe wind over 30 yrs
- 99.0%
Air-quality risk 2/10 · Minimal
- Unhealthy air days now
- 1 days/yr
- Unhealthy air days in 30 yrs
- 2 days/yr
Risk factors via First Street. Map © Google.
Why this score? — see what drove the D- grade
The composite is a weighted blend of 9 inputs, each scored 0–100. Each bar is that input's sub-score; the figure is the points it added to the 100-point composite (weight × sub-score).
- ARV discount +12.7/15.0
- Cash flow +7.3/30.0
- Schools +5.4/10.0
- Livability +4.0/5.0
- 1% rule +3.0/10.0
- Rent growth +2.9/5.0
- Condition / age +2.5/5.0
- DSCR +1.4/10.0
- Appreciation +0.0/10.0
$314,973
🖨 Deal sheet 📄 Offer letter ✓ Due diligence
Listing remarks MLS
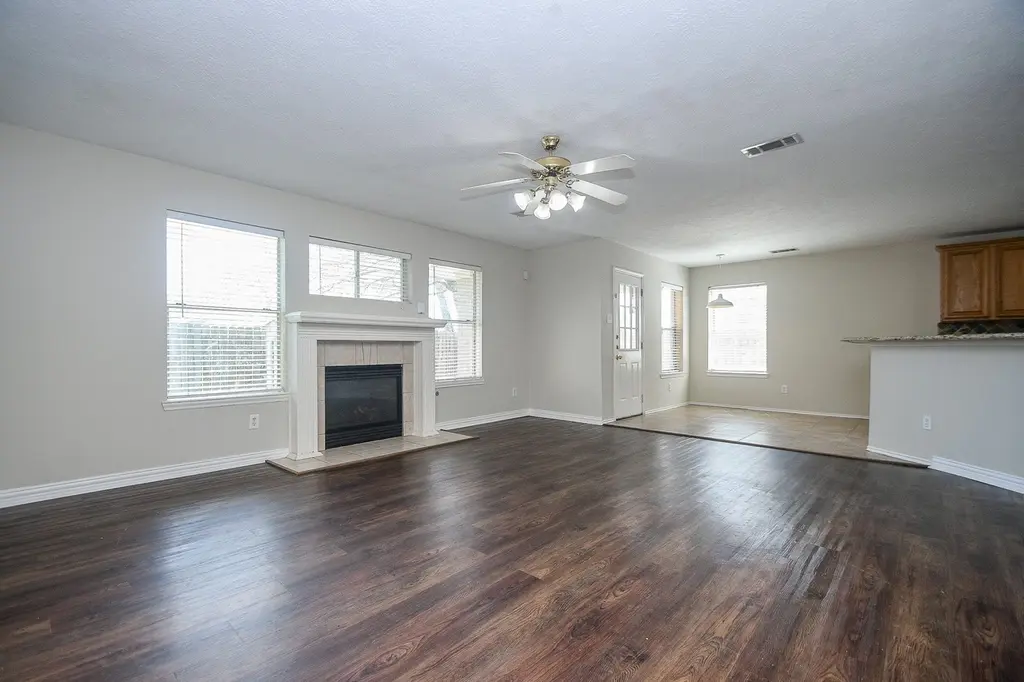
BEAUTIFUL HOME MAKE READY COMPLETED INCLUDING SOME INTERIOR PAINTING & APPLIANCES. VERY LITE & BRITE WITH NEUTRAL DECOR THROUGHOUT! LARGE OPEN KITCHEN FEATURES GRANITE COUNTERTOPS, NATURAL STONE BACKSPLASH, LIGHT OAK CABINETS, ISLAND KITCHEN, LOTS OF COUNTER SPACE AND CABINETS! HUGE DEN OR ''GREAT ROOM'' WITH GORGEOUS FIREPLACE SURROUNDED BY WINDOWS WITH VIEW OF LARGE BACKYARD! HUGE MASTER BEDROOM AND BATH WITH TONS OF STORAGE!
Key facts
- Island kitchen
- Gorgeous fireplace
- Light oak cabinets
Tags
Neighborhood map
What this means for you Summary
Snapshot
- This is a 4-bed/4.0-bath single-family listed at $315k.
Deal economics
- At list price, monthly cash flow is $-424 ($-5k/yr) — negative.
- To cash-flow at today's rent, offer at most $240k (23.8% below list).
- To meet the 1% rule (rent ≥ 1% of price), the offer needs to be $251k (20.2% below list).
- Recommended offer: $240k (23.8% below list) — sets the bar for cash-flow.
- Cap rate 4.7% vs local median 3.0% in Pearland — top-decile yield for the area; either an underpriced asset or a hidden risk that comps aren't pricing in. Stress-test before assuming the spread holds.
Location & tenants
- Location reads 81/100 on livability (#32 in TX, #1,539 nationally) — a professional / high-income tenant draw. Strengths: schools A+, employment A+, housing A+; Watch: amenities D-, commute F.
- Pearland ISD (suburban): math 58% / reading 59% proficiency, ranked #47 of 826 in TX (top 6%) — acceptable for families but not a draw, mixed tenant base, ~2y average lease.
- Market conditions: Rents rising (+1.5%/yr); 497 active listings in the ZIP; 6 comparable units currently listed for rent nearby; rentals leasing fast (median 13d on market — plan ~1-2 weeks tenant-placement turnaround); high-income renter base; 3,960 units permitted in Brazoria County in 2024 (593 in 5+ unit buildings).
Forward outlook
- Local home prices are declining (-3.0%/yr); year-one equity from $2k of loan paydown is wiped out by about $9k of value loss. Plan a longer hold.
- Brazoria County population projected at +44% by 2050 — long-run rental-demand tailwind backs the buy-and-hold thesis.
Negotiation context
- It's been on market 71 days — a 6% lower offer ($296k) is reasonable based on typical stale-listing flexibility.
- 11 sale attempts since 21y ago with the ask held roughly flat each time — persistent listings suggest the price (not the market) is what's stuck; bring a comps-based counter.
Risks & watch-outs
- Climate carrying-cost: severe wind risk, 99% chance of damaging wind over 30y; extreme-heat days projected 7→24/yr by 2055 (HVAC capex compounding) — expect insurance premiums to compound above CPI over the hold.
Questions for the listing agent
- What do current leases actually rent for vs. the listed asking? Can we see a recent rent roll and the last 12 months of T-12 income?
- It's been on market 71 days. Have you received any prior offers? Is the seller open to a 24% concession, seller financing, or rate buy-down credit?
- What does the HOA fee cover, when was the last increase, and are there any pending special assessments or reserve-fund shortfalls?
- Why hasn't it sold? Are there any deal-killer items the seller is aware of (foundation, flood, title, zoning, code violations)?
- Is there a deadline driving the sale (1031 exchange, divorce, estate, relocation)? That informs how much negotiation room exists.
- Schools are A-rated — typically a magnet for longer-tenancy family renters. What's the average tenant stay here, and is there a school-zone premium baked into asking?
- The area grade is low — what's the realistic commute time and amenity access for the typical tenant pool here? Any planned neighborhood developments (good or bad) we should know about?
- What's the average days-on-market for RENTAL listings here right now (not sales)? A rising rental-DOM trend means longer vacancies and softer asking-rent achievability than the comps imply.
- What's the recent tenant-quality profile in this submarket — average credit score on applications, eviction rate, late-payment / NSF rate, and stable-employment percentage? A property-management company in the area should have these aggregated.
- How much new for-sale + rental construction is in the pipeline within 1–3 miles? Heavy new supply typically softens prices + rents 12–24 months out; constrained supply supports both.
Investment metrics
- 1% rule
- 0.80% ✗
- Cap rate
- 4.68%
- Cash-on-cash
- -5.76%
- DSCR
- 0.74
- GRM
- 10.4
CMA / ARV
- ARV (median comp)
- $356,204
- List price
- $314,973
- Delta
- -11.58%
- Verdict
- UNDERPRICED
- Comps
- 20 within 1.0 mi
Show comp detail 12 sales within ~0.75 mi
| Address | Dist | Beds/Ba | Sqft | Sold | Price | $/sf | Match |
|---|---|---|---|---|---|---|---|
| 3212 Autumn Ct | 0.11mi | 4/3.5 | 2,760 (+9%) | 4mo | $399,000 | $145 | 74 |
| 3121 English Oaks Blvd | 0.07mi | 4/3.5 | 2,873 (+14%) | 1mo | $370,000 | $129 | 72 |
| 6501 E Bending Oaks Ln | 0.13mi | 4/2.5 | 2,321 (-8%) | 4mo | $335,000 | $144 | 72 |
| 3302 S Bending Oaks Ln | 0.17mi | 4/2.5 | 2,321 (-8%) | 2mo | $335,000 | $144 | 71 |
| 3114 Autumn Ct | 0.14mi | 3/2.0 (-1) | 2,421 (-4%) | 4mo | $369,000 | $152 | 70 |
| 2807 Red Oak Ln | 0.52mi | 4/2.5 | 2,507 (-1%) | 3mo | $360,000 | $144 | 66 |
| 6113 Tomorrow Cir | 0.59mi | 5/3.5 (+1) | 2,592 (+3%) | 2mo | $389,000 | $150 | 60 |
| 6108 Hubbell Dr | 0.41mi | 4/2.5 | 2,275 (-10%) | 4mo | $305,000 | $134 | 55 |
| 6113 Larrycrest Dr | 0.64mi | 5/3.0 (+1) | 2,384 (-6%) | 0mo | $340,000 | $143 | 52 |
| 6404 Kale Ct | 0.58mi | 4/2.5 | 2,275 (-10%) | 3mo | $350,000 | $154 | 48 |
| 6301 Larrycrest Dr | 0.62mi | 4/2.5 | 2,275 (-10%) | 5mo | $324,999 | $143 | 44 |
| 6418 Patridge Dr | 0.72mi | 4/3.5 | 2,831 (+12%) | 1mo | $349,800 | $124 | 44 |
Match score weights: distance 35% · size 25% · config 20% · recency 20%. Top-matched comps best support the ARV.
Projected returns pro-forma
-3.0% appreciation · 1.47% rent growth · sell at horizon
- IRR
- -28.0%
- Equity multiple
- 0.07×
- Total profit
- $-81,650
- Equity at exit
- $46,963
- IRR
- -34.5%
- Equity multiple
- -0.36×
- Total profit
- $-120,272
- Equity at exit
- $27,233
Cash invested: $88,192 (down + closing). Projections, not guarantees.
Landlord ↔ Tenant lean methodology
- Overall (STATE)
- 87 Strongly Landlord-Friendly
- State Texas
- 87 Strongly Landlord-Friendly · R+5
- County
- — inherits STATE
- City
- — inherits STATE
ZIP-level market 77584
- Home prices YoY
- -18.7%
- Rents YoY
- 1.5%
- Active inventory
- 497
- Price-to-rent
- 10.4×
Monthly cashflow live
- Estimated rent
- $2,514 high interval (Pro) →
- Mortgage (P&I)
- −$1,652
- Tax from tax record
- −$593 /mo · $7,110/yr
- Insurance
- −$131
- HOA
- −$34
- Vacancy / Maint / Mgmt
- −$528
- Net cashflow
- $-424
Break-even live
UW: 25.0% down · 7.5% · 30yr · 1.5% tax · 5.0% vac · 8.0% maint · 8.0% mgmt
Financing live
Cash to close
- Down payment
- $78,743
- Closing costs
- $9,449
- Reserves months
- —
- Total cash needed
- —
Loan-product check · same deal, 3 products live
Conventional
25% down · 7.5% · 30yr
- Down + closing
- —
- Monthly P&I
- —
- Monthly cashflow
- —
- DSCR
- —
- Eligible?
- —
Personal DTI + credit; lowest rate.
DSCR
20% down · 8.5% · 30yr
- Down + closing
- —
- Monthly P&I
- —
- Monthly cashflow
- —
- DSCR
- —
- Eligible?
- —
No personal income docs; deal must DSCR.
Hard money
10% down · 12.0% · 12mo
- Down + closing
- —
- Monthly P&I
- —
- Monthly cashflow
- —
- DSCR
- —
- Eligible?
- —
Short-term bridge; refi at stabilization.
Rent comps 6 comps
| Address | Beds | Baths | Sqft | Rent | $/sqft | DOM | Units | Dist |
|---|---|---|---|---|---|---|---|---|
| 6806 Haley Ct Pearland, TX | 3.0 | 2.5 | 1930 | $2,250 | $1.17 | 16d | 1 | 0.43mi |
| 6207 Winter Oak St Pearland, TX | 3.0 | 2.5 | 1884 | $2,340 | $1.24 | 11d | 1 | 0.43mi |
| 7211 Valentine Ln Pearland, TX | 3.0 | 2.0 | 1945 | $2,250 | $1.16 | 12d | 1 | 0.79mi |
| 4009 Spring Forest Dr Pearland, TX | 3.0 | 2.0 | 1976 | $2,700 | $1.37 | 1d | 1 | 1.28mi |
| 3113 Glenwood Dr Pearland, TX | 4.0 | 2.5 | 2681 | $2,600 | $0.97 | 43d | 1 | 1.28mi |
| 2308 Emerald Stone Ct Pearland, TX | 5.0 | 3.0 | 2452 | $3,000 | $1.22 | 12d | 1 | 1.33mi |
HOA detail
- Monthly dues
- $34 · $408/yr
Listing history 36 events
-
2026-05-31status $314,973 Pending 71 DOM
-
2026-05-13price $314,973 439-char remark
Show marketing remark (439 chars)
BEAUTIFUL HOME MAKE READY COMPLETED INCLUDING SOME INTERIOR PAINTING & APPLIANCES. VERY LITE & BRITE WITH NEUTRAL DECOR THROUGHOUT! LARGE OPEN KITCHEN FEATURES GRANITE COUNTERTOPS, NATURAL STONE BACKSPLASH, LIGHT OAK CABINETS, ISLAND KITCHEN, LOTS OF COUNTER SPACE AND CABINETS! HUGE DEN OR ''GREAT ROOM'' WITH GORGEOUS FIREPLACE SURROUNDED BY WINDOWS WITH VIEW OF LARGE BACKYARD! HUGE MASTER BEDROOM AND BATH WITH TONS OF STORAGE!
-
2026-04-10price $319,973 439-char remark
Show marketing remark (439 chars)
BEAUTIFUL HOME MAKE READY COMPLETED INCLUDING SOME INTERIOR PAINTING & APPLIANCES. VERY LITE & BRITE WITH NEUTRAL DECOR THROUGHOUT! LARGE OPEN KITCHEN FEATURES GRANITE COUNTERTOPS, NATURAL STONE BACKSPLASH, LIGHT OAK CABINETS, ISLAND KITCHEN, LOTS OF COUNTER SPACE AND CABINETS! HUGE DEN OR ''GREAT ROOM'' WITH GORGEOUS FIREPLACE SURROUNDED BY WINDOWS WITH VIEW OF LARGE BACKYARD! HUGE MASTER BEDROOM AND BATH WITH TONS OF STORAGE!
-
2026-03-20$329,973 Active 439-char remark
Show marketing remark (439 chars)
BEAUTIFUL HOME MAKE READY COMPLETED INCLUDING SOME INTERIOR PAINTING & APPLIANCES. VERY LITE & BRITE WITH NEUTRAL DECOR THROUGHOUT! LARGE OPEN KITCHEN FEATURES GRANITE COUNTERTOPS, NATURAL STONE BACKSPLASH, LIGHT OAK CABINETS, ISLAND KITCHEN, LOTS OF COUNTER SPACE AND CABINETS! HUGE DEN OR ''GREAT ROOM'' WITH GORGEOUS FIREPLACE SURROUNDED BY WINDOWS WITH VIEW OF LARGE BACKYARD! HUGE MASTER BEDROOM AND BATH WITH TONS OF STORAGE!
-
2023-11-04historical $2,100
-
2023-11-03historical
-
2023-10-28$2,100
-
2023-10-22price $339,970
-
2023-10-16price $349,970
-
2023-10-06$359,970 Active
-
2023-10-02historical $2,100
-
2023-09-20price $2,100
-
2023-09-07$2,150
-
2023-08-06historical $2,350
-
2023-07-27$2,350
-
2015-05-27soldstatus
-
2015-05-20soldstatus Sold
-
2014-11-20status Pending
-
2014-11-18price $172,000
-
2014-11-18price $160,000
-
2014-11-18historical
-
2014-11-18status Active
-
2014-11-04historical
-
2014-10-25price $187,000
-
2014-10-25status Active
-
2014-10-25price $185,000
-
2014-08-12historical
-
2014-08-12$160,000
-
2014-03-27historical
-
2014-03-27price $179,900
-
2014-02-21$189,000 Active
-
2013-09-07historical
-
2012-09-06$169,000
-
2006-03-09soldstatus
-
2005-09-10historical
-
2005-03-10$164,000
ⓘ Source: listings_history table (triggers on properties + properties_extension) + one-shot
backfill from property_details.listing_events for pre-trigger history.
Tax reassessment forecast TX · Resets to sale price
- Current annual tax
- $7,110 · $593/mo
- Projected year-2 tax
- $7,110 · $593/mo
- Expected delta
- $0/yr ($0/mo · 0.0%)
ⓘ Screening estimate from a state-policy table — verify with the county assessor before closing.
Climate risk First Street
- Flood 4/10 Moderate FEMA zone X (unshaded) · 22% chance over 30 yrs
- Wildfire 1/10 Low
- Heat 9/10 Extreme 7 d/yr ≥109°F today · 24 d/yr by 30 yrs out
- Wind 9/10 Extreme 99% chance of damaging wind over 30 yrs
- Air quality 2/10 Low 1 unhealthy d/yr today · 2 by 30 yrs out
Nearby sold comps map
Loading sold comps map…
Walkable amenities ~0.75 mi
Loading nearby amenities…
Taxation est. · year 1
- Rental income
- $30,166
- − Mortgage interest
- −$17,643
- − Property taxes
- −$7,110
- − Insurance
- −$1,575
- − Repairs & maintenance
- −$2,413
- − Management
- −$2,413
- − HOA
- −$408
- − Depreciation
- −$9,163
- Taxable loss
- −$10,560
- Est. tax savings @ 24.0%
- +$2,534
- After-tax cash flow
- $-2,549/yr
For passive investors: Depreciation is non-cash, so a rental often shows a tax loss while cash-flowing — sheltering income. Rental losses are passive: they offset passive income freely, and up to $25,000/yr can offset ordinary (W-2) income if you actively participate and your MAGI is under $100k (phasing out to $0 by $150k); unused losses carry forward. On sale, claimed depreciation is recaptured at up to 25%, and gains may owe capital-gains tax (a 1031 exchange can defer both). Figures are a year-1 estimate at your 24.0% rate — not tax advice; consult a CPA.
Schools (NCES district)
- District
- Pearland ISD
- NCES district ID
- 4834440
- Math proficiency
- 58% ▼ -13.00%
- Reading proficiency
- 59% ▼ -6.00%
- Median HH income
- $90,091
- Composite
- 53.67/100
- National rank
- #1430
- State rank
- #47 of 826 in TX
Livability — Pearland
- Score
- 81/100
- State rank
- #32
- US rank
- #1539
Category grades
Schools grade is shown separately in the Schools card above.
Census & demographics
- Census place
- Pearland, TX
- County
- Brazoria County · 374,982 people
- City population
- 142,397
- Metro
- Houston-The Woodlands-Sugar Land, TX
- Population (ZIP)
- 91,065
- Household income
- $121,872
- Rent vs Own
- Severe rent burden
- 1539.0
Population outlook (Brazoria County) Hauer SSP2
- Today (2025)
- 420,414 people
- By 2030
- 457,585 · +8.8%
- By 2040
- 532,232 · +26.6%
- By 2050
- 605,399 · +44.0%
- By 2075
- 779,358 · +85.4%
- By 2100
- 883,759 · +110.2%
Race, ethnicity, and origin ACS 2023
- Neighborhood character
- Highly diverse neighborhood (Simpson 0.76)
- Race & ethnicity
- White 32% Hispanic / Latino 22% Asian 21% Black 21% Two or more races 14%
- Hispanic origin (detail)
- Mexican 16% Puerto Rican 2%
- Common ancestry
- Lithuanian 2% Romanian 1% Slovak 1%
- Foreign-born
- 25% · Canada, China, Vietnam
- Languages at home
- 64% English-only · Spanish 14% Chinese 4% Other Indo-European 4%
Political lean MEDSL · Brazoria
- 2024 margin
- R (+19.7) · D 39.5% · R 59.2% · Other 1.3%
- 2008→2024 swing
- +9.9pp toward D · 2008: -29.6pp · 2024: -19.7pp
- All cycles
- 2024: R+19.7 2020: R+18.2 2016: R+24.6 2012: R+34.2 2008: R+29.6
Not yet ingested
- Civics
- —
Market trends
- HPI YoY
- ▼ -49.09%
- Current HPI
- 213.4011
- Rent YoY
- ▲ 1.47%
- Metro
- Houston-The Woodlands-Sugar Land, TX
- State GDP YoY
- ▲ 3.95%
- F500 in state
- 110
Industry mix (Fortune 500 HQ in TX)
| Industry | F500 HQs | Revenue |
|---|---|---|
| Energy | 16 | $1,198B |
|
||
| Technology | 5 | $198B |
|
||
| Engineering / Construction | 4 | $72B |
|
||
| Energy Services | 3 | $60B |
|
||
| Utilities | 3 | $41B |
|
||
| Healthcare | 2 | $330B |
|
||
Price history
+92.1% since first listed35 events — show timeline
- 2026-05-13 Price Changed $314,973 HARMLS
- 2026-04-10 Price Changed $319,973 HARMLS
- 2026-03-20 Listed $329,973 HARMLS
- 2023-11-04 Rental Removed $2,100 HARMLS
- 2023-11-03 Listing Removed — HARMLS
- 2023-10-28 Listed for Rent $2,100 HARMLS
- 2023-10-22 Price Changed $339,970 HARMLS
- 2023-10-16 Price Changed $349,970 HARMLS
- 2023-10-06 Listed $359,970 HARMLS
- 2023-10-02 Rental Removed $2,100 HARMLS
- 2023-09-20 Price Changed $2,100 HARMLS
- 2023-09-07 Listed for Rent $2,150 HARMLS
- 2023-08-06 Rental Removed $2,350 HARMLS
- 2023-07-27 Listed for Rent $2,350 HARMLS
- 2015-05-27 Sold (Public Records) — Public Records
- 2015-05-20 Sold (MLS) — HARMLS
- 2014-11-20 Pending — HARMLS
- 2014-11-18 Price Changed $160,000 HARMLS
- 2014-11-18 Price Changed $172,000 HARMLS
- 2014-11-18 Listing Removed — HARMLS
- 2014-11-18 Relisted — HARMLS
- 2014-11-04 Listing Removed — HARMLS
- 2014-10-25 Price Changed $187,000 HARMLS
- 2014-10-25 Price Changed $185,000 HARMLS
- 2014-10-25 Relisted — HARMLS
- 2014-08-12 Listed $160,000 HARMLS
- 2014-08-12 Listing Removed — HARMLS
- 2014-03-27 Listing Removed — HARMLS
- 2014-03-27 Price Changed $179,900 HARMLS
- 2014-02-21 Listed $189,000 HARMLS
- 2013-09-07 Listing Removed — HARMLS
- 2012-09-06 Listed $169,000 HARMLS
- 2006-03-09 Sold (Public Records) — Public Records
- 2005-09-10 Listing Removed — HARMLS
- 2005-03-10 Listed $164,000 HARMLS
Property tax history
+2.8%/yrLatest (2025): $7,110 · -6.2% YoY. Source: county tax records.
Cash-flow waterfall
monthlySold comps — $/sqft
last 12 mo · ≤1 miLoading sold comps…