 Triplex
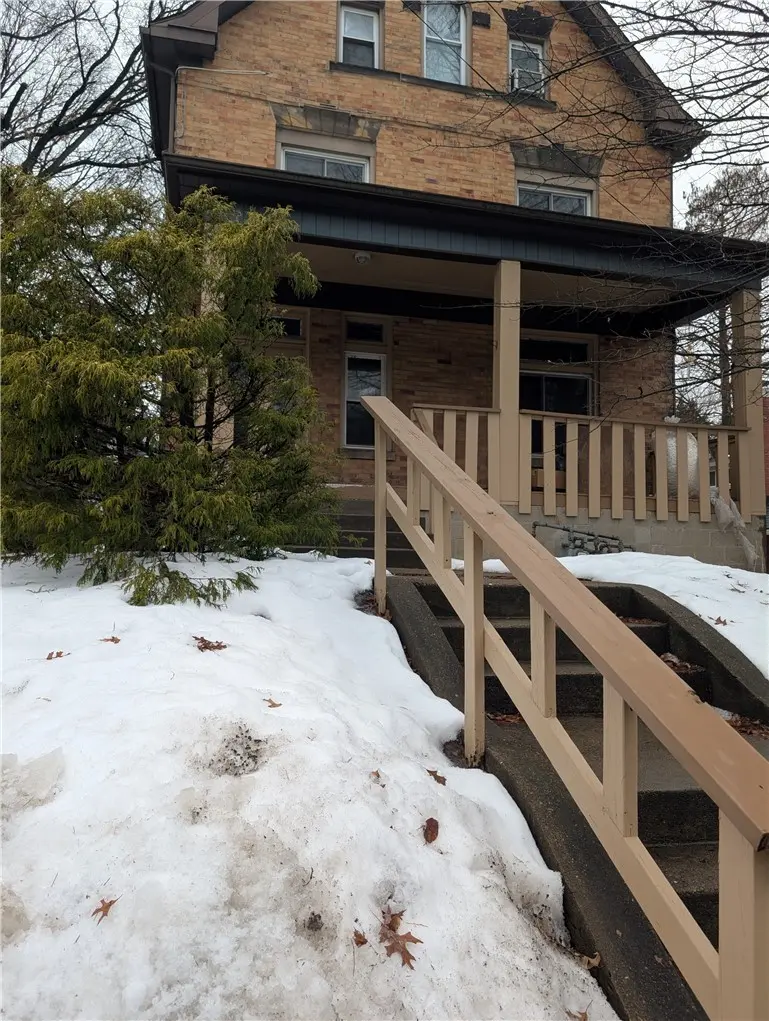
176 Gordon St · Edgewood, PA
Flood risk 1/10 · Minimal
- FEMA flood zone
- X (unshaded)
- Chance of flooding over 30 yrs
- 0.0%
- Est. flood insurance / yr
- $473 – $860
Fire risk 1/10 · Minimal
- Est. fire insurance / yr
- $511 – $949
Heat risk 4/10 · Minor
- Hot days now (above 98°F)
- 7 days/yr
- Hot days in 30 yrs
- 17 days/yr
Wind risk 2/10 · Minimal
- Chance of severe wind over 30 yrs
- —
Air-quality risk 4/10 · Minor
- Unhealthy air days now
- 4 days/yr
- Unhealthy air days in 30 yrs
- 5 days/yr
Risk factors via First Street. Map © Google.
Why this score? — see what drove the C+ grade
The composite is a weighted blend of 9 inputs, each scored 0–100. Each bar is that input's sub-score; the figure is the points it added to the 100-point composite (weight × sub-score).
- Cash flow +30.0/30.0
- 1% rule +10.0/10.0
- DSCR +10.0/10.0
- Livability +4.5/5.0
- Rent growth +4.0/5.0
- Condition / age +2.5/5.0
- Schools +1.8/10.0
- ARV discount +0.0/15.0
- Appreciation +0.0/10.0
$249,000
🖨 Deal sheet 📄 Offer letter ✓ Due diligence
Multi-family units
County records classify this as Multi-Family (2-4 Unit). Listing-text estimate: 3 units. confirmed
Listing remarks MLS
Fully occupied 3-unit investment property located at 176 Gordon St generating approximately $2,100 per month in rental income. This 2,150 sq ft property features a total of 4 bedrooms and 3 bathrooms. The building offers a mix of carpet, hardwood, tile, and linoleum flooring, with repainted interior walls in recent years. Exterior features include a parking pad and small backyard. With long-term tenants already in place, this property presents a solid opportunity for investors seeking immediate rental income and long term potential.
Key facts
- Investment property
- Small backyard
- Long term tenants
Tags
Neighborhood map
What this means for you Summary
Snapshot
- This is a 3 × 4-bed/3.0-bath units multifamily listed at $249k.
Deal economics
- At list price, monthly cash flow is $2k ($20k/yr) — positive. Per door: $558/mo.
- The deal already cash-flows at list — no discount required.
- Meets the 1% rule at list price ($5k rent vs $249k).
- Recommended offer: $234k (6.0% below list) — sets the bar for market timing.
Location & tenants
- Location reads 91/100 on livability (#14 in PA, #64 nationally) — a professional / high-income tenant draw. Strengths: schools A+, commute A+, employment A+; Watch: health & safety D+.
- Woodland Hills SD (suburban): math 13% / reading 30% proficiency, ranked #486 of 539 in PA (top 90%) — low school quality limits family demand, transient renter base, plan for 1-2y turnover; 69% free/reduced lunch — lower-income household profile, screen leases tightly.
- Market conditions: Rents rising fast (+6.0%/yr); 78 active listings in the ZIP; 11 comparable units currently listed for rent nearby; rentals lingering (median 44d on market — plan ~5-8 weeks vacancy on turnover, expect pricing pressure); 55% of comp listings sitting > 30 days — soft ceiling on asking rent; 2,996 units permitted in Allegheny County in 2024 (1,588 in 5+ unit buildings).
- At $4,701/mo this rent would consume 83% of the median local household income ($68k/yr) (locally 605% of renters already pay >50% of income on rent) — very limited rent-growth headroom before tenants either downsize or default.
Forward outlook
- Local home prices are declining (-3.0%/yr); year-one equity from $2k of loan paydown is wiped out by about $7k of value loss. Plan a longer hold.
- At projected returns (-3.0% appreciation + 6.0% rent growth), your $70k cash investment doubles in ~4 years — after that, you're playing with house money.
Negotiation context
- It's been on market 81 days — a 6% lower offer ($234k) is reasonable based on typical stale-listing flexibility.
- 2 sale attempts since 22y ago with the ask held roughly flat each time — persistent listings suggest the price (not the market) is what's stuck; bring a comps-based counter.
- Current owner paid $100k; list at $249k implies a 149% gain — meaningful room to come down on a strong offer.
Risks & watch-outs
- Watch-outs: property tax is 3.0% of price; built in 1922 — expect roof / HVAC / electrical / plumbing capex.
Questions for the listing agent
- It's been on market 81 days. Have you received any prior offers? Is the seller open to a 6% concession, seller financing, or rate buy-down credit?
- Can we see the unit-by-unit rent roll, current vacancy, and any below-market leases? What's the average tenancy length?
- What capital expenditures (roof, boiler, parking lot, exteriors) have been made in the last 5 years, and what's planned in the next 2?
- Built in 1922 — when were the roof, HVAC, electrical panel, plumbing, and water heater last replaced?
- Property tax is high relative to price — has the assessment been appealed recently, and will the sale trigger a re-assessment?
- Why hasn't it sold? Are there any deal-killer items the seller is aware of (foundation, flood, title, zoning, code violations)?
- Is there a deadline driving the sale (1031 exchange, divorce, estate, relocation)? That informs how much negotiation room exists.
- Schools are A-rated — typically a magnet for longer-tenancy family renters. What's the average tenant stay here, and is there a school-zone premium baked into asking?
- What's the average days-on-market for RENTAL listings here right now (not sales)? A rising rental-DOM trend means longer vacancies and softer asking-rent achievability than the comps imply.
- What's the recent tenant-quality profile in this submarket — average credit score on applications, eviction rate, late-payment / NSF rate, and stable-employment percentage? A property-management company in the area should have these aggregated.
- How much new apartment / multifamily construction is in the pipeline within 1–3 miles? Heavy new supply (>2% of stock underway) typically softens rents 12–24 months out; light construction supports rent growth.
Investment metrics
- 1% rule
- 1.89% ✓
- Cap rate
- 14.36%
- Cash-on-cash
- 28.80%
- DSCR
- 2.28
- GRM
- 4.4
CMA / ARV
- ARV (median comp)
- $182,358
- List price
- $249,000
- Delta
- 36.54%
- Verdict
- OVERPRICED
- Comps
- 5 within 1.0 mi
Projected returns pro-forma
-3.0% appreciation · 6.02% rent growth · sell at horizon
- IRR
- 26.9%
- Equity multiple
- 2.16×
- Total profit
- $81,204
- Equity at exit
- $37,127
- IRR
- 36.4%
- Equity multiple
- 4.92×
- Total profit
- $273,276
- Equity at exit
- $21,529
Cash invested: $69,720 (down + closing). Projections, not guarantees.
Landlord ↔ Tenant lean methodology
- Overall (STATE)
- 62 Landlord-Friendly
- State Pennsylvania
- 62 Landlord-Friendly · EVEN
- County
- — inherits STATE
- City
- — inherits STATE
ZIP-level market 15218
- Rents YoY
- 6.0%
- Active inventory
- 78
- Price-to-rent
- 13.2×
Monthly cashflow live
- Estimated rent
- $4,701 medium interval (Pro) →
- Mortgage (P&I)
- −$1,306
- Tax from tax record
- −$631 /mo · $7,572/yr
- Insurance
- −$104
- HOA
- −$0
- Vacancy / Maint / Mgmt
- −$987
- Net cashflow
- $1,673
Break-even live
3-unit breakdown (identical units grouped — click to expand)
| Units | Beds | Baths | Est. rent |
|---|---|---|---|
| 3× units | 4 | 3 | $4,701 |
| #1 | 4 | 3 | $1,567 |
| #2 | 4 | 3 | $1,567 |
| #3 | 4 | 3 | $1,567 |
| Total (3 units) | $4,701 | ||
UW: 25.0% down · 7.5% · 30yr · 1.5% tax · 5.0% vac · 8.0% maint · 8.0% mgmt
Financing live
Cash to close
- Down payment
- $62,250
- Closing costs
- $7,470
- Reserves months
- —
- Total cash needed
- —
Loan-product check · same deal, 3 products live
Conventional
25% down · 7.5% · 30yr
- Down + closing
- —
- Monthly P&I
- —
- Monthly cashflow
- —
- DSCR
- —
- Eligible?
- —
Personal DTI + credit; lowest rate.
DSCR
20% down · 8.5% · 30yr
- Down + closing
- —
- Monthly P&I
- —
- Monthly cashflow
- —
- DSCR
- —
- Eligible?
- —
No personal income docs; deal must DSCR.
Hard money
10% down · 12.0% · 12mo
- Down + closing
- —
- Monthly P&I
- —
- Monthly cashflow
- —
- DSCR
- —
- Eligible?
- —
Short-term bridge; refi at stabilization.
Rent comps 11 comps
| Address | Beds | Baths | Sqft | Rent | $/sqft | DOM | Units | Dist |
|---|---|---|---|---|---|---|---|---|
| 2210 Hampton St Pittsburgh, PA | 3.0 | 1.5 | 1512 | $1,650 | $1.09 | 23d | 1 | 0.24mi |
| 2323 Patterson Ave Pittsburgh, PA | 3.0 | 1.0 | 1440 | $1,800 | $1.25 | 43d | 1 | 0.43mi |
| 2323 Patterson Ave Unit NA Pittsburgh, PA | 3.0 | 1.0 | 1440 | $1,500 | $1.04 | 23d | 1 | 0.43mi |
| 2219 Manor Ave Pittsburgh, PA | 3.0 | 1.0 | 1638 | $1,600 | $0.98 | 23d | 1 | 0.49mi |
| 7225 Whipple St Unit 72255 Pittsburgh, PA | 3.0 | 1.5 | 1440 | $1,695 | $1.18 | 2d | 1 | 0.83mi |
| 1030 Ross Ave Pittsburgh, PA | 4.0 | 3.5 | 2856 | $2,200 | $0.77 | 1d | 1 | 0.87mi |
| 745 Franklin Ave Pittsburgh, PA | 4.0 | 2.0 | 1948 | $1,599 | $0.82 | 43d | 1 | 0.90mi |
| 7009 Church St Pittsburgh, PA | 3.0 | 2.0 | 1800 | $1,550 | $0.86 | 43d | 1 | 0.97mi |
| 1148 East St Pittsburgh, PA | 3.0 | 3.0 | 1738 | $1,700 | $0.98 | 43d | 1 | 1.01mi |
| 3 3rd Ave Braddock, PA | 5.0 | 3.0 | 2500 | $3,800 | $1.52 | 43d | 1 | 1.27mi |
| 515 Hill Ave Pittsburgh, PA | 4.0 | 1.0 | 1628 | $1,300 | $0.80 | 43d | 1 | 1.31mi |
Listing history 6 events
-
2026-05-31days on market $249,000 Active 81 DOM
-
2026-03-11$249,000 Active 540-char remark
Show marketing remark (540 chars)
Fully occupied 3-unit investment property located at 176 Gordon St generating approximately $2,100 per month in rental income. This 2,150 sq ft property features a total of 4 bedrooms and 3 bathrooms. The building offers a mix of carpet, hardwood, tile, and linoleum flooring, with repainted interior walls in recent years. Exterior features include a parking pad and small backyard. With long-term tenants already in place, this property presents a solid opportunity for investors seeking immediate rental income and long term potential.
-
2004-09-24soldstatus $100,000
-
2004-09-20soldstatus $100,000 100-char remark
Show marketing remark (100 chars)
Great Investment 3 Unit With Legal Conversion Many New Mechanics. Must Confirm Appt. Before Showing.
-
2004-06-21$114,900 100-char remark
Show marketing remark (100 chars)
Great Investment 3 Unit With Legal Conversion Many New Mechanics. Must Confirm Appt. Before Showing.
-
1984-07-20soldstatus $60,000
ⓘ Source: listings_history table (triggers on properties + properties_extension) + one-shot
backfill from property_details.listing_events for pre-trigger history.
Tax reassessment forecast PA · Partial reset (capped growth)
- Current annual tax
- $7,572 · $631/mo
- Projected year-2 tax
- $7,572 · $631/mo
- Expected delta
- $0/yr ($0/mo · 0.0%)
ⓘ Screening estimate from a state-policy table — verify with the county assessor before closing.
Climate risk First Street
- Flood 1/10 Low FEMA zone X (unshaded) · 0% chance over 30 yrs
- Wildfire 1/10 Low
- Heat 4/10 Moderate 7 d/yr ≥98°F today · 17 d/yr by 30 yrs out
- Wind 2/10 Low
- Air quality 4/10 Moderate 4 unhealthy d/yr today · 5 by 30 yrs out
Nearby sold comps map
Loading sold comps map…
Walkable amenities ~0.75 mi
Loading nearby amenities…
Taxation est. · year 1
- Rental income
- $56,412
- − Mortgage interest
- −$13,948
- − Property taxes
- −$7,572
- − Insurance
- −$1,245
- − Repairs & maintenance
- −$4,513
- − Management
- −$4,513
- − Depreciation
- −$7,244
- Taxable income
- $17,377
- Est. tax owed @ 24.0%
- −$4,171
- After-tax cash flow
- $15,908/yr
For passive investors: Depreciation is non-cash, so a rental often shows a tax loss while cash-flowing — sheltering income. Rental losses are passive: they offset passive income freely, and up to $25,000/yr can offset ordinary (W-2) income if you actively participate and your MAGI is under $100k (phasing out to $0 by $150k); unused losses carry forward. On sale, claimed depreciation is recaptured at up to 25%, and gains may owe capital-gains tax (a 1031 exchange can defer both). Figures are a year-1 estimate at your 24.0% rate — not tax advice; consult a CPA.
Schools (NCES district)
- District
- Woodland Hills SD
- NCES district ID
- 4216500
- Math proficiency
- 13% ▼ -13.00%
- Reading proficiency
- 30% ▼ -10.00%
- Median HH income
- $41,803
- Composite
- 18.31/100
- National rank
- #8954
- State rank
- #486 of 539 in PA
Livability — Edgewood
- Score
- 91/100
- State rank
- #14
- US rank
- #64
Category grades
Schools grade is shown separately in the Schools card above.
Census & demographics
- Census place
- Edgewood, PA
- County
- Allegheny County · 1,022,028 people
- Metro
- Pittsburgh, PA
- Population (ZIP)
- 13,379
- Household income
- $67,960
- Rent vs Own
- Severe rent burden
- 605.0
Population outlook (Allegheny County) Hauer SSP2
- Today (2025)
- 1,250,282 people
- By 2030
- 1,256,482 · +0.5%
- By 2040
- 1,256,318 · +0.5%
- By 2050
- 1,244,169 · -0.5%
- By 2075
- 1,197,693 · -4.2%
- By 2100
- 1,093,187 · -12.6%
Race, ethnicity, and origin ACS 2023
- Neighborhood character
- Predominantly White (69%)
- Race & ethnicity
- White 69% Black 19% Two or more races 7% Hispanic / Latino 4% Asian 3%
- Common ancestry
- Romanian 6% Serbian 2% Lithuanian 2%
- Foreign-born
- 6% · Canada, China
- Languages at home
- 94% English-only · Spanish 2% Other Indo-European 1% Chinese 1%
Political lean MEDSL · Allegheny
- 2024 margin
- Strong D (+20.3) · D 59.7% · R 39.4%
- 2008→2024 swing
- +4.8pp toward D · 2008: 15.5pp · 2024: 20.3pp
- All cycles
- 2024: D+20.3 2020: D+20.4 2016: D+16.4 2012: D+14.4 2008: D+15.5
Not yet ingested
- Civics
- —
Market trends
- HPI YoY
- ▼ -188.20%
- Current HPI
- 297.8483
- Rent YoY
- ▲ 6.02%
- Metro
- Pittsburgh, PA
- State GDP YoY
- ▲ 1.68%
- F500 in state
- 34
Industry mix (Fortune 500 HQ in PA)
| Industry | F500 HQs | Revenue |
|---|---|---|
| Healthcare | 2 | $309B |
|
||
| Insurance | 2 | $27B |
|
||
| Telecommunications / Media | 1 | $124B |
|
||
| Industrial Distribution | 1 | $22B |
|
||
| Financial Services | 1 | $20B |
|
||
| Chemicals / Materials | 1 | $18B |
|
||
Price history
+315.0% since first listed5 events — show timeline
- 2026-03-11 Listed $249,000 West Penn MLS
- 2004-09-24 Sold (Public Records) $100,000 Public Records
- 2004-09-20 Sold (MLS) $100,000 West Penn MLS
- 2004-06-21 Listed $114,900 West Penn MLS
- 1984-07-20 Sold (Public Records) $60,000 Public Records
Property tax history
+2.0%/yrLatest (2026): $7,572 · +5.8% YoY. Source: county tax records.
Cash-flow waterfall
monthlySold comps — $/sqft
last 12 mo · ≤1 miLoading sold comps…