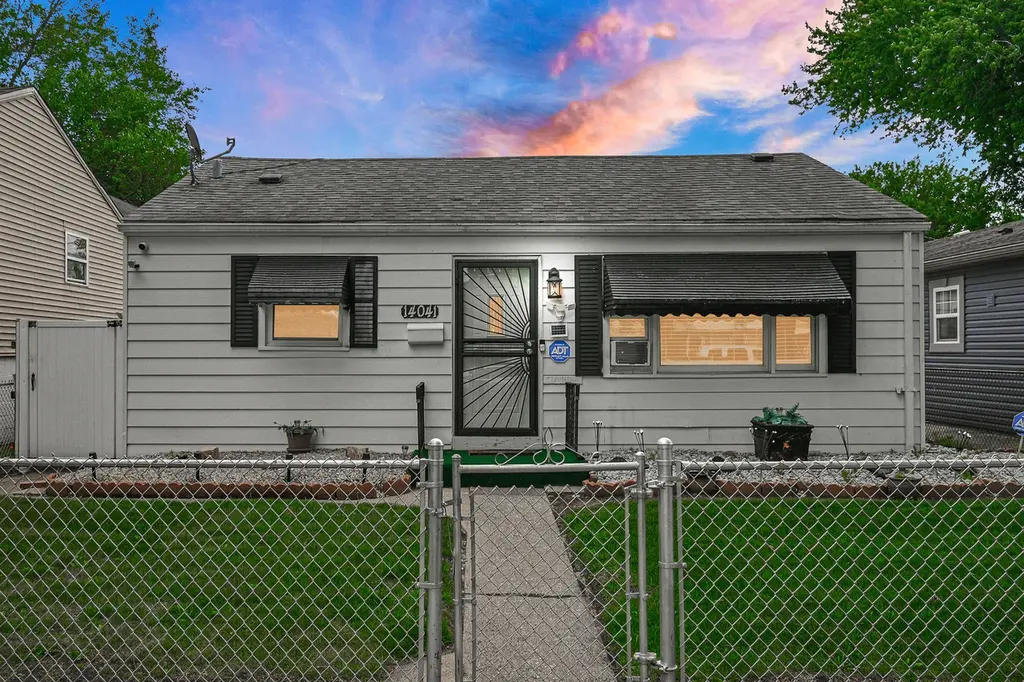
14041 S Calhoun Ave · Burnham, IL
Flood risk 4/10 · Minor
- FEMA flood zone
- X (unshaded)
- Chance of flooding over 30 yrs
- 0.24%
- Est. flood insurance / yr
- $473 – $860
Fire risk 1/10 · Minimal
- Est. fire insurance / yr
- $804 – $1,492
Heat risk 3/10 · Minor
- Hot days now (above 101°F)
- 7 days/yr
- Hot days in 30 yrs
- 15 days/yr
Wind risk 2/10 · Minimal
- Chance of severe wind over 30 yrs
- 0.0%
Air-quality risk 4/10 · Minor
- Unhealthy air days now
- 4 days/yr
- Unhealthy air days in 30 yrs
- 5 days/yr
Risk factors via First Street. Map © Google.
Why this score? — see what drove the D grade
The composite is a weighted blend of 9 inputs, each scored 0–100. Each bar is that input's sub-score; the figure is the points it added to the 100-point composite (weight × sub-score).
- Cash flow +16.4/30.0
- ARV discount +7.5/15.0
- DSCR +5.1/10.0
- 1% rule +4.8/10.0
- Livability +3.7/5.0
- Rent growth +2.5/5.0
- Condition / age +2.5/5.0
- Schools +0.7/10.0
- Appreciation +0.0/10.0
$135,000
🖨 Deal sheet (PDF) 📄 Offer letter ✓ Due diligence
Listing remarks
Whether you're looking to invest or downsize, this charming 3-bedroom, 1-bath home offers endless potential. Situated on a quiet street, this home features spacious bedrooms, an eat-in kitchen, some newer windows, and a newer hot water tank. Enjoy the expansive fenced backyard, perfect for entertaining or creating your own private retreat, along with a spacious 2.5-car garage. Conveniently located near local amenities, this move-in-ready home is a great opportunity for homeowners and investors alike.
Key facts
- Quiet street
- Newer hot water tank
- Newer windows
Tags
Property features AI
Finance
- Other: Property not currently leased; Possession at closing
- HOA & community: No master association fee required
Exterior
- Utilities: Public water; Public sewer
- Home design: Detached single-family home; Single-story; Fee simple ownership; Accessible / disability equipped; Built before 1978 (71-80 years old)
- Construction: Aluminum siding construction
- Exterior features: Aluminum siding; Lot less than 0.25 acre
Interior
- Kitchen: Kitchen on main level (16 x 13); Wood laminate kitchen flooring
- Bedrooms: Master bedroom on main level (13 x 12); Bedroom on main level (11 x 11); Bedroom on main level (12 x 8)
- Flooring: Wood laminate (in kitchen)
- Bathrooms: 1 full bathroom
- Heating & cooling: Natural gas heat; Window air conditioning units
- Interior features: Full basement (other); 5 total rooms
- Laundry & utility: Main-level laundry room (6 x 12)
Neighborhood map
What this means for you Summary
Snapshot
- This is a 3-bed/1.0-bath single-family listed at $135k.
Deal economics
- At list price, monthly cash flow is $76 ($913/yr) — positive.
- The deal already cash-flows at list — no discount required.
- To meet the 1% rule (rent ≥ 1% of price), the offer needs to be $132k (2.0% below list).
- Recommended offer: $132k (2.0% below list) — sets the bar for 1% rule.
Location & tenants
- Location reads 74/100 on livability (#264 in IL, #4,889 nationally) — a middle-class / working-renter tenant base. Strengths: commute A+, cost of living A+, housing A+; Watch: employment D+, amenities F, health & safety F.
- Thornton Twp Hsd 205 (suburban): math 7% / reading 8% proficiency, ranked #594 of 620 in IL (top 96%) — low school quality limits family demand, transient renter base, plan for 1-2y turnover.
- Zoned schools: Caroline Sibley Elem School (math 0% / reading 5%, grade F, #1,923 of 2,056 statewide, top 94%, 518 students, 0% FRL); Creative Communications Acad (math 2% / reading 2%, grade F, #660 of 665 statewide, top 100%, 177 students, 0% FRL); Thornridge High School (math 8% / reading 8%, grade F, #589 of 693 statewide, top 86%, 1,057 students, 0% FRL).
- Market conditions: 23 active listings in the ZIP; 2 comparable units currently listed for rent nearby; 6,272 units permitted in Cook County in 2024 (4,658 in 5+ unit buildings).
Forward outlook
- Local home prices are declining (-3.0%/yr); year-one equity from $933 of loan paydown is wiped out by about $4k of value loss. Plan a longer hold.
Negotiation context
- Only 13 days on market — expect competitive offers; lowballing is unlikely to land.
- Current owner paid $28k; list at $135k implies a 382% gain — meaningful room to come down on a strong offer.
Risks & watch-outs
- Watch-outs: built in 1947 — expect roof / HVAC / electrical / plumbing capex.
Questions for the listing agent
- Built in 1947 — when were the roof, HVAC, electrical panel, plumbing, and water heater last replaced?
- Is there a deadline driving the sale (1031 exchange, divorce, estate, relocation)? That informs how much negotiation room exists.
- Schools are F-rated, which usually means shorter tenancies and higher turnover. Who's the typical renter profile here, and what's been the actual vacancy rate?
- The area grade is low — what's the realistic commute time and amenity access for the typical tenant pool here? Any planned neighborhood developments (good or bad) we should know about?
- What's the average days-on-market for RENTAL listings here right now (not sales)? A rising rental-DOM trend means longer vacancies and softer asking-rent achievability than the comps imply.
- What's the recent tenant-quality profile in this submarket — average credit score on applications, eviction rate, late-payment / NSF rate, and stable-employment percentage? A property-management company in the area should have these aggregated.
- How much new for-sale + rental construction is in the pipeline within 1–3 miles? Heavy new supply typically softens prices + rents 12–24 months out; constrained supply supports both.
Investment metrics
- 1% rule
- 0.98% ✗
- Cap rate
- 6.97%
- Cash-on-cash
- 2.42%
- DSCR
- 1.11
- GRM
- 8.5
CMA / ARV
- ARV (on-the-fly)
- $79,920
- Comps found
- 1
Show comp detail 1 sale within ~0.75 mi
| Address | Dist | Beds/Ba | Sqft | Sold | Price | $/sf | Match |
|---|---|---|---|---|---|---|---|
| 14024 S Manistee Ave | 0.29mi | 2/1.0 (-1) | 812 (+13%) | 0mo | $90,000 | $111 | 60 |
Match score weights: distance 35% · size 25% · config 20% · recency 20%. Top-matched comps best support the ARV.
Projected returns pro-forma
-3.0% appreciation · 3.0% rent growth · sell at horizon
- IRR
- -12.4%
- Equity multiple
- 0.55×
- Total profit
- $-16,988
- Equity at exit
- $20,129
- IRR
- -3.3%
- Equity multiple
- 0.78×
- Total profit
- $-8,382
- Equity at exit
- $11,672
Cash invested: $37,800 (down + closing). Projections, not guarantees.
Landlord ↔ Tenant lean methodology
- Overall (STATE)
- 43 Moderately Tenant-Leaning
- State Illinois
- 43 Moderately Tenant-Leaning · D+7
- County
- — inherits STATE
- City
- — inherits STATE
ZIP-level market 60633
- Home prices YoY
- -24.8%
- Active inventory
- 23
- Price-to-rent
- 8.5×
Monthly cashflow live
- Estimated rent
- $1,323 medium interval (Pro) →
- Mortgage (P&I)
- −$708
- Tax from tax record
- −$205 /mo · $2,461/yr
- Insurance
- −$56
- HOA
- −$0
- Vacancy / Maint / Mgmt
- −$278
- Net cashflow
- $76
Break-even live
Sensitivity live
| Price | -10% $152 | -5% $114 | +0% $76 | +5% $38 | +10% $0 |
|---|---|---|---|---|---|
| Rent | -10% $-28 | -5% $24 | +0% $76 | +5% $128 | +10% $181 |
| Rate | -1.0pp $144 | -0.5pp $110 | base $76 | +0.5pp $41 | +1.0pp $6 |
UW: 25.0% down · 7.5% · 30yr · 1.5% tax · 5.0% vac · 8.0% maint · 8.0% mgmt
Financing live
Cash to close
- Down payment
- $33,750
- Closing costs
- $4,050
- Reserves months
- —
- Total cash needed
- —
Loan-product check · same deal, 3 products live
Conventional
25% down · 7.5% · 30yr
- Down + closing
- —
- Monthly P&I
- —
- Monthly cashflow
- —
- DSCR
- —
- Eligible?
- —
Personal DTI + credit; lowest rate.
DSCR
20% down · 8.5% · 30yr
- Down + closing
- —
- Monthly P&I
- —
- Monthly cashflow
- —
- DSCR
- —
- Eligible?
- —
No personal income docs; deal must DSCR.
Hard money
10% down · 12.0% · 12mo
- Down + closing
- —
- Monthly P&I
- —
- Monthly cashflow
- —
- DSCR
- —
- Eligible?
- —
Short-term bridge; refi at stabilization.
Rent comps 2 comps
| Address | Beds | Baths | Sqft | Rent | $/sqft | DOM | Units | Dist |
|---|---|---|---|---|---|---|---|---|
| 14501 S Torrence Ave Chicago, IL | 1.0–2.0 | 1.0 | 737 | $1,250 | $1.69 | 14d | 2 | 0.59mi |
| 1601 Downs Dr Unit 3S Calumet City, IL | 2.0 | 1.0 | 750 | $1,400 | $1.87 | 26d | 1 | 0.61mi |
Listing history 20 events
-
2026-06-21days on market $135,000 Active 13 DOM
-
2026-06-18days on market $135,000 Active 10 DOM
-
2026-06-17days on market $135,000 Active 9 DOM
-
2026-06-16days on market $135,000 Active 8 DOM
-
2026-06-15days on market $135,000 Active 7 DOM
-
2026-06-13days on market $135,000 Active 5 DOM
-
2026-06-13days on market $135,000 Active 4 DOM
-
2026-06-08remarks 505-char remark
-
2026-06-08pricedays on market $135,000 Active 1 DOM
-
2026-06-04days on market $145,000 Active 220 DOM
-
2026-06-03days on market $145,000 Active 219 DOM
-
2026-06-02days on market $145,000 Active 218 DOM
-
2026-06-01days on market $145,000 Active 217 DOM
-
2026-05-31days on market $145,000 Active 216 DOM
-
2026-01-07price $150,000
-
2025-10-26$170,000 Active
-
1988-09-15soldstatus $27,990
-
1988-09-15soldstatus $28,000
-
1986-05-01soldstatus $42,000
-
1982-07-02soldstatus $38,500
ⓘ Source: listings_history table (triggers on properties + properties_extension) + one-shot
backfill from property_details.listing_events for pre-trigger history.
Tax reassessment forecast IL · Partial reset (capped growth)
- Current annual tax
- $2,461 · $205/mo
- Projected year-2 tax
- $2,763 · $230/mo
- Expected delta
- +$302/yr (+$25/mo · 12.3%)
ⓘ Screening estimate from a state-policy table — verify with the county assessor before closing.
Climate risk First Street
- Flood 4/10 Moderate FEMA zone X (unshaded) · 24% chance over 30 yrs
- Wildfire 1/10 Low
- Heat 3/10 Moderate 7 d/yr ≥101°F today · 15 d/yr by 30 yrs out
- Wind 2/10 Low 0% chance of damaging wind over 30 yrs
- Air quality 4/10 Moderate 4 unhealthy d/yr today · 5 by 30 yrs out
Nearby sold comps map
Loading sold comps map…
Walkable amenities ~0.75 mi
Loading nearby amenities…
Taxation est. · year 1
- Rental income
- $15,879
- − Mortgage interest
- −$7,562
- − Property taxes
- −$2,461
- − Insurance
- −$675
- − Repairs & maintenance
- −$1,270
- − Management
- −$1,270
- − Depreciation
- −$3,927
- Taxable loss
- −$1,287
- Est. tax savings @ 24.0%
- +$309
- After-tax cash flow
- $1,222/yr
For passive investors: Depreciation is non-cash, so a rental often shows a tax loss while cash-flowing — sheltering income. Rental losses are passive: they offset passive income freely, and up to $25,000/yr can offset ordinary (W-2) income if you actively participate and your MAGI is under $100k (phasing out to $0 by $150k); unused losses carry forward. On sale, claimed depreciation is recaptured at up to 25%, and gains may owe capital-gains tax (a 1031 exchange can defer both). Figures are a year-1 estimate at your 24.0% rate — not tax advice; consult a CPA.
Schools (NCES district)
- District
- Thornton Twp Hsd 205
- NCES district ID
- 1738970
- Math proficiency
- 7% ▬ 0.00%
- Reading proficiency
- 8% ▼ -2.00%
- Median HH income
- $43,392
- Composite
- 6.92/100
- National rank
- #9976
- State rank
- #594 of 620 in IL
Livability — Burnham
- Score
- 74/100
- State rank
- #264
- US rank
- #4889
Category grades
Schools grade is shown separately in the Schools card above.
Census & demographics
- Census place
- Burnham, IL
- Population (ZIP)
- 12,485
Population outlook (Cook County) Hauer SSP2
- Today (2025)
- 5,347,519 people
- By 2030
- 5,357,703 · +0.2%
- By 2040
- 5,324,924 · -0.4%
- By 2050
- 5,230,762 · -2.2%
- By 2075
- 4,785,735 · -10.5%
- By 2100
- 4,188,836 · -21.7%
Race, ethnicity, and origin ACS 2023
- Neighborhood character
- Diverse neighborhood (Simpson 0.65)
- Race & ethnicity
- Hispanic / Latino 45% Black 29% White 25% Two or more races 13%
- Hispanic origin (detail)
- Mexican 40% Puerto Rican 3%
- Common ancestry
- Romanian 12% Armenian 2% Iranian 1%
- Foreign-born
- 15% · Canada
- Languages at home
- 69% English-only · Spanish 27% Arabic 2% Other Indo-European 1%
Political lean MEDSL · Cook
- 2024 margin
- Solid D (+42.0) · D 70.4% · R 28.4% · Other 1.2%
- 2008→2024 swing
- -11.4pp toward R · 2008: 53.4pp · 2024: 42.0pp
- All cycles
- 2024: D+42.0 2020: D+50.3 2016: D+53.0 2012: D+49.4 2008: D+53.4
Not yet ingested
- Civics
- —
Market trends
- HPI YoY
- ▼ -90.46%
- Current HPI
- 274.4127
- Rent YoY
- —
- Metro
- —
- State GDP YoY
- ▲ 1.59%
- F500 in state
- 60
Industry mix (Fortune 500 HQ in IL)
| Industry | F500 HQs | Revenue |
|---|---|---|
| Insurance | 4 | $201B |
|
||
| Consumer Goods | 4 | $87B |
|
||
| Industrial Machinery | 3 | $64B |
|
||
| Healthcare | 2 | $55B |
|
||
| Retail / Pharmacy | 1 | $148B |
|
||
| Agriculture / Food | 1 | $86B |
|
||
Price history
+289.6% since first listed6 events — show timeline
- 2026-01-07 Price Changed $150,000 MRED as Distributed by MLS Grid
- 2025-10-26 Listed $170,000 MRED as Distributed by MLS Grid
- 1988-09-15 Sold (Public Records) $28,000 Public Records
- 1988-09-15 Sold (Public Records) $27,990 Public Records
- 1986-05-01 Sold (Public Records) $42,000 Public Records
- 1982-07-02 Sold (Public Records) $38,500 Public Records
Property tax history
+3.8%/yrLatest (2023): $2,461 · +77.5% YoY. Source: county tax records.
Cash-flow waterfall
monthlySold comps — $/sqft
last 12 mo · ≤1 miLoading sold comps…