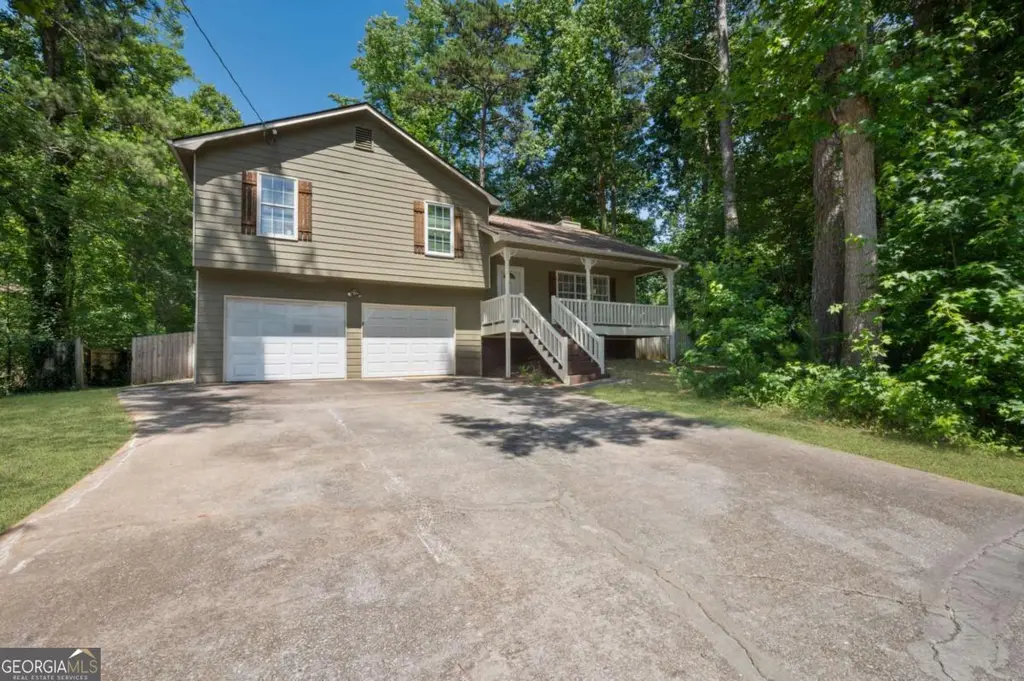
30 White Pines Ln · Dallas, GA
Flood risk 1/10 · Minimal
- FEMA flood zone
- X (unshaded)
- Chance of flooding over 30 yrs
- 0.0%
- Est. flood insurance / yr
- $473 – $860
Fire risk 4/10 · Minor
- Est. fire insurance / yr
- $963 – $1,789
Heat risk 5/10 · Moderate
- Hot days now (above 103°F)
- 7 days/yr
- Hot days in 30 yrs
- 17 days/yr
Wind risk 6/10 · Moderate
- Chance of severe wind over 30 yrs
- 27.0%
Air-quality risk 4/10 · Minor
- Unhealthy air days now
- 4 days/yr
- Unhealthy air days in 30 yrs
- 5 days/yr
Risk factors via First Street. Map © Google.
Why this score? — see what drove the D+ grade
The composite is a weighted blend of 9 inputs, each scored 0–100. Each bar is that input's sub-score; the figure is the points it added to the 100-point composite (weight × sub-score).
- Cash flow +15.4/30.0
- ARV discount +12.9/15.0
- DSCR +4.7/10.0
- 1% rule +3.8/10.0
- Schools +3.6/10.0
- Livability +3.3/5.0
- Condition / age +2.5/5.0
- Rent growth +1.8/5.0
- Appreciation +0.0/10.0
$236,000
🖨 Deal sheet (PDF) 📄 Offer letter ✓ Due diligence
Listing remarks MLS
Don't miss this charming home-perfect for first-time buyers or anyone looking for a cozy, well-kept space. The family room offers a striking stone fireplace with a gas starter, and a separate dining room provides plenty of room for gatherings. The primary bedroom includes its own private bath with a separate tub and shower. Two additional bedrooms offer comfortable space for family, guests, or a home office. The hall bath features a convenient tub/shower combo. Enjoy quiet mornings on the shaded, rocking-chair front porch. The large, fenced backyard is ideal for pets or play, and the deck off the dining room is perfect for grilling or outdoor entertaining. Located near Hiram for convenient access to shopping and dining.
Key facts
- Private bath
- Stone fireplace
- Fenced backyard
Tags
Property features AI
Exterior
- Parking: Drive-under main level garage that faces the front; Two garage spaces
- Utilities: Public water; Public sewer; Electric service (details not specified)
- Home design: One and one-half level home; Resale property
- Construction: Construction materials not specified; Roof type not specified; Other structures on the property (unspecified)
- Exterior features: Back yard fencing; Deck and patio; Other exterior features (not specified)
Interior
- Kitchen: Kitchen with standard features (specifics not provided)
- Bedrooms: Three upper-level bedrooms
- Flooring: Flooring details not specified
- Bathrooms: Two full bathrooms on the upper level; Master bathroom with separate tub and shower
- Heating & cooling: Central heating (natural gas); Central air conditioning; Ceiling fans
- Interior features: One fireplace located in the family room; No shared/common walls; Basement with driveway access; Separate dining room
- Laundry & utility: Laundry in the basement / lower level
Neighborhood map
What this means for you Summary
Snapshot
- This is a 3-bed/2.0-bath single-family listed at $236k.
Deal economics
- At list price, monthly cash flow is $91 ($1k/yr) — positive.
- The deal already cash-flows at list — no discount required.
- To meet the 1% rule (rent ≥ 1% of price), the offer needs to be $208k (11.7% below list).
- Recommended offer: $208k (11.7% below list) — sets the bar for 1% rule.
- Cap rate 6.8% vs local median 4.2% in Dallas — top-decile yield for the area; either an underpriced asset or a hidden risk that comps aren't pricing in. Stress-test before assuming the spread holds.
Location & tenants
- Location reads 66/100 on livability (#192 in GA) — a middle-class / working-renter tenant base. Strengths: crime A+, cost of living A+, housing A+; Watch: employment C-, amenities F, commute F.
- Paulding County (suburban): math 39% / reading 42% proficiency, ranked #33 of 174 in GA (top 19%) — families likely to look elsewhere, expect single-tenant / working-renter base with shorter leases.
- Zoned schools: Allgood Elementary School (math 27% / reading 28%, grade F, #682 of 1,228 statewide, top 56%, 812 students, 63% FRL); Herschel Jones Middle School (math 24% / reading 33%, grade F, #260 of 470 statewide, top 56%, 807 students, 61% FRL); Paulding County High School (math 19% / reading 37%, grade F, #155 of 424 statewide, top 37%, 2,005 students, 48% FRL) — zoned schools average 57% FRL vs 33% district-wide (24 pts higher); higher-poverty schools than district average — tighter screening recommended.
- Zoned-school proficiency averages 28% at this address vs 40% district-wide (-12 pts) — the specific schools serving this property underperform the Paulding County average; the district grade overstates school quality for this exact location.
- Market conditions: Rents soft (-2.8%/yr); 614 active listings in the ZIP; 8 comparable units currently listed for rent nearby; rentals leasing fast (median 5d on market — plan ~1-2 weeks tenant-placement turnaround); solid renter incomes; 1,458 units permitted in Paulding County in 2024 (0 in 5+ unit buildings).
Forward outlook
- Local home prices are declining (-3.0%/yr); year-one equity from $2k of loan paydown is wiped out by about $7k of value loss. Plan a longer hold.
- Paulding County population projected at +24% by 2050 — long-run rental-demand tailwind backs the buy-and-hold thesis.
Negotiation context
- Only 5 days on market — expect competitive offers; lowballing is unlikely to land.
- 6 sale attempts since 6y ago with the ask held roughly flat each time — persistent listings suggest the price (not the market) is what's stuck; bring a comps-based counter.
Risks & watch-outs
- Climate carrying-cost: major wind risk, 27% chance of damaging wind over 30y; extreme-heat days projected 7→17/yr by 2055 (HVAC capex compounding) — expect insurance premiums to compound above CPI over the hold.
Questions for the listing agent
- Is there a deadline driving the sale (1031 exchange, divorce, estate, relocation)? That informs how much negotiation room exists.
- Schools are D-rated, which usually means shorter tenancies and higher turnover. Who's the typical renter profile here, and what's been the actual vacancy rate?
- The area grade is low — what's the realistic commute time and amenity access for the typical tenant pool here? Any planned neighborhood developments (good or bad) we should know about?
- What's the average days-on-market for RENTAL listings here right now (not sales)? A rising rental-DOM trend means longer vacancies and softer asking-rent achievability than the comps imply.
- What's the recent tenant-quality profile in this submarket — average credit score on applications, eviction rate, late-payment / NSF rate, and stable-employment percentage? A property-management company in the area should have these aggregated.
- How much new for-sale + rental construction is in the pipeline within 1–3 miles? Heavy new supply typically softens prices + rents 12–24 months out; constrained supply supports both.
Investment metrics
- 1% rule
- 0.88% ✗
- Cap rate
- 6.75%
- Cash-on-cash
- 1.64%
- DSCR
- 1.07
- GRM
- 9.4
CMA / ARV
- ARV (on-the-fly)
- $267,960
- Comps found
- 12
Show comp detail 12 sales within ~0.75 mi
| Address | Dist | Beds/Ba | Sqft | Sold | Price | $/sf | Match |
|---|---|---|---|---|---|---|---|
| 237 White Pines Dr | 0.09mi | 3/2.0 | 1,274 (-0%) | 6mo | $267,000 | $210 | 90 |
| 164 Emerald Pines Ln | 0.30mi | 3/2.0 | 1,282 (+0%) | 5mo | $251,750 | $196 | 81 |
| 520 White Pines Dr | 0.26mi | 3/2.0 | 1,312 (+3%) | 6mo | $258,000 | $197 | 79 |
| 5 White Pines Dr | 0.23mi | 3/2.0 | 1,290 (+1%) | 12mo | $300,000 | $233 | 78 |
| 2804 Davis Mill Rd N | 0.32mi | 3/2.0 | 1,262 (-1%) | 11mo | $175,000 | $139 | 74 |
| 85 Settlers Mill Run | 0.66mi | 3/2.0 | 1,298 (+2%) | 1mo | $185,000 | $143 | 66 |
| 81 Kingswood Club Dr | 0.47mi | 4/2.0 (+1) | 1,282 (+0%) | 18mo | $300,000 | $234 | 57 |
| 2 King Alfred Ct | 0.51mi | 3/2.0 | 1,200 (-6%) | 18mo | $280,000 | $233 | 51 |
| 71 King Arthur Ct | 0.52mi | 4/2.0 (+1) | 1,413 (+11%) | 5mo | $255,000 | $180 | 49 |
| 2876 Davis Mill Rd N | 0.40mi | 3/2.0 | 1,104 (-14%) | 14mo | $289,000 | $262 | 48 |
| 144 Parson Rd | 0.70mi | 3/1.5 | 1,446 (+13%) | 6mo | $324,600 | $224 | 38 |
| 44 King Arthur Ct | 0.54mi | 3/2.0 | 1,448 (+14%) | 18mo | $260,000 | $180 | 37 |
Match score weights: distance 35% · size 25% · config 20% · recency 20%. Top-matched comps best support the ARV.
Projected returns pro-forma
-3.0% appreciation · 0.0% rent growth · sell at horizon
- IRR
- -17.0%
- Equity multiple
- 0.42×
- Total profit
- $-38,597
- Equity at exit
- $35,188
- IRR
- -15.3%
- Equity multiple
- 0.25×
- Total profit
- $-49,850
- Equity at exit
- $20,405
Cash invested: $66,080 (down + closing). Projections, not guarantees.
Landlord ↔ Tenant lean methodology
- Overall (STATE)
- 90 Strongly Landlord-Friendly
- State Georgia
- 90 Strongly Landlord-Friendly · R+3
- County
- — inherits STATE
- City
- — inherits STATE
ZIP-level market 30157
- Home prices YoY
- -9.4%
- Rents YoY
- -2.8%
- Active inventory
- 614
- Price-to-rent
- 9.4×
Monthly cashflow live
- Estimated rent
- $2,085 high interval (Pro) →
- Mortgage (P&I)
- −$1,238
- Tax from tax record
- −$220 /mo · $2,645/yr
- Insurance
- −$98
- HOA
- −$0
- Vacancy / Maint / Mgmt
- −$438
- Net cashflow
- $91
Break-even live
Sensitivity live
| Price | -10% $224 | -5% $157 | +0% $91 | +5% $24 | +10% $-43 |
|---|---|---|---|---|---|
| Rent | -10% $-74 | -5% $8 | +0% $91 | +5% $173 | +10% $255 |
| Rate | -1.0pp $209 | -0.5pp $151 | base $91 | +0.5pp $29 | +1.0pp $-33 |
UW: 25.0% down · 7.5% · 30yr · 1.5% tax · 5.0% vac · 8.0% maint · 8.0% mgmt
Financing live
Cash to close
- Down payment
- $59,000
- Closing costs
- $7,080
- Reserves months
- —
- Total cash needed
- —
Loan-product check · same deal, 3 products live
Conventional
25% down · 7.5% · 30yr
- Down + closing
- —
- Monthly P&I
- —
- Monthly cashflow
- —
- DSCR
- —
- Eligible?
- —
Personal DTI + credit; lowest rate.
DSCR
20% down · 8.5% · 30yr
- Down + closing
- —
- Monthly P&I
- —
- Monthly cashflow
- —
- DSCR
- —
- Eligible?
- —
No personal income docs; deal must DSCR.
Hard money
10% down · 12.0% · 12mo
- Down + closing
- —
- Monthly P&I
- —
- Monthly cashflow
- —
- DSCR
- —
- Eligible?
- —
Short-term bridge; refi at stabilization.
Rent comps 8 comps
| Address | Beds | Baths | Sqft | Rent | $/sqft | DOM | Units | Dist |
|---|---|---|---|---|---|---|---|---|
| 325 King Henry Rd Dallas, GA | 4.0 | 3.0 | 1524 | $1,975 | $1.30 | 4d | 1 | 0.38mi |
| 13 King Arnold Dr Dallas, GA | 4.0 | 2.0 | 1524 | $1,950 | $1.28 | 7d | 1 | 0.41mi |
| 139 Brooks Mill Ln Dallas, GA | 4.0 | 2.0 | 1654 | $1,896 | $1.15 | 26d | 1 | 0.70mi |
| 2338 Villa Rica Hwy Dallas, GA | 3.0 | 2.0 | 1120 | $1,711 | $1.53 | 14d | 1 | 0.84mi |
| 59 Canterbury Dr Dallas, GA | 4.0 | 3.0 | 1318 | $2,080 | $1.58 | 3d | 1 | 1.16mi |
| 377 Johnstons Dr Dallas, GA | 3.0 | 2.0 | 1296 | $1,860 | $1.44 | 0d | 1 | 1.48mi |
| 120 Paces Meadows Ln Dallas, GA | 3.0 | 2.0 | 1500 | $1,845 | $1.23 | 0d | 1 | 1.48mi |
| 120 Paces Meadows Ln Dallas, GA | 3.0 | 2.0 | 1500 | $1,845 | $1.23 | 3d | 1 | 1.48mi |
Listing history 4 events
-
2026-06-21days on market $236,000 Active 5 DOM
-
2026-06-18days on market $236,000 Active 2 DOM
-
2026-06-17remarks 687-char remark
-
2026-06-17$236,000 Active 1 DOM
ⓘ Source: listings_history table (triggers on properties + properties_extension) + one-shot
backfill from property_details.listing_events for pre-trigger history.
Tax reassessment forecast GA · Resets to sale price
- Current annual tax
- $2,645 · $220/mo
- Projected year-2 tax
- $2,645 · $220/mo
- Expected delta
- $0/yr ($0/mo · 0.0%)
ⓘ Screening estimate from a state-policy table — verify with the county assessor before closing.
Climate risk First Street
- Flood 1/10 Low FEMA zone X (unshaded) · 0% chance over 30 yrs
- Wildfire 4/10 Moderate
- Heat 5/10 Major 7 d/yr ≥103°F today · 17 d/yr by 30 yrs out
- Wind 6/10 Major 27% chance of damaging wind over 30 yrs
- Air quality 4/10 Moderate 4 unhealthy d/yr today · 5 by 30 yrs out
Nearby sold comps map
Loading sold comps map…
Walkable amenities ~0.75 mi
Loading nearby amenities…
Taxation est. · year 1
- Rental income
- $25,017
- − Mortgage interest
- −$13,220
- − Property taxes
- −$2,645
- − Insurance
- −$1,180
- − Repairs & maintenance
- −$2,001
- − Management
- −$2,001
- − Depreciation
- −$6,865
- Taxable loss
- −$2,896
- Est. tax savings @ 24.0%
- +$695
- After-tax cash flow
- $1,782/yr
For passive investors: Depreciation is non-cash, so a rental often shows a tax loss while cash-flowing — sheltering income. Rental losses are passive: they offset passive income freely, and up to $25,000/yr can offset ordinary (W-2) income if you actively participate and your MAGI is under $100k (phasing out to $0 by $150k); unused losses carry forward. On sale, claimed depreciation is recaptured at up to 25%, and gains may owe capital-gains tax (a 1031 exchange can defer both). Figures are a year-1 estimate at your 24.0% rate — not tax advice; consult a CPA.
Schools (NCES district)
- District
- Paulding County
- NCES district ID
- 1304020
- Math proficiency
- 39% ▼ -6.00%
- Reading proficiency
- 42% ▼ -7.00%
- Median HH income
- $61,447
- Composite
- 36.0/100
- National rank
- #4784
- State rank
- #33 of 174 in GA
Livability — Dallas
- Score
- 66/100
- State rank
- #192
- US rank
- #11802
Category grades
Schools grade is shown separately in the Schools card above.
Census & demographics
- County
- Paulding County · 134,013 people
- City population
- 106,793
- Metro
- Atlanta-Sandy Springs-Alpharetta, GA
- Population (ZIP)
- 53,445
- Household income
- $93,625
- Rent vs Own
- Severe rent burden
- 375.0
Population outlook (Paulding County) Hauer SSP2
- Today (2025)
- 175,714 people
- By 2030
- 186,082 · +5.9%
- By 2040
- 204,414 · +16.3%
- By 2050
- 217,040 · +23.5%
- By 2075
- 236,980 · +34.9%
- By 2100
- 238,314 · +35.6%
Race, ethnicity, and origin ACS 2023
- Neighborhood character
- Predominantly White (72%)
- Race & ethnicity
- White 72% Black 13% Two or more races 9% Hispanic / Latino 8% Asian 1%
- Hispanic origin (detail)
- Mexican 3% Puerto Rican 2%
- Common ancestry
- Lithuanian 2% Italian 2% Slovak 1%
- Foreign-born
- 5% · Canada
- Languages at home
- 93% English-only · Spanish 5% French/Haitian/Cajun 1% Other Asian/Pacific 1%
Political lean MEDSL · Paulding
- 2024 margin
- Strong R (+24.1) · D 37.6% · R 61.7%
- 2008→2024 swing
- +14.4pp toward D · 2008: -38.5pp · 2024: -24.1pp
- All cycles
- 2024: R+24.1 2020: R+29.1 2016: R+41.2 2012: R+43.6 2008: R+38.5
Not yet ingested
- Civics
- —
Market trends
- HPI YoY
- ▼ -34.28%
- Current HPI
- 330.3487
- Rent YoY
- ▼ -2.83%
- Metro
- Atlanta-Sandy Springs-Alpharetta, GA
- State GDP YoY
- ▲ 2.66%
- F500 in state
- 28
Industry mix (Fortune 500 HQ in GA)
| Industry | F500 HQs | Revenue |
|---|---|---|
| Paper / Packaging | 2 | $29B |
|
||
| Retail | 1 | $160B |
|
||
| Transportation / Logistics | 1 | $91B |
|
||
| Airlines | 1 | $62B |
|
||
| Consumer Goods | 1 | $47B |
|
||
| Utilities | 1 | $25B |
|
||
Price history
+131.4% since first listed19 events — show timeline
- 2026-06-14 Listed $236,000 FMLS
- 2026-06-14 Listed $236,000 GAMLS
- 2022-10-05 Sold (Public Records) $261,900 Public Records
- 2022-10-04 Sold (MLS) $261,900 GAMLS
- 2022-10-04 Sold (MLS) $261,900 FMLS
- 2022-09-05 Pending — GAMLS
- 2022-09-04 Pending — FMLS
- 2022-08-31 Listed $268,000 GAMLS
- 2022-08-31 Listed $268,000 FMLS
- 2020-06-02 Sold (Public Records) $173,000 Public Records
- 2020-05-29 Sold (MLS) $173,000 GAMLS
- 2020-05-29 Sold (MLS) $173,000 FMLS
- 2020-05-15 Pending — GAMLS
- 2020-05-09 Pending — FMLS
- 2020-05-04 Contingent — FMLS
- 2020-04-16 Listed $174,900 FMLS
- 2020-04-14 Listed $174,900 GAMLS
- 2019-08-22 Sold (Public Records) $94,400 Public Records
- 2000-10-02 Sold (Public Records) $102,000 Public Records
Property tax history
+3.6%/yrLatest (2025): $2,645 · +3.0% YoY. Source: county tax records.
Cash-flow waterfall
monthlySold comps — $/sqft
last 12 mo · ≤1 miLoading sold comps…