 🔨 Auction
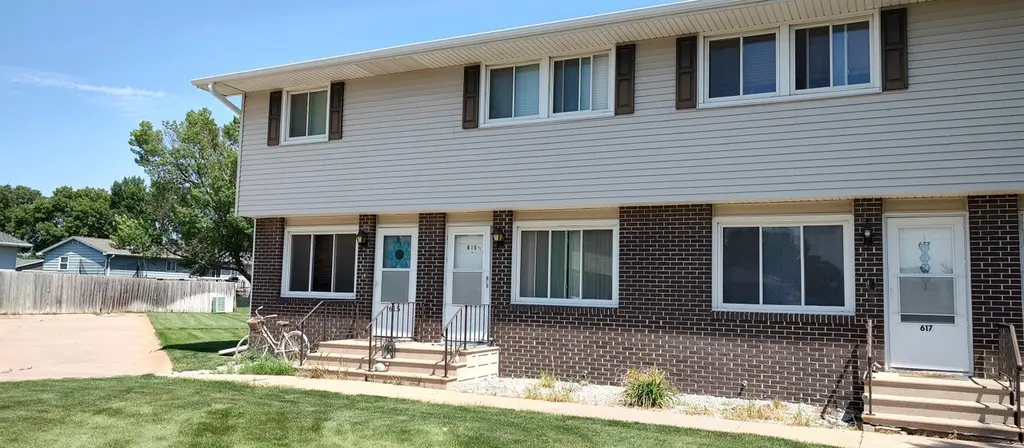
615 1/2 Thomas Dr · Hastings, NE
Flood risk 1/10 · Minimal
- FEMA flood zone
- X (unshaded)
- Chance of flooding over 30 yrs
- 0.0%
- Est. flood insurance / yr
- $473 – $860
Fire risk 1/10 · Minimal
- Est. fire insurance / yr
- $1,161 – $2,155
Heat risk 3/10 · Minor
- Hot days now (above 102°F)
- 7 days/yr
- Hot days in 30 yrs
- 17 days/yr
Wind risk 2/10 · Minimal
- Chance of severe wind over 30 yrs
- —
Air-quality risk 1/10 · Minimal
- Unhealthy air days now
- 0 days/yr
- Unhealthy air days in 30 yrs
- 0 days/yr
Risk factors via First Street. Map © Google.
Why this score? — see what drove the D- grade
The composite is a weighted blend of 9 inputs, each scored 0–100. Each bar is that input's sub-score; the figure is the points it added to the 100-point composite (weight × sub-score).
- Cash flow +12.9/30.0
- ARV discount +7.5/15.0
- Livability +4.0/5.0
- DSCR +3.9/10.0
- Schools +3.4/10.0
- 1% rule +2.7/10.0
- Rent growth +2.5/5.0
- Condition / age +2.5/5.0
- Appreciation +0.0/10.0
$50,000
🖨 Deal sheet 📄 Offer letter ✓ Due diligence
Listing remarks
Open House, Thursday, June 18th, 5-6 PM. 2 bedroom Condo. Tenant occupied. Tenant pays own utilities. Tenants are on a Year Lease ending May 31, 2027. Current rent is $850. per mo. Property is being sold online only! This property is not bank owned, lender owned, or the result of foreclosure proceedings. It is a privately owned property, being offered for sale at public auction at the seller's direction. Auction closing is June 29th, 2026 at 7:00 PM soft close. List price is suggested opening bid only. Final price will be determined via the auction. Final bid is subject to seller confirmation. A 10% Buyer's Premium will be added to the sale price. (For example - If you bid $50,000. the tot
Key facts
- Built 1978
- Listed 9 days
Property features AI
Exterior
- Utilities: Public water; Public sewer; Natural gas available
- Home design: Residential townhome/condo
- Construction: Frame construction
- Exterior features: Lot approximately 3,132 sq ft; Zoned M-1
Interior
- Kitchen: Electric range; Refrigerator
- Bathrooms: 1 main-level bathroom
- Heating & cooling: Forced air heating
- Interior features: Eat-in kitchen; Full basement
- Laundry & utility: Laundry in basement
Neighborhood map
What this means for you Summary
Snapshot
- This is a 2-bed/2.0-bath single-family listed at $50k.
Deal economics
- At list price, monthly cash flow is $-12 ($-141/yr) — negative.
- The deal already cash-flows at list — no discount required.
- Meets the 1% rule at list price ($1k rent vs $50k).
- Cap rate 6.2% vs local median 4.4% in Hastings — top-decile yield for the area; either an underpriced asset or a hidden risk that comps aren't pricing in. Stress-test before assuming the spread holds.
Location & tenants
- Location reads 79/100 on livability (#41 in NE, #2,188 nationally) — a middle-class / working-renter tenant base. Strengths: cost of living A+, housing A+, health & safety A+; Watch: crime C-, amenities D-, commute F.
- Hastings Public Schools (town): math 38% / reading 42% proficiency, ranked #96 of 111 in NE (top 86%) — families likely to look elsewhere, expect single-tenant / working-renter base with shorter leases.
- Zoned schools: Alcott Elementary School (math 27% / reading 37%, grade F, #405 of 502 statewide, top 84%, 249 students, 66% FRL); Hastings Senior High School (math 36% / reading 45%, grade F, #181 of 261 statewide, top 69%, 1,067 students, 52% FRL).
- Market conditions: 191 active listings in the ZIP; 217 units permitted in Adams County in 2024 (132 in 5+ unit buildings).
Forward outlook
- Local home prices are declining (-3.0%/yr); year-one equity from $1k of loan paydown is wiped out by about $5k of value loss. Plan a longer hold.
Negotiation context
- Only 9 days on market — expect competitive offers; lowballing is unlikely to land.
Questions for the listing agent
- What do current leases actually rent for vs. the listed asking? Can we see a recent rent roll and the last 12 months of T-12 income?
- Built in 1978 — when were the roof, HVAC, electrical panel, plumbing, and water heater last replaced?
- Is there a deadline driving the sale (1031 exchange, divorce, estate, relocation)? That informs how much negotiation room exists.
- The area grade is low — what's the realistic commute time and amenity access for the typical tenant pool here? Any planned neighborhood developments (good or bad) we should know about?
- What's the average days-on-market for RENTAL listings here right now (not sales)? A rising rental-DOM trend means longer vacancies and softer asking-rent achievability than the comps imply.
- What's the recent tenant-quality profile in this submarket — average credit score on applications, eviction rate, late-payment / NSF rate, and stable-employment percentage? A property-management company in the area should have these aggregated.
- How much new for-sale + rental construction is in the pipeline within 1–3 miles? Heavy new supply typically softens prices + rents 12–24 months out; constrained supply supports both.
Investment metrics
- 1% rule
- 0.77% ✗
- Cap rate
- 6.21%
- Cash-on-cash
- -0.29%
- DSCR
- 0.99
- GRM
- 10.8
CMA / ARV
- ARV (on-the-fly)
- $174,440
- Comps found
- 1
Show comp detail 1 sale within ~0.75 mi
| Address | Dist | Beds/Ba | Sqft | Sold | Price | $/sf | Match |
|---|---|---|---|---|---|---|---|
| 734 E 4th St | 0.40mi | 2/1.0 | 1,124 (+15%) | 12mo | $200,000 | $178 | 43 |
Match score weights: distance 35% · size 25% · config 20% · recency 20%. Top-matched comps best support the ARV.
Projected returns pro-forma
-3.0% appreciation · 3.0% rent growth · sell at horizon
- IRR
- -16.8%
- Equity multiple
- 0.40×
- Total profit
- $-29,079
- Equity at exit
- $26,010
- IRR
- -8.8%
- Equity multiple
- 0.46×
- Total profit
- $-26,539
- Equity at exit
- $15,082
Cash invested: $48,843 (down + closing). Projections, not guarantees.
Landlord ↔ Tenant lean methodology
- Overall (STATE)
- 83 Strongly Landlord-Friendly
- State Nebraska
- 83 Strongly Landlord-Friendly · R+13
- County
- — inherits STATE
- City
- — inherits STATE
ZIP-level market 68901
- Active inventory
- 191
- Price-to-rent
- 3.1×
Monthly cashflow live
- Estimated rent
- $1,342 medium interval (Pro) →
- Mortgage (P&I)
- −$915
- Tax from tax record
- −$85 /mo · $1,016/yr
- Insurance
- −$73
- HOA
- −$0
- Vacancy / Maint / Mgmt
- −$282
- Net cashflow
- $-12
Break-even live
UW: 25.0% down · 7.5% · 30yr · 1.5% tax · 5.0% vac · 8.0% maint · 8.0% mgmt
Financing live
Cash to close
- Down payment
- $43,610
- Closing costs
- $5,233
- Reserves months
- —
- Total cash needed
- —
Loan-product check · same deal, 3 products live
Conventional
25% down · 7.5% · 30yr
- Down + closing
- —
- Monthly P&I
- —
- Monthly cashflow
- —
- DSCR
- —
- Eligible?
- —
Personal DTI + credit; lowest rate.
DSCR
20% down · 8.5% · 30yr
- Down + closing
- —
- Monthly P&I
- —
- Monthly cashflow
- —
- DSCR
- —
- Eligible?
- —
No personal income docs; deal must DSCR.
Hard money
10% down · 12.0% · 12mo
- Down + closing
- —
- Monthly P&I
- —
- Monthly cashflow
- —
- DSCR
- —
- Eligible?
- —
Short-term bridge; refi at stabilization.
Listing history 8 events
-
2026-06-18days on market $50,000 Active 9 DOM
-
2026-06-17days on market $50,000 Active 8 DOM
-
2026-06-16days on market $50,000 Active 7 DOM
-
2026-06-15days on market $50,000 Active 6 DOM
-
2026-06-13days on market $50,000 Active 4 DOM
-
2026-06-12days on market $50,000 Active 3 DOM
-
2026-06-09remarks 699-char remark
-
2026-06-09$50,000 Active 1 DOM
ⓘ Source: listings_history table (triggers on properties + properties_extension) + one-shot
backfill from property_details.listing_events for pre-trigger history.
Tax reassessment forecast NE · Resets to sale price
- Current annual tax
- $1,016 · $85/mo
- Projected year-2 tax
- $1,016 · $85/mo
- Expected delta
- $0/yr ($0/mo · 0.0%)
ⓘ Screening estimate from a state-policy table — verify with the county assessor before closing.
Climate risk First Street
- Flood 1/10 Low FEMA zone X (unshaded) · 0% chance over 30 yrs
- Wildfire 1/10 Low
- Heat 3/10 Moderate 7 d/yr ≥102°F today · 17 d/yr by 30 yrs out
- Wind 2/10 Low
- Air quality 1/10 Low 0 unhealthy d/yr today · 0 by 30 yrs out
Nearby sold comps map
Loading sold comps map…
Walkable amenities ~0.75 mi
Loading nearby amenities…
Taxation est. · year 1
- Rental income
- $16,107
- − Mortgage interest
- −$9,771
- − Property taxes
- −$1,016
- − Insurance
- −$872
- − Repairs & maintenance
- −$1,289
- − Management
- −$1,289
- − Depreciation
- −$5,075
- Taxable loss
- −$3,205
- Est. tax savings @ 24.0%
- +$769
- After-tax cash flow
- $628/yr
For passive investors: Depreciation is non-cash, so a rental often shows a tax loss while cash-flowing — sheltering income. Rental losses are passive: they offset passive income freely, and up to $25,000/yr can offset ordinary (W-2) income if you actively participate and your MAGI is under $100k (phasing out to $0 by $150k); unused losses carry forward. On sale, claimed depreciation is recaptured at up to 25%, and gains may owe capital-gains tax (a 1031 exchange can defer both). Figures are a year-1 estimate at your 24.0% rate — not tax advice; consult a CPA.
Schools (NCES district)
- District
- Hastings Public Schools
- NCES district ID
- 3171580
- Math proficiency
- 38% ▼ -8.00%
- Reading proficiency
- 42% ▼ -4.00%
- Median HH income
- $42,942
- Composite
- 33.81/100
- National rank
- #5363
- State rank
- #96 of 111 in NE
Livability — Hastings
- Score
- 79/100
- State rank
- #41
- US rank
- #2188
Category grades
Schools grade is shown separately in the Schools card above.
Census & demographics
- Census place
- Hastings, NE
- City population
- 26,208
- Population (ZIP)
- 26,208
Population outlook (Adams County) Hauer SSP2
- Today (2025)
- 31,965 people
- By 2030
- 32,079 · +0.4%
- By 2040
- 31,999 · +0.1%
- By 2050
- 31,586 · -1.2%
- By 2075
- 30,856 · -3.5%
- By 2100
- 29,948 · -6.3%
Race, ethnicity, and origin ACS 2023
- Neighborhood character
- Predominantly White (81%)
- Race & ethnicity
- White 81% Hispanic / Latino 14% Two or more races 8% Black 1% Asian 1%
- Hispanic origin (detail)
- Mexican 9% Cuban 1%
- Common ancestry
- Lithuanian 2% Romanian 2% Italian 2%
- Foreign-born
- 7% · Canada, Vietnam
- Languages at home
- 89% English-only · Spanish 9% Vietnamese 1%
Political lean MEDSL · Adams
- 2024 margin
- Solid R (+41.6) · D 28.5% · R 70.2% · Other 1.3%
- 2008→2024 swing
- -14.6pp toward R · 2008: -27.0pp · 2024: -41.6pp
- All cycles
- 2024: R+41.6 2020: R+40.1 2016: R+45.0 2012: R+34.1 2008: R+27.0
Not yet ingested
- Civics
- —
Market trends
- HPI YoY
- ▼ -255.77%
- Current HPI
- 232.0444
- Rent YoY
- —
- Metro
- —
- State GDP YoY
- ▲ 0.68%
- F500 in state
- 2
Industry mix (Fortune 500 HQ in NE)
| Industry | F500 HQs | Revenue |
|---|---|---|
| Conglomerate | 1 | $371B |
|
||
Price history
1 event — show timeline
- 2026-04-10 Listed $50,000 GMNMLS
Property tax history
+3.3%/yrLatest (2025): $1,016 · +15.5% YoY. Source: county tax records.
Cash-flow waterfall
monthlySold comps — $/sqft
last 12 mo · ≤1 miLoading sold comps…