486 Pleasant Ridge Rd · DeFuniak Springs, FL
Flood risk 1/10 · Minimal
- FEMA flood zone
- X (unshaded)
- Chance of flooding over 30 yrs
- 0.0%
- Est. flood insurance / yr
- $507 – $1,088
Fire risk 4/10 · Minor
- Est. fire insurance / yr
- $947 – $1,759
Heat risk 9/10 · Severe
- Hot days now (above 107°F)
- 7 days/yr
- Hot days in 30 yrs
- 20 days/yr
Wind risk 9/10 · Severe
- Chance of severe wind over 30 yrs
- 99.0%
Air-quality risk 1/10 · Minimal
- Unhealthy air days now
- 0 days/yr
- Unhealthy air days in 30 yrs
- 0 days/yr
Risk factors via First Street. Map © Google.
Why this score? — see what drove the D grade
The composite is a weighted blend of 9 inputs, each scored 0–100. Each bar is that input's sub-score; the figure is the points it added to the 100-point composite (weight × sub-score).
- Appreciation +10.0/10.0
- ARV discount +7.5/15.0
- Cash flow +7.0/30.0
- Schools +5.2/10.0
- Livability +3.2/5.0
- Rent growth +2.5/5.0
- Condition / age +2.5/5.0
- 1% rule +1.9/10.0
- DSCR +1.2/10.0
$159,900
🖨 Deal sheet 📄 Offer letter ✓ Due diligence
Listing remarks
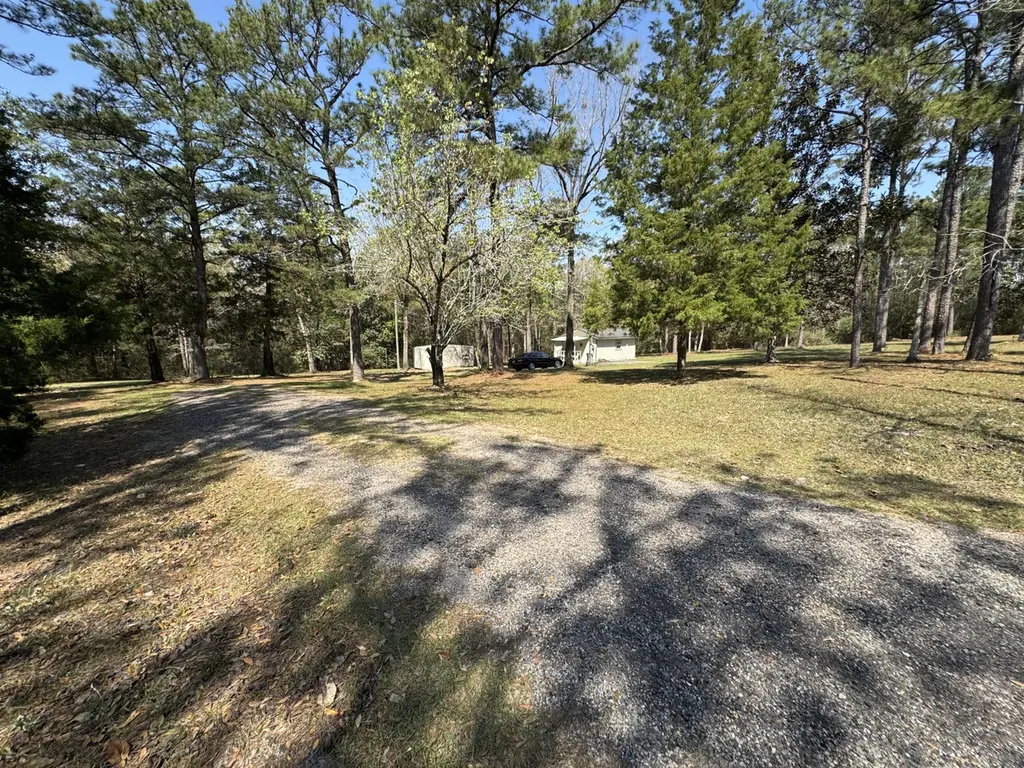
Back on Market, No fault of seller or property. Nestled on a private and beautifully wooded 1.6-acre homesite, this unique property offers the perfect blend of peaceful country living, modern upgrades, and future expansion potential. Surrounded by mature trees that have been professionally thinned and trimmed, the lot provides privacy while still offering ample space to build a primary residence, guest home, or additional structures. This is a charming, small home. The interior showcases a warm and inviting aesthetic, all remodeled recently creating a cozy yet refined living space. Many recent upgrades include new high efficiency hvac split system, new hot water heater A complete list of
Key facts
- Water hookup
- 50-amp power
- Mature trees
Tags
Property features AI
Finance
- HOA & community: No subdivision
Exterior
- Utilities: Electric service; Private well; Septic tank
- Home design: Cabin style; 1 story; Entry and living areas on the first level
- Construction: Shingle roof; Built in 1988
- Exterior features: Covered porch (first level); Cul-de-sac lot; Irregular lot dimensions; City street frontage; Paved road access
Interior
- Kitchen: Microwave; Refrigerator
- Bedrooms: 1 bedroom (first level)
- Bathrooms: 1 full bathroom
- Heating & cooling: High-efficiency AC; Ceiling fans
- Interior features: Partially furnished; Double pane windows; Ceiling fan(s)
- Laundry & utility: Washer; Electric water heater
Neighborhood map
What this means for you Summary
Snapshot
- This is a 1-bed/1.0-bath single-family listed at $160k.
Deal economics
- At list price, monthly cash flow is $-238 ($-3k/yr) — negative.
- To cash-flow at today's rent, offer at most $125k (21.5% below list).
- To meet the 1% rule (rent ≥ 1% of price), the offer needs to be $110k (31.3% below list).
- Recommended offer: $110k (31.3% below list) — sets the bar for 1% rule.
Location & tenants
- Location reads 64/100 on livability (#694 in FL) — a middle-class / working-renter tenant base. Strengths: cost of living A+, housing A+; Watch: health & safety C-, crime D, amenities F.
- Walton (rural): math 62% / reading 61% proficiency, ranked #10 of 73 in FL (top 14%) — acceptable for families but not a draw, mixed tenant base, ~2y average lease.
- Zoned schools: West Defuniak Elementary School (math 67% / reading 57%, grade B, #608 of 2,144 statewide, top 29%, 669 students, 69% FRL); Walton High School (math 52% / reading 53%, grade C-, #154 of 667 statewide, top 24%, 856 students, 65% FRL) — zoned schools average 67% FRL vs 48% district-wide (19 pts higher); higher-poverty schools than district average — tighter screening recommended.
- Market conditions: 122 active listings in the ZIP; 2,883 units permitted in Walton County in 2024 (1,322 in 5+ unit buildings).
Forward outlook
- In year one you build about $17k of equity ($1k loan paydown + $16k appreciation (10.0% local appreciation)).
- Walton County population projected at +46% by 2050 — long-run rental-demand tailwind backs the buy-and-hold thesis.
- By year 3, paydown + projected appreciation supports a ~$43k cash-out refi (75% LTV) — recoverable capital for the next deal without selling this one.
Negotiation context
- It's been on market 63 days — a 6% lower offer ($150k) is reasonable based on typical stale-listing flexibility.
- 2 sale attempts with the ask held roughly flat each time — persistent listings suggest the price (not the market) is what's stuck; bring a comps-based counter.
Risks & watch-outs
- Climate carrying-cost: severe wind risk, 99% chance of damaging wind over 30y; extreme-heat days projected 7→20/yr by 2055 (HVAC capex compounding) — expect insurance premiums to compound above CPI over the hold.
Questions for the listing agent
- What do current leases actually rent for vs. the listed asking? Can we see a recent rent roll and the last 12 months of T-12 income?
- It's been on market 63 days. Have you received any prior offers? Is the seller open to a 31% concession, seller financing, or rate buy-down credit?
- Why hasn't it sold? Are there any deal-killer items the seller is aware of (foundation, flood, title, zoning, code violations)?
- Is there a deadline driving the sale (1031 exchange, divorce, estate, relocation)? That informs how much negotiation room exists.
- Schools are D-rated, which usually means shorter tenancies and higher turnover. Who's the typical renter profile here, and what's been the actual vacancy rate?
- Crime grade is D in this area — have there been break-ins, vandalism, or insurance claims at this property in the last 3 years? What carrier currently insures it and at what premium?
- The area grade is low — what's the realistic commute time and amenity access for the typical tenant pool here? Any planned neighborhood developments (good or bad) we should know about?
- What's the average days-on-market for RENTAL listings here right now (not sales)? A rising rental-DOM trend means longer vacancies and softer asking-rent achievability than the comps imply.
- What's the recent tenant-quality profile in this submarket — average credit score on applications, eviction rate, late-payment / NSF rate, and stable-employment percentage? A property-management company in the area should have these aggregated.
- How much new for-sale + rental construction is in the pipeline within 1–3 miles? Heavy new supply typically softens prices + rents 12–24 months out; constrained supply supports both.
Investment metrics
- 1% rule
- 0.69% ✗
- Cap rate
- 4.51%
- Cash-on-cash
- -6.37%
- DSCR
- 0.72
- GRM
- 12.1
CMA / ARV
No comps found within radius.
Projected returns pro-forma
10.0% appreciation · 3.0% rent growth · sell at horizon
- IRR
- 19.8%
- Equity multiple
- 2.61×
- Total profit
- $71,959
- Equity at exit
- $144,051
- IRR
- 18.1%
- Equity multiple
- 6.00×
- Total profit
- $223,849
- Equity at exit
- $310,651
Cash invested: $44,772 (down + closing). Projections, not guarantees.
Landlord ↔ Tenant lean methodology
- Overall (STATE)
- 87 Strongly Landlord-Friendly
- State Florida
- 87 Strongly Landlord-Friendly · R+3
- County
- — inherits STATE
- City
- — inherits STATE
ZIP-level market 32435
- Home prices YoY
- 4.0%
- Active inventory
- 122
- Price-to-rent
- 12.1×
Monthly cashflow live
- Estimated rent
- $1,098 medium interval (Pro) →
- Mortgage (P&I)
- −$839
- Tax est. 1.5%
- −$200 /mo · $2,398/yr
- Insurance
- −$67
- HOA
- −$0
- Vacancy / Maint / Mgmt
- −$231
- Net cashflow
- $-238
Break-even live
UW: 25.0% down · 7.5% · 30yr · 1.5% tax · 5.0% vac · 8.0% maint · 8.0% mgmt
Financing live
Cash to close
- Down payment
- $39,975
- Closing costs
- $4,797
- Reserves months
- —
- Total cash needed
- —
Loan-product check · same deal, 3 products live
Conventional
25% down · 7.5% · 30yr
- Down + closing
- —
- Monthly P&I
- —
- Monthly cashflow
- —
- DSCR
- —
- Eligible?
- —
Personal DTI + credit; lowest rate.
DSCR
20% down · 8.5% · 30yr
- Down + closing
- —
- Monthly P&I
- —
- Monthly cashflow
- —
- DSCR
- —
- Eligible?
- —
No personal income docs; deal must DSCR.
Hard money
10% down · 12.0% · 12mo
- Down + closing
- —
- Monthly P&I
- —
- Monthly cashflow
- —
- DSCR
- —
- Eligible?
- —
Short-term bridge; refi at stabilization.
Listing history 14 events
-
2026-06-18days on market $159,900 Active 63 DOM
-
2026-06-17days on market $159,900 Active 62 DOM
-
2026-06-16days on market $159,900 Active 61 DOM
-
2026-06-15days on market $159,900 Active 60 DOM
-
2026-06-14days on market $159,900 Active 58 DOM
-
2026-06-13days on market $159,900 Active 57 DOM
-
2026-06-10days on market $159,900 Active 55 DOM
-
2026-06-09days on market $159,900 Active 54 DOM
-
2026-06-08days on market $159,900 Active 53 DOM
-
2026-06-07days on market $159,900 Active 52 DOM
-
2026-06-05status $159,900 Active 49 DOM
-
2026-05-15status Pending
-
2026-05-12status Active
-
2026-03-24$159,900 Active
ⓘ Source: listings_history table (triggers on properties + properties_extension) + one-shot
backfill from property_details.listing_events for pre-trigger history.
Climate risk First Street
- Flood 1/10 Low FEMA zone X (unshaded) · 0% chance over 30 yrs
- Wildfire 4/10 Moderate
- Heat 9/10 Extreme 7 d/yr ≥107°F today · 20 d/yr by 30 yrs out
- Wind 9/10 Extreme 99% chance of damaging wind over 30 yrs
- Air quality 1/10 Low 0 unhealthy d/yr today · 0 by 30 yrs out
Nearby sold comps map
Loading sold comps map…
Walkable amenities ~0.75 mi
Loading nearby amenities…
Taxation est. · year 1
- Rental income
- $13,174
- − Mortgage interest
- −$8,957
- − Property taxes
- −$2,398
- − Insurance
- −$800
- − Repairs & maintenance
- −$1,054
- − Management
- −$1,054
- − Depreciation
- −$4,652
- Taxable loss
- −$5,741
- Est. tax savings @ 24.0%
- +$1,378
- After-tax cash flow
- $-1,475/yr
For passive investors: Depreciation is non-cash, so a rental often shows a tax loss while cash-flowing — sheltering income. Rental losses are passive: they offset passive income freely, and up to $25,000/yr can offset ordinary (W-2) income if you actively participate and your MAGI is under $100k (phasing out to $0 by $150k); unused losses carry forward. On sale, claimed depreciation is recaptured at up to 25%, and gains may owe capital-gains tax (a 1031 exchange can defer both). Figures are a year-1 estimate at your 24.0% rate — not tax advice; consult a CPA.
Schools (NCES district)
- District
- Walton
- NCES district ID
- 1201980
- Math proficiency
- 62% ▼ -4.00%
- Reading proficiency
- 61% ▼ -2.00%
- Median HH income
- $46,794
- Composite
- 52.03/100
- National rank
- #1634
- State rank
- #10 of 73 in FL
Livability — DeFuniak Springs
- Score
- 64/100
- State rank
- #694
- US rank
- #14475
Category grades
Schools grade is shown separately in the Schools card above.
Census & demographics
- City population
- 19,746
- Population (ZIP)
- 6,359
Population outlook (Walton County) Hauer SSP2
- Today (2025)
- 80,014 people
- By 2030
- 88,120 · +10.1%
- By 2040
- 103,537 · +29.4%
- By 2050
- 117,034 · +46.3%
- By 2075
- 143,901 · +79.8%
- By 2100
- 155,138 · +93.9%
Race, ethnicity, and origin ACS 2023
- Neighborhood character
- Predominantly White (83%)
- Race & ethnicity
- White 83% Black 6% Two or more races 6% Hispanic / Latino 4%
- Common ancestry
- Slovak 5% Scottish 2% Serbian 1%
- Foreign-born
- 3% · Canada
- Languages at home
- 97% English-only · Spanish 2%
Political lean MEDSL · Walton
- 2024 margin
- Solid R (+57.8) · D 20.7% · R 78.6%
- 2008→2024 swing
- -12.0pp toward R · 2008: -45.8pp · 2024: -57.8pp
- All cycles
- 2024: R+57.8 2020: R+51.7 2016: R+56.1 2012: R+52.0 2008: R+45.8
Not yet ingested
- Civics
- —
Market trends
- HPI YoY
- ▲ 12.25%
- Current HPI
- 314.8146
- Rent YoY
- —
- Metro
- —
- State GDP YoY
- ▲ 3.28%
- F500 in state
- 36
Industry mix (Fortune 500 HQ in FL)
| Industry | F500 HQs | Revenue |
|---|---|---|
| Industrial Technology | 2 | $29B |
|
||
| Insurance | 2 | $17B |
|
||
| Retail | 1 | $60B |
|
||
| Technology Distribution | 1 | $58B |
|
||
| Homebuilding | 1 | $35B |
|
||
| Technology Manufacturing | 1 | $35B |
|
||
Price history
3 events — show timeline
- 2026-05-15 Pending — ECAR
- 2026-05-12 Relisted — ECAR
- 2026-03-24 Listed $159,900 ECAR
Cash-flow waterfall
monthlySold comps — $/sqft
last 12 mo · ≤1 miLoading sold comps…