 Multi-family
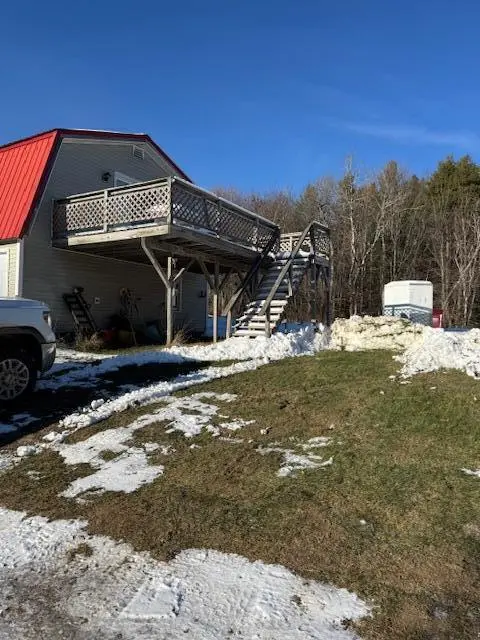
296 Laing Hill Rd · Palmyra, ME
Flood risk No data
- FEMA flood zone
- —
- Chance of flooding over 30 yrs
- —
- Est. flood insurance / yr
- —
Fire risk No data
- Est. fire insurance / yr
- —
Heat risk No data
- Hot days now (above threshold)
- —
- Hot days in 30 yrs
- —
Wind risk No data
- Chance of severe wind over 30 yrs
- —
Air-quality risk No data
- Unhealthy air days now
- —
- Unhealthy air days in 30 yrs
- —
Risk factors via First Street. Map © Google.
Why this score? — see what drove the B grade
The composite is a weighted blend of 9 inputs, each scored 0–100. Each bar is that input's sub-score; the figure is the points it added to the 100-point composite (weight × sub-score).
- Cash flow +27.0/30.0
- DSCR +9.3/10.0
- Appreciation +8.1/10.0
- ARV discount +7.5/15.0
- 1% rule +6.7/10.0
- Schools +6.4/10.0
- Rent growth +2.5/5.0
- Livability +2.5/5.0
- Condition / age +2.5/5.0
$159,000
🖨 Deal sheet 📄 Offer letter ✓ Due diligence
Multi-family units
County records classify this as Multi-Family (2-4 Unit). Listing-text estimate: 1 unit. estimate disagrees with records
Listing remarks MLS
Looking for a home with lots of garage space, and room for all your toys? this Gambrel one bedroom home offers easy living, with lots of storage. You could even finish off the garage downstairs if you wanted more living space.
Key facts
- Lots of storage
- 1.06 acre lot
- 4 garage spots
Tags
Neighborhood map
What this means for you Summary
Snapshot
- This is a 1-bed/1.0-bath multifamily listed at $159k.
Deal economics
- At list price, monthly cash flow is $444 ($5k/yr) — positive.
- The deal already cash-flows at list — no discount required.
- Meets the 1% rule at list price ($2k rent vs $159k).
- Recommended offer: $140k (12.0% below list) — sets the bar for market timing.
Location & tenants
- Location reads: area grade B — affects rentability + tenant quality, not the cash-flow math above.
- RSU 19 (rural): math 73% / reading 81% proficiency, ranked #96 of 112 in ME (top 86%) — strong family-tenant draw, lease renewals of 3-5y typical.
- Market conditions: 16 active listings in the ZIP; 129 units permitted in Somerset County in 2024 (0 in 5+ unit buildings).
Forward outlook
- In year one you build about $11k of equity ($1k loan paydown + $10k appreciation (6.1% local appreciation)).
- Somerset County population projected at -25% by 2050 — secular population decline; favor cash flow + early exit over multi-decade hold.
- At projected returns (6.1% appreciation + 3.0% rent growth), your $45k cash investment doubles in ~3 years — after that, you're playing with house money.
- By year 4, paydown + projected appreciation supports a ~$37k cash-out refi (75% LTV) — recoverable capital for the next deal without selling this one.
Negotiation context
- It's been on market 169 days — a 12% lower offer ($140k) is reasonable based on typical stale-listing flexibility.
Questions for the listing agent
- It's been on market 169 days. Have you received any prior offers? Is the seller open to a 12% concession, seller financing, or rate buy-down credit?
- Built in 1978 — when were the roof, HVAC, electrical panel, plumbing, and water heater last replaced?
- Why hasn't it sold? Are there any deal-killer items the seller is aware of (foundation, flood, title, zoning, code violations)?
- Is there a deadline driving the sale (1031 exchange, divorce, estate, relocation)? That informs how much negotiation room exists.
- What's the average days-on-market for RENTAL listings here right now (not sales)? A rising rental-DOM trend means longer vacancies and softer asking-rent achievability than the comps imply.
- What's the recent tenant-quality profile in this submarket — average credit score on applications, eviction rate, late-payment / NSF rate, and stable-employment percentage? A property-management company in the area should have these aggregated.
- How much new apartment / multifamily construction is in the pipeline within 1–3 miles? Heavy new supply (>2% of stock underway) typically softens rents 12–24 months out; light construction supports rent growth.
Investment metrics
- 1% rule
- 1.17% ✓
- Cap rate
- 9.64%
- Cash-on-cash
- 11.97%
- DSCR
- 1.53
- GRM
- 7.1
CMA / ARV
- ARV (median comp)
- $322,662
- List price
- $159,000
- Delta
- -50.72%
- Verdict
- UNDERPRICED
- Comps
- 2 within 1.0 mi
Projected returns pro-forma
6.14% appreciation · 3.0% rent growth · sell at horizon
- IRR
- 25.6%
- Equity multiple
- 2.70×
- Total profit
- $75,512
- Equity at exit
- $101,391
- IRR
- 24.0%
- Equity multiple
- 5.48×
- Total profit
- $199,584
- Equity at exit
- $185,120
Cash invested: $44,520 (down + closing). Projections, not guarantees.
Landlord ↔ Tenant lean methodology
- Overall (STATE)
- 41 Moderately Tenant-Leaning
- State Maine
- 41 Moderately Tenant-Leaning · D+2
- County
- — inherits STATE
- City
- — inherits STATE
ZIP-level market 04965
- Home prices YoY
- 2.7%
- Active inventory
- 16
- Price-to-rent
- 14.3×
Monthly cashflow live
- Estimated rent
- $1,854 medium interval (Pro) →
- Mortgage (P&I)
- −$834
- Tax from tax record
- −$121 /mo · $1,448/yr
- Insurance
- −$66
- HOA
- −$0
- Vacancy / Maint / Mgmt
- −$389
- Net cashflow
- $444
Break-even live
2-unit breakdown (identical units grouped — click to expand)
| Units | Beds | Baths | Est. rent |
|---|---|---|---|
| 2× units | 1 | 1 | $1,854 |
| #1 | 1 | 1 | $927 |
| #2 | 1 | 1 | $927 |
| Total (2 units) | $1,854 | ||
UW: 25.0% down · 7.5% · 30yr · 1.5% tax · 5.0% vac · 8.0% maint · 8.0% mgmt
Financing live
Cash to close
- Down payment
- $39,750
- Closing costs
- $4,770
- Reserves months
- —
- Total cash needed
- —
Loan-product check · same deal, 3 products live
Conventional
25% down · 7.5% · 30yr
- Down + closing
- —
- Monthly P&I
- —
- Monthly cashflow
- —
- DSCR
- —
- Eligible?
- —
Personal DTI + credit; lowest rate.
DSCR
20% down · 8.5% · 30yr
- Down + closing
- —
- Monthly P&I
- —
- Monthly cashflow
- —
- DSCR
- —
- Eligible?
- —
No personal income docs; deal must DSCR.
Hard money
10% down · 12.0% · 12mo
- Down + closing
- —
- Monthly P&I
- —
- Monthly cashflow
- —
- DSCR
- —
- Eligible?
- —
Short-term bridge; refi at stabilization.
Listing history 18 events
-
2026-06-18days on market $159,000 Active 169 DOM
-
2026-06-17days on market $159,000 Active 168 DOM
-
2026-06-16days on market $159,000 Active 167 DOM
-
2026-06-15days on market $159,000 Active 166 DOM
-
2026-06-14days on market $159,000 Active 164 DOM
-
2026-06-13days on market $159,000 Active 163 DOM
-
2026-06-10days on market $159,000 Active 161 DOM
-
2026-06-09days on market $159,000 Active 160 DOM
-
2026-06-08days on market $159,000 Active 159 DOM
-
2026-06-07days on market $159,000 Active 158 DOM
-
2026-06-05pricedays on market $159,000 Active 155 DOM
-
2026-06-03days on market $174,900 Active 154 DOM
-
2026-06-02days on market $174,900 Active 153 DOM
-
2026-06-01days on market $174,900 Active 152 DOM
-
2026-05-31days on market $174,900 Active 151 DOM
-
2026-05-30days on market $174,900 Active 150 DOM
-
2026-04-17price $174,900 226-char remark
Show marketing remark (226 chars)
Looking for a home with lots of garage space, and room for all your toys? this Gambrel one bedroom home offers easy living, with lots of storage. You could even finish off the garage downstairs if you wanted more living space.
-
2025-12-31$189,900 Active 226-char remark
Show marketing remark (226 chars)
Looking for a home with lots of garage space, and room for all your toys? this Gambrel one bedroom home offers easy living, with lots of storage. You could even finish off the garage downstairs if you wanted more living space.
ⓘ Source: listings_history table (triggers on properties + properties_extension) + one-shot
backfill from property_details.listing_events for pre-trigger history.
Tax reassessment forecast ME · Partial reset (capped growth)
- Current annual tax
- $1,448 · $121/mo
- Projected year-2 tax
- $1,805 · $150/mo
- Expected delta
- +$357/yr (+$30/mo · 24.7%)
ⓘ Screening estimate from a state-policy table — verify with the county assessor before closing.
Nearby sold comps map
Loading sold comps map…
Walkable amenities ~0.75 mi
Loading nearby amenities…
Taxation est. · year 1
- Rental income
- $22,248
- − Mortgage interest
- −$8,906
- − Property taxes
- −$1,448
- − Insurance
- −$795
- − Repairs & maintenance
- −$1,780
- − Management
- −$1,780
- − Depreciation
- −$4,625
- Taxable income
- $2,913
- Est. tax owed @ 24.0%
- −$699
- After-tax cash flow
- $4,628/yr
For passive investors: Depreciation is non-cash, so a rental often shows a tax loss while cash-flowing — sheltering income. Rental losses are passive: they offset passive income freely, and up to $25,000/yr can offset ordinary (W-2) income if you actively participate and your MAGI is under $100k (phasing out to $0 by $150k); unused losses carry forward. On sale, claimed depreciation is recaptured at up to 25%, and gains may owe capital-gains tax (a 1031 exchange can defer both). Figures are a year-1 estimate at your 24.0% rate — not tax advice; consult a CPA.
Schools (NCES district)
- District
- RSU 19
- NCES district ID
- 2314785
- Math proficiency
- 73% ▲ 53.00%
- Reading proficiency
- 81% ▲ 39.00%
- Median HH income
- $41,866
- Composite
- 64.37/100
- National rank
- #548
- State rank
- #96 of 112 in ME
Livability — Palmyra
No livability data for this city. (Only ~50 U.S. cities are tracked.)
Census & demographics
- Population (ZIP)
- 2,150
Population outlook (Somerset County) Hauer SSP2
- Today (2025)
- 48,335 people
- By 2030
- 46,268 · -4.3%
- By 2040
- 41,276 · -14.6%
- By 2050
- 36,137 · -25.2%
- By 2075
- 26,408 · -45.4%
- By 2100
- 18,836 · -61.0%
Race, ethnicity, and origin ACS 2023
- Neighborhood character
- Predominantly White (99%)
- Race & ethnicity
- White 99%
- Common ancestry
- Lithuanian 9% Romanian 2% Portuguese 1%
- Foreign-born
- 2%
Political lean MEDSL · Somerset
- 2024 margin
- Strong R (+27.1) · D 35.6% · R 62.7% · Other 1.7%
- 2008→2024 swing
- -32.8pp toward R · 2008: 5.7pp · 2024: -27.1pp
- All cycles
- 2024: R+27.1 2020: R+23.4 2016: R+22.8 2012: D+1.7 2008: D+5.7
Not yet ingested
- Civics
- —
Market trends
- HPI YoY
- ▲ 6.14%
- Current HPI
- 230.6987
- Rent YoY
- —
- Metro
- —
- State GDP YoY
- —
- F500 in state
- 0
Price history
-7.9% since first listed2 events — show timeline
- 2026-04-17 Price Changed $174,900 MREIS
- 2025-12-31 Listed $189,900 MREIS
Property tax history
+2.8%/yrLatest (2025): $1,448 · +8.1% YoY. Source: county tax records.
Cash-flow waterfall
monthlySold comps — $/sqft
last 12 mo · ≤1 miLoading sold comps…