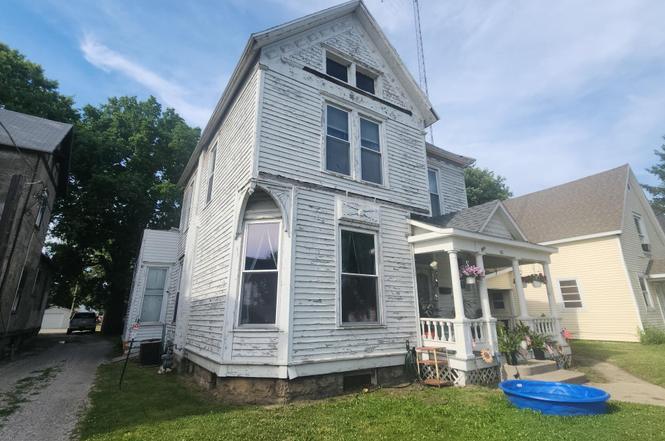
514 W Market St · Logansport, IN
Flood risk 9/10 · Severe
- FEMA flood zone
- X (shaded)
- Chance of flooding over 30 yrs
- 0.99%
- Est. flood insurance / yr
- $473 – $860
Fire risk 1/10 · Minimal
- Est. fire insurance / yr
- $717 – $1,331
Heat risk 3/10 · Minor
- Hot days now (above 102°F)
- 7 days/yr
- Hot days in 30 yrs
- 17 days/yr
Wind risk 2/10 · Minimal
- Chance of severe wind over 30 yrs
- —
Air-quality risk 2/10 · Minimal
- Unhealthy air days now
- 1 days/yr
- Unhealthy air days in 30 yrs
- 2 days/yr
Risk factors via First Street. Map © Google.
Why this score? — see what drove the B+ grade
The composite is a weighted blend of 9 inputs, each scored 0–100. Each bar is that input's sub-score; the figure is the points it added to the 100-point composite (weight × sub-score).
- Cash flow +30.0/30.0
- ARV discount +15.0/15.0
- 1% rule +10.0/10.0
- DSCR +10.0/10.0
- Livability +3.9/5.0
- Rent growth +2.5/5.0
- Condition / age +2.5/5.0
- Schools +2.4/10.0
- Appreciation +0.0/10.0
$89,900
🖨 Deal sheet 📄 Offer letter ✓ Due diligence
Listing remarks
This home has some beautiful old wood work. Covered front porch. Close to school and restaurants. Large rooms. As-is sales only. One room Downstairs is being used as a 4th bedroom.
Key facts
- Covered front porch
- Close to school
- Close to restaurants
Tags
Property features AI
Finance
- Other: Directions: West on Broadway, cross the bridge onto Market; home is on the north side
- Financial info: Annual taxes noted (amount withheld from detailed display)
- HOA & community: No HOA information provided
Exterior
- Parking: Parking information not provided
- Security: Security information not provided
- Utilities: Public water; Public sewer
- Home design: Single-family residence (site-built); 2 stories
- Construction: Wood siding; Above-grade finished area approximately 2,004; Basement present (partial, unfinished)
- Exterior features: Lot dimensions approximately 45 x 165; Lot size about 0.1 acre
Interior
- Kitchen: No appliances listed
- Bedrooms: Bedrooms information not provided
- Flooring: Flooring information not provided
- Bathrooms: 2 full bathrooms; 1 bathroom on the main level
- Heating & cooling: Central air conditioning; Forced air heating
- Interior features: Partial, unfinished basement; Total of 8 rooms
- Laundry & utility: Laundry located on the main level
Neighborhood map
What this means for you Summary
Snapshot
- This is a 3-bed/1.0-bath single-family listed at $90k.
Deal economics
- At list price, monthly cash flow is $384 ($5k/yr) — positive.
- The deal already cash-flows at list — no discount required.
- Meets the 1% rule at list price ($1k rent vs $90k).
- Cap rate 12.2% vs local median 4.4% in Logansport — top-decile yield for the area; either an underpriced asset or a hidden risk that comps aren't pricing in. Stress-test before assuming the spread holds.
Location & tenants
- Location reads 78/100 on livability (#34 in IN, #2,683 nationally) — a middle-class / working-renter tenant base. Strengths: crime A+, amenities A+, cost of living A+; Watch: commute F, employment D-.
- Logansport Community School Corporation (town): math 26% / reading 32% proficiency, ranked #252 of 301 in IN (top 84%) — low school quality limits family demand, transient renter base, plan for 1-2y turnover.
- Zoned schools: Franklin Elementary School (math 27% / reading 17%, grade F, #790 of 994 statewide, top 81%, 335 students, 72% FRL); Logansport Junior High School (math 17% / reading 30%, grade F, #257 of 330 statewide, top 79%, 607 students, 67% FRL); Logansport Community High School (math 24% / reading 46%, grade F, #266 of 369 statewide, top 73%, 1,224 students, 62% FRL) — zoned schools average 67% FRL vs 50% district-wide (16 pts higher); higher-poverty schools than district average — tighter screening recommended.
- Market conditions: 129 active listings in the ZIP; 22 units permitted in Cass County in 2024 (0 in 5+ unit buildings).
Forward outlook
- Local home prices are declining (-3.0%/yr); year-one equity from $622 of loan paydown is wiped out by about $3k of value loss. Plan a longer hold.
- Cass County population projected at -16% by 2050 — secular population decline; favor cash flow + early exit over multi-decade hold.
- At projected returns (-3.0% appreciation + 3.0% rent growth), your $25k cash investment doubles in ~7 years — after that, you're playing with house money.
Negotiation context
- Only 3 days on market — expect competitive offers; lowballing is unlikely to land.
Risks & watch-outs
- Watch-outs: flood insurance adds $56/mo; built in 1900 — expect roof / HVAC / electrical / plumbing capex.
- Climate carrying-cost: severe flood risk — expect insurance premiums to compound above CPI over the hold.
Questions for the listing agent
- Built in 1900 — when were the roof, HVAC, electrical panel, plumbing, and water heater last replaced?
- What's the actual annual flood-insurance premium (NFIP or private), and is the property in a SFHA with mandatory coverage?
- Is there a deadline driving the sale (1031 exchange, divorce, estate, relocation)? That informs how much negotiation room exists.
- Schools are F-rated, which usually means shorter tenancies and higher turnover. Who's the typical renter profile here, and what's been the actual vacancy rate?
- What's the average days-on-market for RENTAL listings here right now (not sales)? A rising rental-DOM trend means longer vacancies and softer asking-rent achievability than the comps imply.
- What's the recent tenant-quality profile in this submarket — average credit score on applications, eviction rate, late-payment / NSF rate, and stable-employment percentage? A property-management company in the area should have these aggregated.
- How much new for-sale + rental construction is in the pipeline within 1–3 miles? Heavy new supply typically softens prices + rents 12–24 months out; constrained supply supports both.
Investment metrics
- 1% rule
- 1.50% ✓
- Cap rate
- 12.15%
- Cash-on-cash
- 20.93%
- DSCR
- 1.93
- GRM
- 5.6
CMA / ARV
- ARV (on-the-fly)
- $146,292
- Comps found
- 12
Show comp detail 12 sales within ~0.75 mi
| Address | Dist | Beds/Ba | Sqft | Sold | Price | $/sf | Match |
|---|---|---|---|---|---|---|---|
| 363 W Broadway St | 0.13mi | 4/1.5 (+1) | 2,028 (+1%) | 8mo | $149,900 | $74 | 78 |
| 325 Wheatland Ave | 0.21mi | 3/1.0 | 1,876 (-6%) | 6mo | $55,000 | $29 | 74 |
| 514 W Linden Ave | 0.22mi | 3/2.0 | 1,872 (-7%) | 5mo | $110,000 | $59 | 71 |
| 506 Howard St | 0.46mi | 4/2.0 (+1) | 1,990 (-1%) | 4mo | $235,000 | $118 | 65 |
| 424 W Broadway St | 0.09mi | 4/1.5 (+1) | 2,288 (+14%) | 7mo | $115,000 | $50 | 59 |
| 315 Grove St | 0.49mi | 4/1.0 (+1) | 2,112 (+5%) | 7mo | $149,000 | $71 | 57 |
| 201 Tacoma Ave | 0.46mi | 4/2.5 (+1) | 2,112 (+5%) | 2mo | $134,300 | $64 | 57 |
| 316-318 Grove St | 0.51mi | 3/1.5 | 1,800 (-10%) | 1mo | $45,000 | $25 | 56 |
| 211 W Miami Ave | 0.37mi | 4/2.0 (+1) | 1,780 (-11%) | 0mo | $130,000 | $73 | 55 |
| 31 Park Ave | 0.46mi | 4/1.5 (+1) | 1,752 (-13%) | 2mo | $199,900 | $114 | 49 |
| 4096 N 425 E | 0.60mi | 3/2.0 | 1,820 (-9%) | 8mo | $160,000 | $88 | 46 |
| 305 Tanguy St | 0.54mi | 4/2.0 (+1) | 1,752 (-13%) | 3mo | $152,000 | $87 | 42 |
Match score weights: distance 35% · size 25% · config 20% · recency 20%. Top-matched comps best support the ARV.
Projected returns pro-forma
-3.0% appreciation · 3.0% rent growth · sell at horizon
- IRR
- 10.0%
- Equity multiple
- 1.39×
- Total profit
- $9,914
- Equity at exit
- $13,404
- IRR
- 19.1%
- Equity multiple
- 2.60×
- Total profit
- $40,313
- Equity at exit
- $7,773
Cash invested: $25,172 (down + closing). Projections, not guarantees.
Landlord ↔ Tenant lean methodology
- Overall (STATE)
- 90 Strongly Landlord-Friendly
- State Indiana
- 90 Strongly Landlord-Friendly · R+11
- County
- — inherits STATE
- City
- — inherits STATE
ZIP-level market 46947
- Home prices YoY
- -28.9%
- Active inventory
- 129
- Price-to-rent
- 5.6×
Monthly cashflow live
- Estimated rent
- $1,346 medium interval (Pro) →
- Mortgage (P&I)
- −$471
- Tax from tax record
- −$115 /mo · $1,380/yr
- Insurance
- −$37
- Flood insurance flood zone
- −$56 /mo · $666/yr
- HOA
- −$0
- Vacancy / Maint / Mgmt
- −$283
- Net cashflow
- $384
Break-even live
UW: 25.0% down · 7.5% · 30yr · 1.5% tax · 5.0% vac · 8.0% maint · 8.0% mgmt
Financing live
Cash to close
- Down payment
- $22,475
- Closing costs
- $2,697
- Reserves months
- —
- Total cash needed
- —
Loan-product check · same deal, 3 products live
Conventional
25% down · 7.5% · 30yr
- Down + closing
- —
- Monthly P&I
- —
- Monthly cashflow
- —
- DSCR
- —
- Eligible?
- —
Personal DTI + credit; lowest rate.
DSCR
20% down · 8.5% · 30yr
- Down + closing
- —
- Monthly P&I
- —
- Monthly cashflow
- —
- DSCR
- —
- Eligible?
- —
No personal income docs; deal must DSCR.
Hard money
10% down · 12.0% · 12mo
- Down + closing
- —
- Monthly P&I
- —
- Monthly cashflow
- —
- DSCR
- —
- Eligible?
- —
Short-term bridge; refi at stabilization.
Listing history 4 events
-
2026-06-18days on market $89,900 Active 3 DOM
-
2026-06-17days on market $89,900 Active 2 DOM
-
2026-06-16remarks 180-char remark
-
2026-06-16$89,900 Active 1 DOM
ⓘ Source: listings_history table (triggers on properties + properties_extension) + one-shot
backfill from property_details.listing_events for pre-trigger history.
Tax reassessment forecast IN · Partial reset (capped growth)
- Current annual tax
- $1,380 · $115/mo
- Projected year-2 tax
- $1,380 · $115/mo
- Expected delta
- $0/yr ($0/mo · 0.0%)
ⓘ Screening estimate from a state-policy table — verify with the county assessor before closing.
Climate risk First Street
- Flood 9/10 Extreme FEMA zone X (shaded) · 99% chance over 30 yrs
- Wildfire 1/10 Low
- Heat 3/10 Moderate 7 d/yr ≥102°F today · 17 d/yr by 30 yrs out
- Wind 2/10 Low
- Air quality 2/10 Low 1 unhealthy d/yr today · 2 by 30 yrs out
Nearby sold comps map
Loading sold comps map…
Walkable amenities ~0.75 mi
Loading nearby amenities…
Taxation est. · year 1
- Rental income
- $16,146
- − Mortgage interest
- −$5,036
- − Property taxes
- −$1,380
- − Insurance
- −$1,116
- − Repairs & maintenance
- −$1,292
- − Management
- −$1,292
- − Depreciation
- −$2,615
- Taxable income
- $3,416
- Est. tax owed @ 24.0%
- −$820
- After-tax cash flow
- $3,782/yr
For passive investors: Depreciation is non-cash, so a rental often shows a tax loss while cash-flowing — sheltering income. Rental losses are passive: they offset passive income freely, and up to $25,000/yr can offset ordinary (W-2) income if you actively participate and your MAGI is under $100k (phasing out to $0 by $150k); unused losses carry forward. On sale, claimed depreciation is recaptured at up to 25%, and gains may owe capital-gains tax (a 1031 exchange can defer both). Figures are a year-1 estimate at your 24.0% rate — not tax advice; consult a CPA.
Schools (NCES district)
- District
- Logansport Community School Corporation
- NCES district ID
- 1806030
- Math proficiency
- 26% ▼ -10.00%
- Reading proficiency
- 32% ▼ -7.00%
- Median HH income
- $37,767
- Composite
- 24.19/100
- National rank
- #7733
- State rank
- #252 of 301 in IN
Livability — Logansport
- Score
- 78/100
- State rank
- #34
- US rank
- #2683
Category grades
Schools grade is shown separately in the Schools card above.
Census & demographics
- Census place
- Logansport, IN
- City population
- 28,830
- Population (ZIP)
- 28,830
Population outlook (Cass County) Hauer SSP2
- Today (2025)
- 36,480 people
- By 2030
- 35,390 · -3.0%
- By 2040
- 33,077 · -9.3%
- By 2050
- 30,631 · -16.0%
- By 2075
- 25,426 · -30.3%
- By 2100
- 20,617 · -43.5%
Race, ethnicity, and origin ACS 2023
- Neighborhood character
- Predominantly White (70%)
- Race & ethnicity
- White 70% Hispanic / Latino 22% Two or more races 8% Asian 2% Black 1%
- Hispanic origin (detail)
- Mexican 13%
- Common ancestry
- Italian 2% Iranian 1% Lithuanian 1%
- Foreign-born
- 12% · Canada, China
- Languages at home
- 80% English-only · Spanish 17% French/Haitian/Cajun 1% Other Asian/Pacific 1%
Political lean MEDSL · Cass
- 2024 margin
- Solid R (+46.2) · D 26.2% · R 72.4% · Other 1.4%
- 2008→2024 swing
- -37.7pp toward R · 2008: -8.5pp · 2024: -46.2pp
- All cycles
- 2024: R+46.2 2020: R+41.1 2016: R+42.0 2012: R+21.7 2008: R+8.5
Not yet ingested
- Civics
- —
Market trends
- HPI YoY
- ▼ -91.21%
- Current HPI
- 223.8394
- Rent YoY
- —
- Metro
- —
- State GDP YoY
- ▲ 2.90%
- F500 in state
- 18
Industry mix (Fortune 500 HQ in IN)
| Industry | F500 HQs | Revenue |
|---|---|---|
| Industrial Machinery | 2 | $37B |
|
||
| Healthcare | 1 | $177B |
|
||
| Pharmaceuticals | 1 | $45B |
|
||
| Metals / Steel | 1 | $18B |
|
||
| Agriculture | 1 | $17B |
|
||
| Packaging | 1 | $12B |
|
||
Price history
1 event — show timeline
- 2026-06-15 Listed $89,900 IRMLS
Property tax history
-5.9%/yrLatest (2024): $1,380 · +11.3% YoY. Source: county tax records.
Cash-flow waterfall
monthlySold comps — $/sqft
last 12 mo · ≤1 miLoading sold comps…