85 Saint Andrews Blvd Unit C306 · Lely, FL
Flood risk 9/10 · Severe
- FEMA flood zone
- AE
- Chance of flooding over 30 yrs
- 0.99%
- Est. flood insurance / yr
- $1,737 – $8,500
Fire risk 4/10 · Minor
- Est. fire insurance / yr
- $947 – $1,759
Heat risk 10/10 · Severe
- Hot days now (above 107°F)
- 7 days/yr
- Hot days in 30 yrs
- 27 days/yr
Wind risk 10/10 · Severe
- Chance of severe wind over 30 yrs
- 99.0%
Air-quality risk 2/10 · Minimal
- Unhealthy air days now
- 2 days/yr
- Unhealthy air days in 30 yrs
- 2 days/yr
Risk factors via First Street. Map © Google.
Why this score? — see what drove the B grade
The composite is a weighted blend of 9 inputs, each scored 0–100. Each bar is that input's sub-score; the figure is the points it added to the 100-point composite (weight × sub-score).
- Cash flow +30.0/30.0
- 1% rule +10.0/10.0
- DSCR +10.0/10.0
- ARV discount +7.5/15.0
- Schools +5.0/10.0
- Rent growth +3.9/5.0
- Condition / age +3.8/5.0
- Livability +3.3/5.0
- Appreciation +0.0/10.0
$160,000
🖨 Deal sheet 📄 Offer letter ✓ Due diligence
Listing remarks
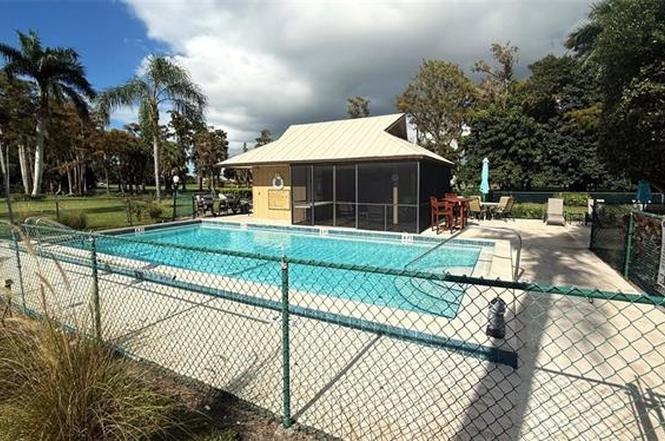
WOW, CAN YOU BELIEVE THIS PRICE? This bright and welcoming third-floor condo offers the perfect blend of comfort, convenience, and worry-free living. Featuring 2 spacious bedrooms and 2 full bathrooms, the home enjoys an elevated vantage point with lovely views of the community pool and the neighboring golf course. The building includes a common elevator for easy access, and the unit comes with its own assigned carport and extra storage. Residents can relax at the sparkling community pool or take advantage of the prime location—just minutes from a variety of shopping and dining options AND AN AMAZING PRICE!! With its desirable setting, great LOCATION and thoughtful amenities, this
Key facts
- Community pool
- Golf course view
- Screened lanai
Tags
Property features AI
Finance
- Other: Part of a complex with 39 units (15 units in building), 1 floor, 3 units per floor; Possession subject to lease; Restrictions: Deeded, no commercial, no RV
- HOA & community: Quarterly condo fee (total annual recurring fees listed); Professional management; Community amenities include bike storage, community pool, extra storage, and sidewalks; Maintenance covers irrigation water, lawn/land maintenance, manager, exterior pest control, reserves, sewer, trash removal, and water; Community type: Condo/Hotel
Exterior
- Parking: 1 assigned parking space; Guest parking; Detached 1-car carport
- Utilities: Water assessment paid; Sewer assessment paid; Cable available
- Home design: Residential property in a low-rise (1-3) Florida-style building; Built in 1980; Rear exposure faces northeast; Located in Lely Golf Estates (Cypress Gate)
- Construction: Concrete block construction; Metal and shingle roof
- Exterior features: Stucco exterior; Single-hung windows; Views of golf course, landscaped areas, and community pool; Paved public road access; Zero lot line
Interior
- Kitchen: Pantry; Range; Refrigerator
- Bedrooms: 2 bedrooms with a split-bedroom floor plan
- Flooring: Carpet; Laminate; Tile
- Bathrooms: 2 full bathrooms; Master bathroom with shower (no tub)
- Heating & cooling: Central electric heating; Central electric cooling
- Interior features: High speed internet available; Smoke detectors; Common elevator
- Laundry & utility: Washer; Dryer
Neighborhood map
What this means for you Summary
Snapshot
- This is a 2-bed/2.0-bath condo listed at $160k. Condition is rated good.
Deal economics
- At list price, monthly cash flow is $477 ($6k/yr) — positive.
- The deal already cash-flows at list — no discount required.
- Meets the 1% rule at list price ($3k rent vs $160k).
- Recommended offer: $141k (12.0% below list) — sets the bar for market timing.
Location & tenants
- Location reads 66/100 on livability (#586 in FL) — a middle-class / working-renter tenant base. Strengths: crime A+, housing A+; Watch: schools D+, health & safety D, amenities F.
- Collier (suburban): math 60% / reading 56% proficiency, ranked #16 of 73 in FL (top 22%) — acceptable for families but not a draw, mixed tenant base, ~2y average lease.
- Market conditions: Rents rising fast (+5.6%/yr); 597 active listings in the ZIP; 40 comparable units currently listed for rent nearby; rentals at typical pace (median 24d on market — plan ~3-4 weeks tenant-placement turnaround); solid renter incomes; 3,520 units permitted in Collier County in 2024 (959 in 5+ unit buildings).
- At $3,410/mo this rent would consume 50% of the median local household income ($82k/yr) (locally 954% of renters already pay >50% of income on rent) — very limited rent-growth headroom before tenants either downsize or default.
Forward outlook
- Local home prices are declining (-3.0%/yr); year-one equity from $1k of loan paydown is wiped out by about $5k of value loss. Plan a longer hold.
- Collier County population projected at +30% by 2050 — long-run rental-demand tailwind backs the buy-and-hold thesis.
- At projected returns (-3.0% appreciation + 5.6% rent growth), your $45k cash investment doubles in ~7 years — after that, you're playing with house money.
Negotiation context
- It's been on market 182 days — a 12% lower offer ($141k) is reasonable based on typical stale-listing flexibility.
Risks & watch-outs
- Watch-outs: flood insurance adds $427/mo; HOA is 20% of rent.
- Climate carrying-cost: in FEMA flood zone AE (mandatory federal flood insurance); severe wind risk, 99% chance of damaging wind over 30y; extreme-heat days projected 7→27/yr by 2055 (HVAC capex compounding) — expect insurance premiums to compound above CPI over the hold.
Questions for the listing agent
- It's been on market 182 days. Have you received any prior offers? Is the seller open to a 12% concession, seller financing, or rate buy-down credit?
- What's the actual annual flood-insurance premium (NFIP or private), and is the property in a SFHA with mandatory coverage?
- What does the HOA fee cover, when was the last increase, and are there any pending special assessments or reserve-fund shortfalls?
- Any open or pending special assessments — roof, HVAC, plumbing, elevator, façade? What's the per-unit balance and payoff schedule, and is the seller paying it off at close or rolling it to the buyer?
- Why hasn't it sold? Are there any deal-killer items the seller is aware of (foundation, flood, title, zoning, code violations)?
- Is there a deadline driving the sale (1031 exchange, divorce, estate, relocation)? That informs how much negotiation room exists.
- Schools are D-rated, which usually means shorter tenancies and higher turnover. Who's the typical renter profile here, and what's been the actual vacancy rate?
- What's the average days-on-market for RENTAL listings here right now (not sales)? A rising rental-DOM trend means longer vacancies and softer asking-rent achievability than the comps imply.
- What's the recent tenant-quality profile in this submarket — average credit score on applications, eviction rate, late-payment / NSF rate, and stable-employment percentage? A property-management company in the area should have these aggregated.
- How much new apartment / multifamily construction is in the pipeline within 1–3 miles? Heavy new supply (>2% of stock underway) typically softens rents 12–24 months out; light construction supports rent growth.
Investment metrics
- 1% rule
- 2.13% ✓
- Cap rate
- 13.07%
- Cash-on-cash
- 24.21%
- DSCR
- 2.08
- GRM
- 3.9
CMA / ARV
No comps found within radius.
Projected returns pro-forma
-3.0% appreciation · 5.59% rent growth · sell at horizon
- IRR
- 7.8%
- Equity multiple
- 1.32×
- Total profit
- $14,332
- Equity at exit
- $23,857
- IRR
- 20.5%
- Equity multiple
- 3.10×
- Total profit
- $94,065
- Equity at exit
- $13,834
Cash invested: $44,800 (down + closing). Projections, not guarantees.
Landlord ↔ Tenant lean methodology
- Overall (STATE)
- 87 Strongly Landlord-Friendly
- State Florida
- 87 Strongly Landlord-Friendly · R+3
- County
- — inherits STATE
- City
- — inherits STATE
ZIP-level market 34113
- Rents YoY
- 5.6%
- Active inventory
- 597
- Price-to-rent
- 3.9×
Monthly cashflow live
- Estimated rent
- $3,410 medium interval (Pro) →
- Mortgage (P&I)
- −$839
- Tax est. 1.5%
- −$200 /mo · $2,400/yr
- Insurance
- −$67
- Flood insurance flood zone
- −$427 /mo · $5,118/yr
- HOA
- −$684
- Vacancy / Maint / Mgmt
- −$716
- Net cashflow
- $477
Break-even live
UW: 25.0% down · 7.5% · 30yr · 1.5% tax · 5.0% vac · 8.0% maint · 8.0% mgmt
Financing live
Cash to close
- Down payment
- $40,000
- Closing costs
- $4,800
- Reserves months
- —
- Total cash needed
- —
Loan-product check · same deal, 3 products live
Conventional
25% down · 7.5% · 30yr
- Down + closing
- —
- Monthly P&I
- —
- Monthly cashflow
- —
- DSCR
- —
- Eligible?
- —
Personal DTI + credit; lowest rate.
DSCR
20% down · 8.5% · 30yr
- Down + closing
- —
- Monthly P&I
- —
- Monthly cashflow
- —
- DSCR
- —
- Eligible?
- —
No personal income docs; deal must DSCR.
Hard money
10% down · 12.0% · 12mo
- Down + closing
- —
- Monthly P&I
- —
- Monthly cashflow
- —
- DSCR
- —
- Eligible?
- —
Short-term bridge; refi at stabilization.
Rent comps 40 comps
| Address | Beds | Baths | Sqft | Rent | $/sqft | DOM | Units | Dist |
|---|---|---|---|---|---|---|---|---|
| 6984 Saona Ct Naples, FL | 2.0 | 2.0 | 1472 | $7,500 | $5.10 | 23d | 1 | 0.13mi |
| 7110 Cayo Coco Ln Naples, FL | 2.0 | 2.0 | 1387 | $9,250 | $6.67 | 23d | 1 | 0.19mi |
| 7124 Saona Ct Naples, FL | 2.0 | 2.0 | 1387 | $8,000 | $5.77 | 23d | 1 | 0.20mi |
| 7142 Cayo Coco Ln Naples, FL | 2.0 | 2.0 | 1490 | $10,000 | $6.71 | 23d | 1 | 0.21mi |
| 7138 Cayo Coco Ln Naples, FL | 2.0 | 2.0 | 1205 | $6,500 | $5.39 | 23d | 1 | 0.22mi |
| 7197 Saona Ct Unit 1545994P Naples, FL | 2.0 | 2.0 | 1291 | $4,152 | $3.22 | 14d | 1 | 0.22mi |
| 7213 Saona Ct Naples, FL | 2.0 | 2.0 | 1308 | $7,500 | $5.73 | 23d | 1 | 0.24mi |
| 7162 Saona Ct Naples, FL | 2.0 | 2.0 | 1482 | $9,000 | $6.07 | 23d | 1 | 0.24mi |
| 7204 Cayo Coco Ln Naples, FL | 2.0 | 2.0 | 1308 | $7,500 | $5.73 | 23d | 1 | 0.27mi |
| 7289 Saona Ct Naples, FL | 2.0 | 2.0 | 1411 | $10,000 | $7.09 | 23d | 1 | 0.28mi |
| 7242 Saona Ct Naples, FL | 2.0 | 2.0 | 1204 | $7,750 | $6.44 | 23d | 1 | 0.28mi |
| 248 Pebble Beach Cir Unit G201 Naples, FL | 2.0 | 2.0 | 1163 | $2,300 | $1.98 | 23d | 1 | 0.30mi |
| 7286 Saona Ct Naples, FL | 2.0 | 2.0 | 1205 | $10,000 | $8.30 | 23d | 1 | 0.31mi |
| 7263 Cayo Coco Ln Naples, FL | 2.0 | 2.0 | 1321 | $6,500 | $4.92 | 23d | 1 | 0.32mi |
| 7259 Cayo Coco Ln Naples, FL | 2.0 | 2.0 | 1411 | $6,500 | $4.61 | 23d | 1 | 0.33mi |
| 7299 Cayo Coco Ln Naples, FL | 2.0 | 2.0 | 1476 | $6,500 | $4.40 | 23d | 1 | 0.34mi |
| 190 Pebble Beach Blvd #301 Naples, FL | 2.0 | 2.0 | 954 | $1,700 | $1.78 | 23d | 1 | 0.39mi |
| 452 Bristle Cone Ln #27 Naples, FL | 2.0 | 2.0 | 1129 | $2,000 | $1.77 | 23d | 1 | 0.42mi |
| 240 Pebble Beach Blvd #702 Naples, FL | 2.0 | 2.0 | 1090 | $4,000 | $3.67 | 23d | 1 | 0.44mi |
| 326 Bradstrom Cir Unit 103F Naples, FL | 2.0 | 2.0 | 1113 | $1,800 | $1.62 | 23d | 1 | 0.46mi |
| 326 Bradstrom Cir Unit 204F Naples, FL | 3.0 | 2.0 | 1200 | $3,500 | $2.92 | 23d | 1 | 0.46mi |
| 232 Pebble Beach Blvd #104 Naples, FL | 3.0 | 2.0 | 1298 | $1,975 | $1.52 | 23d | 1 | 0.47mi |
| 332 Bradstrom Cir #201 Naples, FL | 2.0 | 2.0 | 1257 | $2,200 | $1.75 | 23d | 1 | 0.47mi |
| 5293 Dixie Dr Unit 1546039P Naples, FL | 2.0 | 2.0 | 1130 | $1,561 | $1.38 | 14d | 1 | 0.48mi |
| 315 Saint Andrews Blvd Unit A25 Naples, FL | 2.0 | 2.0 | 1126 | $1,530 | $1.36 | 23d | 1 | 0.49mi |
| 300 Valley Stream Dr Unit 3D Naples, FL | 2.0 | 2.0 | 979 | $1,795 | $1.83 | 23d | 1 | 0.75mi |
| 300 Valley Stream Dr Unit 3D Naples, FL | 2.0 | 2.0 | 979 | $1,795 | $1.83 | 21d | 1 | 0.75mi |
| 5419 Rattlesnake Hammock Rd Unit 307F Naples, FL | 2.0 | 2.0 | 1071 | $1,950 | $1.82 | 14d | 1 | 0.75mi |
| 200 Valley Stream Dr Unit 8B Naples, FL | 2.0 | 2.0 | 979 | $1,750 | $1.79 | 23d | 1 | 0.77mi |
| 5499 Rattlesnake Hammock Rd Naples, FL | 2.0 | 2.0 | 1071 | $1,775 | $1.66 | 14d | 2 | 0.78mi |
| 4977 Pepper Cir #205 Naples, FL | 2.0 | 2.0 | 1250 | $2,250 | $1.80 | 21d | 1 | 0.79mi |
| 520 Augusta Blvd Unit B204 Naples, FL | 3.0 | 2.0 | 1294 | $2,200 | $1.70 | 23d | 1 | 0.79mi |
| 9509 Avellino Way Naples, FL | 2.0 | 2.0 | 1434 | $7,350 | $5.13 | 14d | 2 | 0.83mi |
| 9509 Avellino Way #1815 Naples, FL | 2.0 | 2.0 | 1454 | $7,500 | $5.16 | 23d | 1 | 0.84mi |
| 5535 Rattlesnake Hammock Rd #302 Naples, FL | 2.0 | 2.0 | 1205 | $2,800 | $2.32 | 23d | 1 | 0.85mi |
| 9513 Avellino Way #2024 Naples, FL | 2.0 | 2.0 | 1454 | $7,000 | $4.81 | 23d | 1 | 0.87mi |
| 413 Augusta Blvd #302 Naples, FL | 2.0 | 2.0 | 1390 | $5,500 | $3.96 | 21d | 1 | 0.87mi |
| 9510 Avellino Way #1926 Naples, FL | 3.0 | 2.0 | 1454 | $8,000 | $5.50 | 23d | 1 | 0.88mi |
| 332 Charlemagne Blvd Unit H101 Naples, FL | 2.0 | 2.0 | 1082 | $3,500 | $3.23 | 23d | 1 | 0.90mi |
| 332 Charlemagne Blvd Unit H103 Naples, FL | 2.0 | 2.0 | 1082 | $3,495 | $3.23 | 23d | 1 | 0.90mi |
HOA detail condo
- Monthly dues
- $684 · $8,208/yr
- Likely covers
- pool
- Assessments
- None detected in remarks — confirm with the listing agent.
Listing history 2 events
-
2026-06-03remarks 693-char remark
-
2026-06-03$160,000 Pending 182 DOM
ⓘ Source: listings_history table (triggers on properties + properties_extension) + one-shot
backfill from property_details.listing_events for pre-trigger history.
Climate risk First Street
- Flood 9/10 Extreme FEMA zone AE · 99% chance over 30 yrs
- Wildfire 4/10 Moderate
- Heat 10/10 Extreme 7 d/yr ≥107°F today · 27 d/yr by 30 yrs out
- Wind 10/10 Extreme 99% chance of damaging wind over 30 yrs
- Air quality 2/10 Low 2 unhealthy d/yr today · 2 by 30 yrs out
Nearby sold comps map
Loading sold comps map…
Walkable amenities ~0.75 mi
Loading nearby amenities…
Taxation est. · year 1
- Rental income
- $40,917
- − Mortgage interest
- −$8,962
- − Property taxes
- −$2,400
- − Insurance
- −$5,918
- − Repairs & maintenance
- −$3,273
- − Management
- −$3,273
- − HOA
- −$8,208
- − Depreciation
- −$4,655
- Taxable income
- $4,227
- Est. tax owed @ 24.0%
- −$1,014
- After-tax cash flow
- $4,715/yr
For passive investors: Depreciation is non-cash, so a rental often shows a tax loss while cash-flowing — sheltering income. Rental losses are passive: they offset passive income freely, and up to $25,000/yr can offset ordinary (W-2) income if you actively participate and your MAGI is under $100k (phasing out to $0 by $150k); unused losses carry forward. On sale, claimed depreciation is recaptured at up to 25%, and gains may owe capital-gains tax (a 1031 exchange can defer both). Figures are a year-1 estimate at your 24.0% rate — not tax advice; consult a CPA.
Condition & rehab AI · 13 photos
This well-maintained, move-in-ready townhouse offers a good investment opportunity with minor updates needed for a fresh look.
Repairs flagged
- Minor Kitchen cabinets — Some wear
- Minor Bathroom fixtures — Some wear
Value-add opportunities
- Both Paint interior walls — Fresh paint enhances curb appeal and interior aesthetics
- Both Replace kitchen cabinets — Modern cabinets improve functionality and aesthetics
- Both Replace bathroom fixtures — Modern fixtures improve functionality and aesthetics
Renovation cost estimate screening
| Repair item | Severity | Est. cost |
|---|---|---|
| Kitchen cabinets · Some wear | Minor | $500–3,000 |
| Bathroom fixtures · Some wear | Minor | $500–3,000 |
| Total estimated repair cost · 2 items | $1,000–6,000 |
Value-add ROI direction
- Both Paint interior walls — Fresh paint enhances curb appeal and interior aesthetics ↑
- Both Replace kitchen cabinets — Modern cabinets improve functionality and aesthetics ↑
- Both Replace bathroom fixtures — Modern fixtures improve functionality and aesthetics ↑
ⓘ Cost ranges are severity-bucket heuristics (US national rule-of-thumb). Get contractor quotes + a written scope before underwriting a rehab budget.
Schools (NCES district)
- District
- Collier
- NCES district ID
- 1200330
- Math proficiency
- 60% ▼ -4.00%
- Reading proficiency
- 56% ▼ -2.00%
- Median HH income
- $58,275
- Composite
- 50.23/100
- National rank
- #1892
- State rank
- #16 of 73 in FL
Livability — Lely
- Score
- 66/100
- State rank
- #586
- US rank
- #11224
Category grades
Schools grade is shown separately in the Schools card above.
Census & demographics
- Census place
- Lely, FL
- County
- Collier County · 396,295 people
- Metro
- Naples-Marco Island, FL
- Population (ZIP)
- 26,056
- Household income
- $81,674
- Rent vs Own
- Severe rent burden
- 954.0
Population outlook (Collier County) Hauer SSP2
- Today (2025)
- 420,858 people
- By 2030
- 450,054 · +6.9%
- By 2040
- 502,232 · +19.3%
- By 2050
- 544,932 · +29.5%
- By 2075
- 627,203 · +49.0%
- By 2100
- 659,015 · +56.6%
Race, ethnicity, and origin ACS 2023
- Neighborhood character
- Diverse neighborhood (Simpson 0.59)
- Race & ethnicity
- White 56% Hispanic / Latino 28% Black 12% Two or more races 11% Asian 2%
- Hispanic origin (detail)
- Mexican 17% Puerto Rican 3% Cuban 2%
- Common ancestry
- Hispanic 10% Romanian 3% Lithuanian 2%
- Foreign-born
- 26% · Canada, Jamaica, Vietnam
- Languages at home
- 63% English-only · Spanish 24% French/Haitian/Cajun 9% Other Indo-European 2%
Political lean MEDSL · Collier
- 2024 margin
- Solid R (+33.1) · D 33.1% · R 66.2%
- 2008→2024 swing
- -10.6pp toward R · 2008: -22.5pp · 2024: -33.1pp
- All cycles
- 2024: R+33.1 2020: R+24.7 2016: R+26.0 2012: R+30.1 2008: R+22.5
Not yet ingested
- Civics
- —
Market trends
- HPI YoY
- ▼ -194.86%
- Current HPI
- 279.4232
- Rent YoY
- ▲ 5.59%
- Metro
- Naples-Marco Island, FL
- State GDP YoY
- ▲ 3.28%
- F500 in state
- 36
Industry mix (Fortune 500 HQ in FL)
| Industry | F500 HQs | Revenue |
|---|---|---|
| Industrial Technology | 2 | $29B |
|
||
| Insurance | 2 | $17B |
|
||
| Retail | 1 | $60B |
|
||
| Technology Distribution | 1 | $58B |
|
||
| Homebuilding | 1 | $35B |
|
||
| Technology Manufacturing | 1 | $35B |
|
||
Price history
-36.0% since first listed11 events — show timeline
- 2026-05-29 Pending — NAPLESMLS
- 2026-05-23 Price Changed $160,000 NAPLESMLS
- 2026-05-08 Price Changed $175,000 NAPLESMLS
- 2026-04-14 Price Changed $194,499 NAPLESMLS
- 2026-04-08 Price Changed $199,999 NAPLESMLS
- 2026-04-04 Price Changed $210,000 NAPLESMLS
- 2026-03-22 Price Changed $215,000 NAPLESMLS
- 2026-03-04 Price Changed $229,900 NAPLESMLS
- 2026-02-11 Price Changed $234,900 NAPLESMLS
- 2026-01-04 Price Changed $244,900 NAPLESMLS
- 2025-11-28 Listed $249,900 NAPLESMLS
Cash-flow waterfall
monthlySold comps — $/sqft
last 12 mo · ≤1 miLoading sold comps…