1007 Raney St · Hiawatha, IA
Flood risk 1/10 · Minimal
- FEMA flood zone
- X (unshaded)
- Chance of flooding over 30 yrs
- 0.0%
- Est. flood insurance / yr
- $473 – $860
Fire risk 3/10 · Minor
- Est. fire insurance / yr
- $902 – $1,676
Heat risk 3/10 · Minor
- Hot days now (above 103°F)
- 7 days/yr
- Hot days in 30 yrs
- 15 days/yr
Wind risk 2/10 · Minimal
- Chance of severe wind over 30 yrs
- —
Air-quality risk 2/10 · Minimal
- Unhealthy air days now
- 0 days/yr
- Unhealthy air days in 30 yrs
- 1 days/yr
Risk factors via First Street. Map © Google.
Why this score? — see what drove the B- grade
The composite is a weighted blend of 9 inputs, each scored 0–100. Each bar is that input's sub-score; the figure is the points it added to the 100-point composite (weight × sub-score).
- Cash flow +25.2/30.0
- ARV discount +13.0/15.0
- DSCR +8.3/10.0
- 1% rule +6.5/10.0
- Schools +4.7/10.0
- Livability +4.0/5.0
- Rent growth +2.5/5.0
- Condition / age +2.5/5.0
- Appreciation +0.0/10.0
$229,950
🖨 Deal sheet 📄 Offer letter ✓ Due diligence
Listing remarks
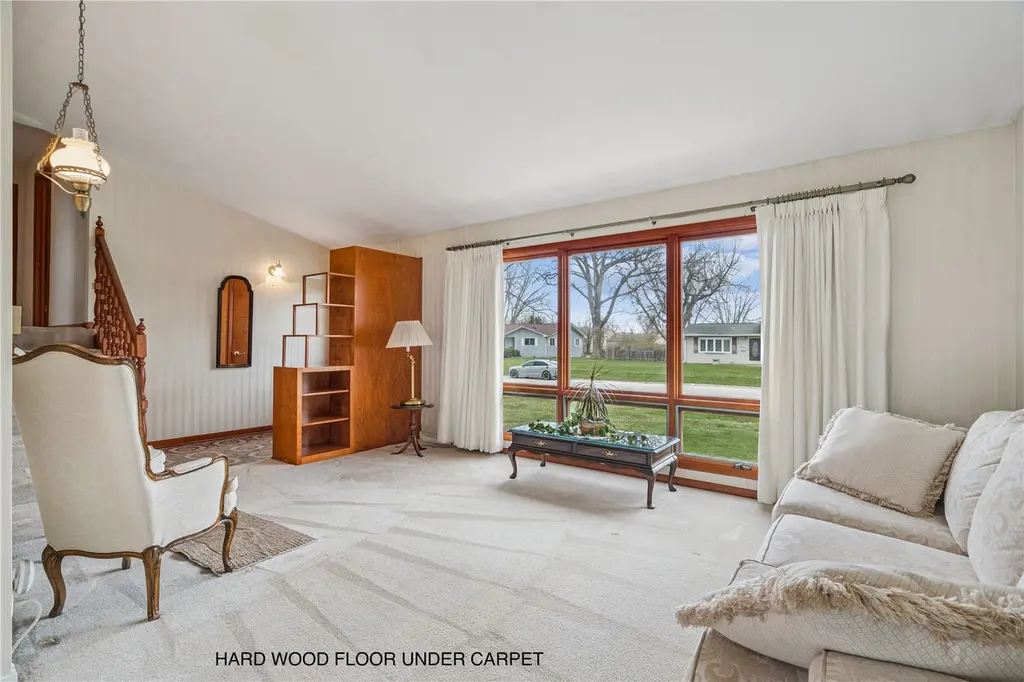
Mid-Century Classic one-owner split-level in the heart of Hiawatha—lovingly owned by the original owner since its construction in 1961 and priced below assessed value. Set on nearly a third of an acre with wide streets and no sidewalks to maintain, this spacious home offers exceptional convenience just minutes from shopping, dining, and quick I-380 access. Inside features 4 bedrooms, 2 baths, and multiple living spaces including a living room, den, and spacious rec room—ideal for everyday living and entertaining. Original hardwood floors lie beneath the carpet on the main and upper levels, ready to be revealed. The bright breezeway connecting the home to the heated garage create
Key facts
- Bright breezeway
- 0.34 acre lot
- 2 garage spots
Tags
Property features AI
Exterior
- Parking: 2-car garage with garage door opener
- Utilities: Public water; Public sewer
- Home design: Single family residence; Multi/split levels
- Construction: Aluminum siding and frame construction; Home warranty included
- Exterior features: Deck; Fenced yard; Public maintained road access; Pets allowed
Interior
- Kitchen: Dishwasher; Range; Range hood; Microwave; Refrigerator; Disposal; Breakfast bar / eat-in kitchen
- Bedrooms: Total rooms: 8
- Bathrooms: 2 full bathrooms
- Heating & cooling: Natural gas forced air heating; Central air conditioning
- Interior features: Breakfast bar; Eat-in kitchen; Free-standing gas fireplace; Full basement
- Laundry & utility: Washer; Dryer; Gas water heater
Neighborhood map
What this means for you Summary
Snapshot
- This is a 4-bed/2.0-bath single-family listed at $230k.
Deal economics
- At list price, monthly cash flow is $514 ($6k/yr) — positive.
- The deal already cash-flows at list — no discount required.
- Meets the 1% rule at list price ($3k rent vs $230k).
- Cap rate 9.0% vs local median 2.0% in Hiawatha — top-decile yield for the area; either an underpriced asset or a hidden risk that comps aren't pricing in. Stress-test before assuming the spread holds.
Location & tenants
- Location reads 79/100 on livability (#93 in IA, #1,983 nationally) — a middle-class / working-renter tenant base. Strengths: cost of living A+, housing A+, health & safety A+; Watch: employment D, amenities F.
- Cedar Rapids Community School District (urban): math 50% / reading 59% proficiency, ranked #265 of 289 in IA (top 92%) — acceptable for families but not a draw, mixed tenant base, ~2y average lease.
- Zoned schools: Hiawatha Elementary School (math 52% / reading 57%, grade C, #462 of 616 statewide, top 79%, 328 students, 54% FRL); Harding Middle School (math 61% / reading 69%, grade A-, #154 of 246 statewide, top 63%, 713 students, 43% FRL); John F Kennedy High School (math 63% / reading 77%, grade B+, #146 of 336 statewide, top 45%, 1,714 students, 31% FRL) — zoned schools at 43% FRL track the district average.
- Market conditions: 136 active listings in the ZIP; 1 comparable units currently listed for rent nearby; 1,023 units permitted in Linn County in 2024 (456 in 5+ unit buildings).
Forward outlook
- Local home prices are declining (-3.0%/yr); year-one equity from $2k of loan paydown is wiped out by about $7k of value loss. Plan a longer hold.
- Linn County population projected at +16% by 2050 — long-run rental-demand tailwind backs the buy-and-hold thesis.
Negotiation context
- Only 2 days on market — expect competitive offers; lowballing is unlikely to land.
- 2 sale attempts since 12y ago with the ask held roughly flat each time — persistent listings suggest the price (not the market) is what's stuck; bring a comps-based counter.
- Current owner paid $22k; list at $230k implies a 957% gain — meaningful room to come down on a strong offer.
Questions for the listing agent
- Built in 1961 — when were the roof, HVAC, electrical panel, plumbing, and water heater last replaced?
- Is there a deadline driving the sale (1031 exchange, divorce, estate, relocation)? That informs how much negotiation room exists.
- Schools are B-rated — typically a magnet for longer-tenancy family renters. What's the average tenant stay here, and is there a school-zone premium baked into asking?
- What's the average days-on-market for RENTAL listings here right now (not sales)? A rising rental-DOM trend means longer vacancies and softer asking-rent achievability than the comps imply.
- What's the recent tenant-quality profile in this submarket — average credit score on applications, eviction rate, late-payment / NSF rate, and stable-employment percentage? A property-management company in the area should have these aggregated.
- How much new for-sale + rental construction is in the pipeline within 1–3 miles? Heavy new supply typically softens prices + rents 12–24 months out; constrained supply supports both.
Investment metrics
- 1% rule
- 1.15% ✓
- Cap rate
- 8.98%
- Cash-on-cash
- 9.59%
- DSCR
- 1.43
- GRM
- 7.2
CMA / ARV
- ARV (on-the-fly)
- $261,747
- Comps found
- 12
Show comp detail 12 sales within ~0.75 mi
| Address | Dist | Beds/Ba | Sqft | Sold | Price | $/sf | Match |
|---|---|---|---|---|---|---|---|
| 1007 Raney St | 0.00mi | 4/2.0 | 1,940 (-6%) | 1mo | $246,950 | $127 | 90 |
| 1110 Rainbow Blvd | 0.19mi | 4/2.0 | 2,039 (-1%) | 12mo | $258,000 | $127 | 80 |
| 40 11th Ave | 0.24mi | 4/2.0 | 1,986 (-4%) | 8mo | $225,000 | $113 | 76 |
| 1083 Rainbow Blvd | 0.13mi | 3/2.0 (-1) | 1,937 (-6%) | 11mo | $199,999 | $103 | 70 |
| 1284 Rainbow Blvd | 0.33mi | 4/1.5 | 1,980 (-4%) | 8mo | $187,500 | $95 | 70 |
| 1032 Emmons St | 0.20mi | 3/2.0 (-1) | 1,871 (-9%) | 3mo | $258,500 | $138 | 68 |
| 1026 Eisenhower Rd | 0.15mi | 3/2.0 (-1) | 1,900 (-8%) | 10mo | $245,000 | $129 | 67 |
| 202 6th Ave | 0.32mi | 5/2.0 (+1) | 1,872 (-9%) | 1mo | $210,000 | $112 | 64 |
| 1213 Raney St St | 0.29mi | 4/3.0 | 1,836 (-11%) | 4mo | $255,000 | $139 | 61 |
| 3700 Fir Tree Dr NE | 0.62mi | 4/2.0 | 1,910 (-7%) | 8mo | $235,000 | $123 | 52 |
| 1067 Lyndhurst Dr | 0.30mi | 3/2.0 (-1) | 2,304 (+12%) | 12mo | $300,500 | $130 | 52 |
| 2602 Towne House Dr NE | 0.61mi | 4/2.5 | 1,796 (-13%) | 3mo | $232,000 | $129 | 45 |
Match score weights: distance 35% · size 25% · config 20% · recency 20%. Top-matched comps best support the ARV.
Projected returns pro-forma
-3.0% appreciation · 3.0% rent growth · sell at horizon
- IRR
- -1.8%
- Equity multiple
- 0.93×
- Total profit
- $-4,472
- Equity at exit
- $34,286
- IRR
- 7.9%
- Equity multiple
- 1.60×
- Total profit
- $38,423
- Equity at exit
- $19,882
Cash invested: $64,386 (down + closing). Projections, not guarantees.
Landlord ↔ Tenant lean methodology
- Overall (STATE)
- 83 Strongly Landlord-Friendly
- State Iowa
- 83 Strongly Landlord-Friendly · R+6
- County
- — inherits STATE
- City
- — inherits STATE
ZIP-level market 52233
- Home prices YoY
- -28.1%
- Active inventory
- 136
- Price-to-rent
- 7.2×
Monthly cashflow live
- Estimated rent
- $2,650 medium interval (Pro) →
- Mortgage (P&I)
- −$1,206
- Tax from tax record
- −$278 /mo · $3,330/yr
- Insurance
- −$96
- HOA
- −$0
- Vacancy / Maint / Mgmt
- −$556
- Net cashflow
- $514
Break-even live
UW: 25.0% down · 7.5% · 30yr · 1.5% tax · 5.0% vac · 8.0% maint · 8.0% mgmt
Financing live
Cash to close
- Down payment
- $57,488
- Closing costs
- $6,898
- Reserves months
- —
- Total cash needed
- —
Loan-product check · same deal, 3 products live
Conventional
25% down · 7.5% · 30yr
- Down + closing
- —
- Monthly P&I
- —
- Monthly cashflow
- —
- DSCR
- —
- Eligible?
- —
Personal DTI + credit; lowest rate.
DSCR
20% down · 8.5% · 30yr
- Down + closing
- —
- Monthly P&I
- —
- Monthly cashflow
- —
- DSCR
- —
- Eligible?
- —
No personal income docs; deal must DSCR.
Hard money
10% down · 12.0% · 12mo
- Down + closing
- —
- Monthly P&I
- —
- Monthly cashflow
- —
- DSCR
- —
- Eligible?
- —
Short-term bridge; refi at stabilization.
Rent comps 1 comps
| Address | Beds | Baths | Sqft | Rent | $/sqft | DOM | Units | Dist |
|---|---|---|---|---|---|---|---|---|
| 419 Cimarron Dr Hiawatha, IA | 3.0 | 2.5 | 1680 | $2,650 | $1.58 | 43d | 1 | 0.87mi |
Listing history 4 events
-
2026-04-08status Pending
-
2026-04-06$229,950 Active
-
2014-07-09$159,500
-
1961-09-27soldstatus $21,750
ⓘ Source: listings_history table (triggers on properties + properties_extension) + one-shot
backfill from property_details.listing_events for pre-trigger history.
Tax reassessment forecast IA · Partial reset (capped growth)
- Current annual tax
- $3,330 · $278/mo
- Projected year-2 tax
- $3,470 · $289/mo
- Expected delta
- +$140/yr (+$12/mo · 4.2%)
ⓘ Screening estimate from a state-policy table — verify with the county assessor before closing.
Climate risk First Street
- Flood 1/10 Low FEMA zone X (unshaded) · 0% chance over 30 yrs
- Wildfire 3/10 Moderate
- Heat 3/10 Moderate 7 d/yr ≥103°F today · 15 d/yr by 30 yrs out
- Wind 2/10 Low
- Air quality 2/10 Low 0 unhealthy d/yr today · 1 by 30 yrs out
Nearby sold comps map
Loading sold comps map…
Walkable amenities ~0.75 mi
Loading nearby amenities…
Taxation est. · year 1
- Rental income
- $31,800
- − Mortgage interest
- −$12,881
- − Property taxes
- −$3,330
- − Insurance
- −$1,150
- − Repairs & maintenance
- −$2,544
- − Management
- −$2,544
- − Depreciation
- −$6,689
- Taxable income
- $2,662
- Est. tax owed @ 24.0%
- −$639
- After-tax cash flow
- $5,533/yr
For passive investors: Depreciation is non-cash, so a rental often shows a tax loss while cash-flowing — sheltering income. Rental losses are passive: they offset passive income freely, and up to $25,000/yr can offset ordinary (W-2) income if you actively participate and your MAGI is under $100k (phasing out to $0 by $150k); unused losses carry forward. On sale, claimed depreciation is recaptured at up to 25%, and gains may owe capital-gains tax (a 1031 exchange can defer both). Figures are a year-1 estimate at your 24.0% rate — not tax advice; consult a CPA.
Schools (NCES district)
- District
- Cedar Rapids Community School District
- NCES district ID
- 1906540
- Math proficiency
- 50% ▼ -12.00%
- Reading proficiency
- 59% ▼ -6.00%
- Median HH income
- $53,568
- Composite
- 46.82/100
- National rank
- #2378
- State rank
- #265 of 289 in IA
Livability — Hiawatha
- Score
- 79/100
- State rank
- #93
- US rank
- #1983
Category grades
Schools grade is shown separately in the Schools card above.
Census & demographics
- Census place
- Hiawatha, IA
- City population
- 7,008
- Population (ZIP)
- 7,008
Population outlook (Linn County) Hauer SSP2
- Today (2025)
- 239,589 people
- By 2030
- 248,587 · +3.8%
- By 2040
- 264,817 · +10.5%
- By 2050
- 278,685 · +16.3%
- By 2075
- 311,754 · +30.1%
- By 2100
- 336,773 · +40.6%
Race, ethnicity, and origin ACS 2023
- Neighborhood character
- Predominantly White (80%)
- Race & ethnicity
- White 80% Asian 6% Two or more races 5% Black 4% Hispanic / Latino 4%
- Common ancestry
- Portuguese 6% Scottish 3% Iranian 1%
- Foreign-born
- 6% · China, Canada
- Languages at home
- 90% English-only · Other Indo-European 6% Spanish 3%
Political lean MEDSL · Linn
- 2024 margin
- Lean D (+9.9) · D 54.2% · R 44.3% · Other 1.4%
- 2008→2024 swing
- -11.6pp toward R · 2008: 21.5pp · 2024: 9.9pp
- All cycles
- 2024: D+9.9 2020: D+13.7 2016: D+9.0 2012: D+17.6 2008: D+21.5
Not yet ingested
- Civics
- —
Market trends
- HPI YoY
- ▼ -78.12%
- Current HPI
- 199.6054
- Rent YoY
- —
- Metro
- —
- State GDP YoY
- ▲ 2.48%
- F500 in state
- 4
Industry mix (Fortune 500 HQ in IA)
| Industry | F500 HQs | Revenue |
|---|---|---|
| Financial Services | 1 | $16B |
|
||
| Retail / Convenience | 1 | $15B |
|
||
Price history
+957.2% since first listed4 events — show timeline
- 2026-04-08 Pending — CRAAR, CDRMLS
- 2026-04-06 Listed $229,950 CRAAR, CDRMLS
- 2014-07-09 Listed $159,500 CRAAR, CDRMLS
- 1961-09-27 Sold (Public Records) $21,750 Public Records
Property tax history
+0.8%/yrLatest (2025): $3,330 · -1.5% YoY. Source: county tax records.
Cash-flow waterfall
monthlySold comps — $/sqft
last 12 mo · ≤1 miLoading sold comps…