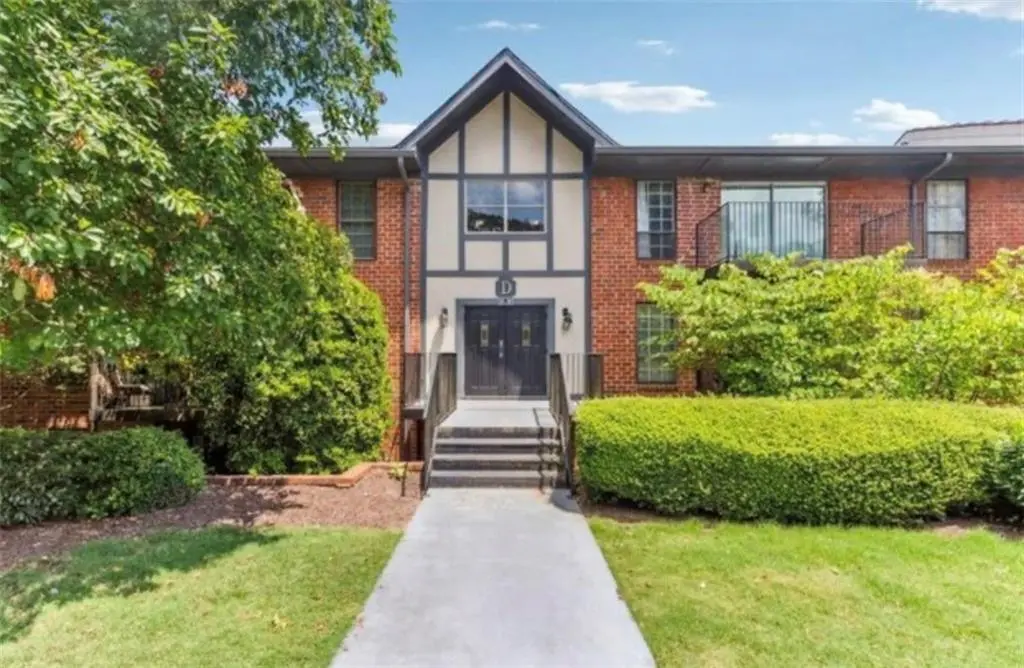
6851 Roswell Rd Unit D21 · Sandy Springs, GA
Flood risk 1/10 · Minimal
- FEMA flood zone
- X (unshaded)
- Chance of flooding over 30 yrs
- 0.0%
- Est. flood insurance / yr
- $507 – $1,088
Fire risk 1/10 · Minimal
- Est. fire insurance / yr
- $963 – $1,789
Heat risk 6/10 · Moderate
- Hot days now (above 103°F)
- 7 days/yr
- Hot days in 30 yrs
- 20 days/yr
Wind risk 4/10 · Minor
- Chance of severe wind over 30 yrs
- 17.0%
Air-quality risk 5/10 · Moderate
- Unhealthy air days now
- 6 days/yr
- Unhealthy air days in 30 yrs
- 8 days/yr
Risk factors via First Street. Map © Google.
Why this score? — see what drove the D grade
The composite is a weighted blend of 9 inputs, each scored 0–100. Each bar is that input's sub-score; the figure is the points it added to the 100-point composite (weight × sub-score).
- ARV discount +12.6/15.0
- Cash flow +8.6/30.0
- 1% rule +4.7/10.0
- Schools +4.5/10.0
- Livability +3.7/5.0
- Condition / age +2.5/5.0
- DSCR +2.4/10.0
- Rent growth +2.4/5.0
- Appreciation +0.0/10.0
$239,900
🖨 Deal sheet (PDF) 📄 Offer letter ✓ Due diligence
Listing remarks
Location truly makes the difference—and this one delivers. Nestled in a prime Sandy Springs setting surrounded by million-dollar homes and highly rated schools, this top-floor condo offers exceptional value just minutes from the Perimeter. From the moment you step inside, you’ll feel at home. This beautifully updated residence blends comfort, space, and style across 1,469 square feet—one of the largest layouts in the community—perfect for both everyday living and entertaining. The renovated kitchen and bathrooms add a fresh, modern touch, while the flexible 3-bedroom floor plan includes a cozy fireplace room that can easily serve as a bonus space, home office, or den
Key facts
- $556 HOA
- 2 parking spots
- Community pool
Property features AI
Finance
- Other: Road access via asphalt city street
- HOA & community: Monthly association fee (includes electricity, gas, internet, grounds and structure maintenance, reserves, security, sewer, pool, termite, tennis, trash and water); Community amenities include clubhouse, pool, playground, sidewalks, street lights, trails/greenway, park and tennis courts; 402 units in the community
Exterior
- Parking: Assigned parking in a parking lot for two vehicles
- Security: Gated community; Community security included in association
- Utilities: Public water; Public sewer; 110V and 220V electric; Cable available; Natural gas available; Phone service available
- Home design: Condominium; One level; Resale property; Located in Foxcroft building D, unit 21
- Construction: Brick on all four sides; Composition roof; Slab foundation; Wrought iron fencing
- Exterior features: Balcony; Courtyard; Private entrance; Deck; Tennis courts; In-ground heated pool (fenced)
Interior
- Kitchen: Cabinets and other-style countertops; Dishwasher; Gas oven; Gas range; Microwave; Garbage disposal
- Bedrooms: Master bedroom on main level; Three main-level bedrooms
- Flooring: Carpet; Hardwood; Tile
- Bathrooms: Two full bathrooms; Master bathroom with double vanity and separate tub and shower (tub/shower combo listed)
- Heating & cooling: Central heating (natural gas); Central air conditioning (electric); Ceiling fans
- Interior features: Crown molding; Disappearing attic stairs; High 9-ft ceilings on main level; Tray ceilings; High-speed internet available; Walk-in closets; Insulated windows; One factory-built, ventless fireplace located in another room
- Laundry & utility: Electric dryer hookup; Laundry located in hall on main level
Neighborhood map
What this means for you Summary
Snapshot
- This is a 3-bed/2.0-bath condo listed at $240k.
Deal economics
- At list price, monthly cash flow is $-207 ($-2k/yr) — negative.
- To cash-flow at today's rent, offer at most $203k (15.2% below list).
- To meet the 1% rule (rent ≥ 1% of price), the offer needs to be $234k (2.6% below list).
- Recommended offer: $203k (15.2% below list) — sets the bar for cash-flow.
- Cap rate 5.3% vs local median 2.6% in Sandy Springs — top-decile yield for the area; either an underpriced asset or a hidden risk that comps aren't pricing in. Stress-test before assuming the spread holds.
Location & tenants
- Location reads 73/100 on livability (#45 in GA) — a middle-class / working-renter tenant base. Strengths: employment A+, crime A-, commute A-; Watch: amenities F, cost of living F.
- Fulton County (suburban): math 49% / reading 53% proficiency, ranked #12 of 174 in GA (top 7%) — acceptable for families but not a draw, mixed tenant base, ~2y average lease.
- Zoned schools: Woodland Elementary School (math 45% / reading 46%, grade D-, #323 of 1,228 statewide, top 26%, 968 students, 39% FRL); Ridgeview Charter School (math 33% / reading 45%, grade F, #155 of 470 statewide, top 33%, 996 students, 45% FRL); Riverwood International Charter School (math 24% / reading 10%, grade F, #269 of 424 statewide, top 65%, 1,737 students, 30% FRL) — zoned schools at 38% FRL track the district average.
- Zoned-school proficiency averages 34% at this address vs 51% district-wide (-17 pts) — the specific schools serving this property underperform the Fulton County average; the district grade overstates school quality for this exact location.
- Market conditions: Rents soft (-0.2%/yr); 381 active listings in the ZIP; 40 comparable units currently listed for rent nearby; rentals leasing fast (median 7d on market — plan ~1-2 weeks tenant-placement turnaround); high-income renter base; 11,565 units permitted in Fulton County in 2024 (8,159 in 5+ unit buildings).
Forward outlook
- Local home prices are declining (-3.0%/yr); year-one equity from $2k of loan paydown is wiped out by about $7k of value loss. Plan a longer hold.
- Fulton County population projected at +38% by 2050 — long-run rental-demand tailwind backs the buy-and-hold thesis.
Negotiation context
- It's been on market 38 days — a 3% lower offer ($233k) is reasonable based on typical stale-listing flexibility.
- 9 sale attempts since 8y ago with the ask held roughly flat each time — persistent listings suggest the price (not the market) is what's stuck; bring a comps-based counter.
- Current owner paid $208k; 15% above their basis — modest negotiation headroom, anchor on the comps not their cost.
Risks & watch-outs
- Watch-outs: HOA is 24% of rent.
- Climate carrying-cost: extreme-heat days projected 7→20/yr by 2055 (HVAC capex compounding) — expect insurance premiums to compound above CPI over the hold.
Questions for the listing agent
- What do current leases actually rent for vs. the listed asking? Can we see a recent rent roll and the last 12 months of T-12 income?
- It's been on market 38 days. Have you received any prior offers? Is the seller open to a 15% concession, seller financing, or rate buy-down credit?
- Built in 1964 — when were the roof, HVAC, electrical panel, plumbing, and water heater last replaced?
- What does the HOA fee cover, when was the last increase, and are there any pending special assessments or reserve-fund shortfalls?
- Any open or pending special assessments — roof, HVAC, plumbing, elevator, façade? What's the per-unit balance and payoff schedule, and is the seller paying it off at close or rolling it to the buyer?
- Is there a deadline driving the sale (1031 exchange, divorce, estate, relocation)? That informs how much negotiation room exists.
- The area grade is low — what's the realistic commute time and amenity access for the typical tenant pool here? Any planned neighborhood developments (good or bad) we should know about?
- What's the average days-on-market for RENTAL listings here right now (not sales)? A rising rental-DOM trend means longer vacancies and softer asking-rent achievability than the comps imply.
- What's the recent tenant-quality profile in this submarket — average credit score on applications, eviction rate, late-payment / NSF rate, and stable-employment percentage? A property-management company in the area should have these aggregated.
- How much new apartment / multifamily construction is in the pipeline within 1–3 miles? Heavy new supply (>2% of stock underway) typically softens rents 12–24 months out; light construction supports rent growth.
Investment metrics
- 1% rule
- 0.97% ✗
- Cap rate
- 5.26%
- Cash-on-cash
- -3.70%
- DSCR
- 0.84
- GRM
- 8.6
CMA / ARV
- ARV (median comp)
- $270,704
- List price
- $239,900
- Delta
- -11.38%
- Verdict
- UNDERPRICED
- Comps
- 20 within 1.0 mi
Projected returns pro-forma
-3.0% appreciation · 0.0% rent growth · sell at horizon
- IRR
- -26.7%
- Equity multiple
- 0.13×
- Total profit
- $-58,628
- Equity at exit
- $35,770
- IRR
- -45.3%
- Equity multiple
- -0.39×
- Total profit
- $-93,362
- Equity at exit
- $20,742
Cash invested: $67,172 (down + closing). Projections, not guarantees.
Landlord ↔ Tenant lean methodology
- Overall (STATE)
- 90 Strongly Landlord-Friendly
- State Georgia
- 90 Strongly Landlord-Friendly · R+3
- County
- — inherits STATE
- City
- — inherits STATE
ZIP-level market 30328
- Rents YoY
- -0.2%
- Active inventory
- 381
- Price-to-rent
- 8.6×
Monthly cashflow live
- Estimated rent
- $2,337 high interval (Pro) →
- Mortgage (P&I)
- −$1,258
- Tax from tax record
- −$139 /mo · $1,667/yr
- Insurance
- −$100
- HOA
- −$556
- Vacancy / Maint / Mgmt
- −$491
- Net cashflow
- $-207
Break-even live
Sensitivity live
| Price | -10% $-71 | -5% $-139 | +0% $-207 | +5% $-275 | +10% $-343 |
|---|---|---|---|---|---|
| Rent | -10% $-392 | -5% $-299 | +0% $-207 | +5% $-115 | +10% $-22 |
| Rate | -1.0pp $-86 | -0.5pp $-146 | base $-207 | +0.5pp $-269 | +1.0pp $-332 |
UW: 25.0% down · 7.5% · 30yr · 1.5% tax · 5.0% vac · 8.0% maint · 8.0% mgmt
Financing live
Cash to close
- Down payment
- $59,975
- Closing costs
- $7,197
- Reserves months
- —
- Total cash needed
- —
Loan-product check · same deal, 3 products live
Conventional
25% down · 7.5% · 30yr
- Down + closing
- —
- Monthly P&I
- —
- Monthly cashflow
- —
- DSCR
- —
- Eligible?
- —
Personal DTI + credit; lowest rate.
DSCR
20% down · 8.5% · 30yr
- Down + closing
- —
- Monthly P&I
- —
- Monthly cashflow
- —
- DSCR
- —
- Eligible?
- —
No personal income docs; deal must DSCR.
Hard money
10% down · 12.0% · 12mo
- Down + closing
- —
- Monthly P&I
- —
- Monthly cashflow
- —
- DSCR
- —
- Eligible?
- —
Short-term bridge; refi at stabilization.
Rent comps 40 comps
| Address | Beds | Baths | Sqft | Rent | $/sqft | DOM | Units | Dist |
|---|---|---|---|---|---|---|---|---|
| 6851 Roswell Rd Atlanta, GA | 2.0–3.0 | 2.0 | 1525 | $2,500 | $1.64 | 26d | 3 | 0.15mi |
| 6851 Roswell Rd Atlanta, GA | 2.0–3.0 | 2.0 | 1361 | $1,950 | $1.43 | 0d | 2 | 0.15mi |
| 6851 Roswell Rd Atlanta, GA | 2.0–3.0 | 2.0 | 1440 | $2,300 | $1.60 | 4d | 2 | 0.15mi |
| 6851 Roswell Rd Atlanta, GA | 1.0–3.0 | 1.0–2.0 | 1364 | $2,500 | $1.83 | 45d | 5 | 0.15mi |
| 6851 Roswell Rd Atlanta, GA | 2.0–3.0 | 2.0 | 1364 | $2,500 | $1.83 | 7d | 4 | 0.15mi |
| 550 Abernathy Rd Sandy Springs, GA | 2.0 | 2.0 | 1280 | $1,667 | $1.30 | 0d | 5 | 0.20mi |
| 6925 Roswell Rd Atlanta, GA | 1.0–3.0 | 1.0–2.0 | 1155 | $1,920 | $1.66 | 0d | 22 | 0.32mi |
| 6940 Roswell Rd Unit 8F Atlanta, GA | 2.0 | 1.5 | 1000 | $1,850 | $1.85 | 26d | 1 | 0.34mi |
| 6940 Roswell Rd Atlanta, GA | 2.0 | 1.5 | 1000 | $1,848 | $1.85 | 45d | 2 | 0.34mi |
| 6980 Roswell Rd Atlanta, GA | 1.0–2.0 | 1.0–1.5 | 892 | $2,350 | $2.63 | 45d | 4 | 0.37mi |
| 6543 Beacon Dr Atlanta, GA | 3.0 | 3.5 | 1608 | $4,450 | $2.77 | 20d | 1 | 0.40mi |
| 6900 Roswell Rd Atlanta, GA | 2.0–3.0 | 2.5 | 1379 | $2,800 | $2.03 | 22d | 1 | 0.41mi |
| 6900 Roswell Rd Atlanta, GA | 2.0–3.0 | 2.0–2.5 | 1237 | $2,600 | $2.10 | 4d | 2 | 0.41mi |
| 6901 Glenlake Pkwy Atlanta, GA | 1.0–3.0 | 1.0–2.5 | 1105 | $2,271 | $2.05 | 0d | 20 | 0.46mi |
| 6840 Sunny Brook Ln Atlanta, GA | 3.0 | 2.0 | 1417 | $2,500 | $1.76 | 45d | 1 | 0.51mi |
| 6500 Aria Blvd Atlanta, GA | 1.0–2.0 | 1.0–2.0 | 1007 | $3,513 | $3.49 | 1d | 22 | 0.60mi |
| 6558 Roswell Rd Atlanta, GA | 2.0 | 1.0–2.0 | 1297 | $2,030 | $1.57 | 1d | 43 | 0.69mi |
| 7100 Roswell Rd Atlanta, GA | 1.0–3.0 | 1.0–2.0 | 1192 | $1,999 | $1.68 | 45d | 1 | 0.72mi |
| 901 Abernathy Rd NE Unit 1 Atlanta, GA | 2.0 | 2.0 | 1002 | $2,100 | $2.10 | 4d | 1 | 0.76mi |
| 612 Granville Ct Atlanta, GA | 2.0 | 2.0 | 1032 | $1,750 | $1.70 | 6d | 1 | 0.84mi |
| 640 Granville Ct Atlanta, GA | 2.0 | 2.0 | 1032 | $1,875 | $1.82 | 26d | 1 | 0.84mi |
| 310 Granville Ct Unit 310 Atlanta, GA | 2.0 | 2.0 | 1032 | $1,800 | $1.74 | 7d | 1 | 0.84mi |
| 613 Granville Ct Atlanta, GA | 2.0 | 2.0 | 1032 | $1,900 | $1.84 | 26d | 1 | 0.84mi |
| 601 Abingdon Way Atlanta, GA | 2.0 | 2.0 | 1400 | $1,800 | $1.29 | 7d | 1 | 0.85mi |
| 6850 Peachtree Dunwoody Rd Atlanta, GA | 2.0 | 2.0 | 1395 | $2,217 | $1.59 | 1d | 1 | 0.96mi |
| 6850 Peachtree Dunwoody Rd Atlanta, GA | 2.0 | 2.0 | 1395 | $2,384 | $1.71 | 45d | 1 | 0.96mi |
| 6850 Peachtree Dunwoody Rd Atlanta, GA | 2.0 | 2.0 | 1250 | $2,353 | $1.88 | 26d | 1 | 0.96mi |
| 7260 Roswell Rd Sandy Springs, GA | 2.0 | 1.0–2.0 | 895 | $2,811 | $3.14 | 1d | 22 | 0.97mi |
| 7150 W Peachtree Dunwoody Rd Atlanta, GA | 3.0 | 1.0–2.0 | 966 | $2,730 | $2.83 | 1d | 33 | 1.01mi |
| 6670 Castleton Dr Atlanta, GA | 3.0 | 2.0 | 1685 | $3,000 | $1.78 | 45d | 1 | 1.08mi |
| 6873 Peachtree Dunwoody Rd Atlanta, GA | 1.0–2.0 | 1.0–2.0 | 872 | $1,967 | $2.25 | 1d | 22 | 1.13mi |
| 7200 Peachtree Dunwoody Rd Atlanta, GA | 1.0–3.0 | 1.0–2.0 | 1083 | $1,840 | $1.70 | 4d | 9 | 1.19mi |
| 750 Dalrymple Rd Unit 2B Atlanta, GA | 3.0 | 2.0 | 1820 | $2,000 | $1.10 | 45d | 1 | 1.20mi |
| 100 Preston Woods Trl Atlanta, GA | 1.0–3.0 | 1.0–2.0 | 1171 | $2,271 | $1.94 | 0d | 13 | 1.21mi |
| 6400 Blue Stone Rd Sandy Springs, GA | 1.0–2.0 | 1.0–2.0 | 893 | $2,836 | $3.18 | 4d | 4 | 1.21mi |
| 6400 Blue Stone Rd Sandy Springs, GA | 1.0–2.0 | 1.0–2.0 | 893 | $2,727 | $3.05 | 14d | 1 | 1.21mi |
| 381 Hilderbrand Dr Atlanta, GA | 2.0 | 1.0 | 1061 | $2,400 | $2.26 | 45d | 1 | 1.23mi |
| 6300 Blue Stone Rd Atlanta, GA | 1.0–3.0 | 1.0–2.0 | 1058 | $4,036 | $3.81 | 1d | 17 | 1.25mi |
| 6125 Roswell Rd Atlanta, GA | 1.0–3.0 | 1.0–2.0 | 1024 | $2,684 | $2.62 | 0d | 17 | 1.28mi |
| 1265 Mount Vernon Hwy Atlanta, GA | 1.0–3.0 | 1.0–2.0 | 1169 | $2,508 | $2.14 | 0d | 28 | 1.33mi |
HOA detail condo
- Monthly dues
- $556 · $6,672/yr
- Assessments
- None detected in remarks — confirm with the listing agent.
Listing history 41 events
-
2026-06-21days on market $239,900 Active 38 DOM
-
2026-06-18price $239,900 Active 35 DOM
-
2026-06-18days on market $249,900 Active 35 DOM
-
2026-06-17days on market $249,900 Active 34 DOM
-
2026-06-16days on market $249,900 Active 33 DOM
-
2026-06-15days on market $249,900 Active 32 DOM
-
2026-06-13days on market $249,900 Active 30 DOM
-
2026-06-09days on market $249,900 Active 26 DOM
-
2026-06-08days on market $249,900 Active 25 DOM
-
2026-06-07days on market $249,900 Active 24 DOM
-
2026-06-04days on market $249,900 Active 21 DOM
-
2026-06-03days on market $249,900 Active 20 DOM
-
2026-06-01days on market $249,900 Active 18 DOM
-
2026-05-31days on market $249,900 Active 17 DOM
-
2026-05-14$249,900 Active 1720-char remark
-
2026-05-06historical $249,900 1720-char remark
-
2024-12-31historical
-
2024-12-31historical
-
2024-10-24price $264,000
-
2024-10-24price $264,000
-
2024-09-25price $274,000
-
2024-09-25price $274,000
-
2024-08-25$278,000 New
-
2024-08-25$278,000 Active
-
2019-07-01soldstatus $208,000
-
2019-06-28soldstatus $208,000 Closed
-
2019-06-28soldstatus $208,000 Sold
-
2019-05-23status Under Contract
-
2019-05-23status Pending
-
2019-05-17status Back on Market
-
2019-05-17$214,999 Active
-
2019-05-17$214,999 New
-
2019-05-17historical
-
2019-05-15status Under Contract
-
2019-05-13$214,999 New
-
2019-03-11historical
-
2018-12-04status Back on Market
-
2018-11-20status Under Contract
-
2018-11-14$145,000 New
-
2006-11-30soldstatus $129,500
-
1985-10-14soldstatus $72,500
ⓘ Source: listings_history table (triggers on properties + properties_extension) + one-shot
backfill from property_details.listing_events for pre-trigger history.
Tax reassessment forecast GA · Resets to sale price
- Current annual tax
- $1,667 · $139/mo
- Projected year-2 tax
- $2,207 · $184/mo
- Expected delta
- +$540/yr (+$45/mo · 32.4%)
ⓘ Screening estimate from a state-policy table — verify with the county assessor before closing.
Climate risk First Street
- Flood 1/10 Low FEMA zone X (unshaded) · 0% chance over 30 yrs
- Wildfire 1/10 Low
- Heat 6/10 Major 7 d/yr ≥103°F today · 20 d/yr by 30 yrs out
- Wind 4/10 Moderate 17% chance of damaging wind over 30 yrs
- Air quality 5/10 Major 6 unhealthy d/yr today · 8 by 30 yrs out
Nearby sold comps map
Loading sold comps map…
Walkable amenities ~0.75 mi
Loading nearby amenities…
Taxation est. · year 1
- Rental income
- $28,039
- − Mortgage interest
- −$13,438
- − Property taxes
- −$1,667
- − Insurance
- −$1,200
- − Repairs & maintenance
- −$2,243
- − Management
- −$2,243
- − HOA
- −$6,672
- − Depreciation
- −$6,979
- Taxable loss
- −$6,402
- Est. tax savings @ 24.0%
- +$1,537
- After-tax cash flow
- $-947/yr
For passive investors: Depreciation is non-cash, so a rental often shows a tax loss while cash-flowing — sheltering income. Rental losses are passive: they offset passive income freely, and up to $25,000/yr can offset ordinary (W-2) income if you actively participate and your MAGI is under $100k (phasing out to $0 by $150k); unused losses carry forward. On sale, claimed depreciation is recaptured at up to 25%, and gains may owe capital-gains tax (a 1031 exchange can defer both). Figures are a year-1 estimate at your 24.0% rate — not tax advice; consult a CPA.
Schools (NCES district)
- District
- Fulton County
- NCES district ID
- 1302280
- Math proficiency
- 49% ▼ -2.00%
- Reading proficiency
- 53% ▬ 0.00%
- Median HH income
- $68,035
- Composite
- 45.33/100
- National rank
- #2640
- State rank
- #12 of 174 in GA
Livability — Sandy Springs
- Score
- 73/100
- State rank
- #45
- US rank
- #5106
Category grades
Schools grade is shown separately in the Schools card above.
Census & demographics
- Census place
- Sandy Springs, GA
- County
- Fulton County · 1,094,430 people
- City population
- 108,027
- Metro
- Atlanta-Sandy Springs-Alpharetta, GA
- Population (ZIP)
- 39,508
- Household income
- $112,111
- Rent vs Own
- Severe rent burden
- 1884.0
Population outlook (Fulton County) Hauer SSP2
- Today (2025)
- 1,203,707 people
- By 2030
- 1,299,706 · +8.0%
- By 2040
- 1,488,256 · +23.6%
- By 2050
- 1,664,580 · +38.3%
- By 2075
- 2,036,072 · +69.2%
- By 2100
- 2,222,402 · +84.6%
Race, ethnicity, and origin ACS 2023
- Neighborhood character
- Diverse neighborhood (Simpson 0.61)
- Race & ethnicity
- White 59% Black 18% Asian 12% Two or more races 8% Hispanic / Latino 7%
- Hispanic origin (detail)
- Mexican 2%
- Common ancestry
- Romanian 3% Italian 3% Slovak 3%
- Foreign-born
- 17% · Canada, China, South Korea
- Languages at home
- 81% English-only · Other Indo-European 5% Spanish 4% Other Asian/Pacific 4%
Political lean MEDSL · Fulton
- 2024 margin
- Solid D (+44.9) · D 71.9% · R 27.0% · Other 1.1%
- 2008→2024 swing
- +9.8pp toward D · 2008: 35.0pp · 2024: 44.9pp
- All cycles
- 2024: D+44.9 2020: D+46.4 2016: D+42.1 2012: D+29.6 2008: D+35.0
Not yet ingested
- Civics
- —
Market trends
- HPI YoY
- ▼ -361.92%
- Current HPI
- 238.4936
- Rent YoY
- ▼ -0.24%
- Metro
- Atlanta-Sandy Springs-Alpharetta, GA
- State GDP YoY
- ▲ 2.66%
- F500 in state
- 28
Industry mix (Fortune 500 HQ in GA)
| Industry | F500 HQs | Revenue |
|---|---|---|
| Paper / Packaging | 2 | $29B |
|
||
| Retail | 1 | $160B |
|
||
| Transportation / Logistics | 1 | $91B |
|
||
| Airlines | 1 | $62B |
|
||
| Consumer Goods | 1 | $47B |
|
||
| Utilities | 1 | $25B |
|
||
Price history
+244.7% since first listed27 events — show timeline
- 2026-05-14 Listed $249,900 FMLS
- 2026-05-06 Coming Soon $249,900 FMLS
- 2024-12-31 Listing Removed — FMLS
- 2024-12-31 Listing Removed — GAMLS
- 2024-10-24 Price Changed $264,000 GAMLS
- 2024-10-24 Price Changed $264,000 FMLS
- 2024-09-25 Price Changed $274,000 GAMLS
- 2024-09-25 Price Changed $274,000 FMLS
- 2024-08-25 Listed $278,000 FMLS
- 2024-08-25 Listed $278,000 GAMLS
- 2019-07-01 Sold (Public Records) $208,000 Public Records
- 2019-06-28 Sold (MLS) $208,000 GAMLS
- 2019-06-28 Sold (MLS) $208,000 FMLS
- 2019-05-23 Pending — GAMLS
- 2019-05-23 Pending — FMLS
- 2019-05-17 Relisted — GAMLS
- 2019-05-17 Listing Removed — GAMLS
- 2019-05-17 Listed $214,999 GAMLS
- 2019-05-17 Listed $214,999 FMLS
- 2019-05-15 Pending — GAMLS
- 2019-05-13 Listed $214,999 GAMLS
- 2019-03-11 Listing Removed — GAMLS
- 2018-12-04 Relisted — GAMLS
- 2018-11-20 Pending — GAMLS
- 2018-11-14 Listed $145,000 GAMLS
- 2006-11-30 Sold (Public Records) $129,500 Public Records
- 1985-10-14 Sold (Public Records) $72,500 Public Records
Property tax history
+2.0%/yrLatest (2025): $1,667 · +3.3% YoY. Source: county tax records.
Cash-flow waterfall
monthlySold comps — $/sqft
last 12 mo · ≤1 miLoading sold comps…