6490 Cedar Hurst Trl · South Fulton, GA
Flood risk 1/10 · Minimal
- FEMA flood zone
- X (unshaded)
- Chance of flooding over 30 yrs
- 0.0%
- Est. flood insurance / yr
- $473 – $860
Fire risk 4/10 · Minor
- Est. fire insurance / yr
- $963 – $1,789
Heat risk 6/10 · Moderate
- Hot days now (above 105°F)
- 7 days/yr
- Hot days in 30 yrs
- 18 days/yr
Wind risk 6/10 · Moderate
- Chance of severe wind over 30 yrs
- 27.0%
Air-quality risk 4/10 · Minor
- Unhealthy air days now
- 4 days/yr
- Unhealthy air days in 30 yrs
- 6 days/yr
Risk factors via First Street. Map © Google.
Why this score? — see what drove the B- grade
The composite is a weighted blend of 9 inputs, each scored 0–100. Each bar is that input's sub-score; the figure is the points it added to the 100-point composite (weight × sub-score).
- Cash flow +20.4/30.0
- ARV discount +10.5/15.0
- Appreciation +10.0/10.0
- DSCR +6.5/10.0
- 1% rule +5.4/10.0
- Schools +4.5/10.0
- Rent growth +2.7/5.0
- Livability +2.5/5.0
- Condition / age +2.5/5.0
$189,000
🖨 Deal sheet (PDF) 📄 Offer letter ✓ Due diligence
Listing remarks
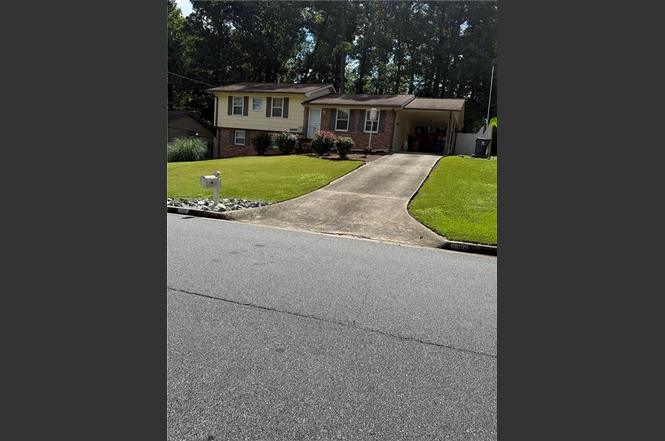
COMING SOON! Welcome to this beautifully maintained brick, 1.5 level residence nestled in a quiet, established street in South Fulton. This charming home offers timeless curbside appeal with its classic brick facade, manicured lawn, mature landscaping, and extended driveway with covered parking. Inside you will find comfortable living spaces, that is charming and very well kept. take advantage of the beautiful backyard deck, perfect for outdoor gatherings and a spacious backyard for gardening and pets. This home is a perfect location, ideally located near shopping, dining, parks and Hartsfield Jackson Atlanta International Airport and commuting throughout Metro Atlanta.
Key facts
- Covered parking
- Brick facade
- Extended driveway
Tags
Property features AI
Exterior
- Parking: Covered carport for 2 cars; Driveway parking; Kitchen-level parking access
- Utilities: Public water; Public sewer; 110-volt electric; Electricity available; Natural gas available; Phone available; Sewer available; Water available
- Home design: One and one-half levels; Brick exterior (brick 4 sides)
- Construction: Brick construction (four sides); Composition and slate roof; Slab foundation; Resale property
- Exterior features: Private entrance; Rain gutters; Deck; Patio; Paved driveway; Open parking available
Interior
- Kitchen: Eat-in kitchen; Pantry; Solid surface counters; Cabinets; Dishwasher; Disposal; Electric range
- Bedrooms: Three main-level bedrooms; Master suite on main level
- Flooring: Hardwood floors; Tile floors
- Bathrooms: One full bathroom (main level) with tub/shower combo; One half bathroom (main level)
- Heating & cooling: Central heating (electric, zoned); Central air (electric, zoned); Ceiling fans
- Interior features: 9-foot ceilings on main level; His and hers closets; Double-pane windows; No common walls
- Laundry & utility: Laundry in basement; Electric dryer hookup
Neighborhood map
What this means for you Summary
Snapshot
- This is a 3-bed/1.5-bath single-family listed at $189k.
Deal economics
- At list price, monthly cash flow is $245 ($3k/yr) — positive.
- The deal already cash-flows at list — no discount required.
- Meets the 1% rule at list price ($2k rent vs $189k).
- Cap rate 7.8% vs local median 4.6% in South Fulton — top-decile yield for the area; either an underpriced asset or a hidden risk that comps aren't pricing in. Stress-test before assuming the spread holds.
Location & tenants
- Location reads: area grade B — affects rentability + tenant quality, not the cash-flow math above.
- Fulton County (suburban): math 49% / reading 53% proficiency, ranked #12 of 174 in GA (top 7%) — acceptable for families but not a draw, mixed tenant base, ~2y average lease.
- Zoned schools: Bethune Elementary School (math 17% / reading 22%, grade F, #878 of 1,228 statewide, top 75%, 524 students, 100% FRL); Bear Creek Middle School (math 17% / reading 26%, grade F, #339 of 470 statewide, top 72%, 1,108 students, 100% FRL); Banneker High School (math 24% / reading 75%, grade D+, #28 of 424 statewide, top 7%, 1,610 students, 100% FRL) — zoned schools average 100% FRL vs 41% district-wide (59 pts higher); higher-poverty schools than district average — tighter screening recommended.
- Zoned-school proficiency averages 30% at this address vs 51% district-wide (-21 pts) — the specific schools serving this property underperform the Fulton County average; the district grade overstates school quality for this exact location.
- Market conditions: Rents flat; 655 active listings in the ZIP; 21 comparable units currently listed for rent nearby; rentals leasing fast (median 7d on market — plan ~1-2 weeks tenant-placement turnaround); 11,565 units permitted in Fulton County in 2024 (8,159 in 5+ unit buildings).
- This rent runs 35% of the median local income ($67k/yr) — at the standard rent-burdened threshold; future hikes will face affordability resistance.
Forward outlook
- In year one you build about $20k of equity ($1k loan paydown + $19k appreciation (10.0% local appreciation)).
- Fulton County population projected at +38% by 2050 — long-run rental-demand tailwind backs the buy-and-hold thesis.
- At projected returns (10.0% appreciation + 0.9% rent growth), your $53k cash investment doubles in ~3 years — after that, you're playing with house money.
- By year 2, paydown + projected appreciation supports a ~$32k cash-out refi (75% LTV) — recoverable capital for the next deal without selling this one.
Negotiation context
- Only 5 days on market — expect competitive offers; lowballing is unlikely to land.
- Current owner paid $32k; list at $189k implies a 482% gain — meaningful room to come down on a strong offer.
Risks & watch-outs
- Climate carrying-cost: major wind risk, 27% chance of damaging wind over 30y; extreme-heat days projected 7→18/yr by 2055 (HVAC capex compounding) — expect insurance premiums to compound above CPI over the hold.
Questions for the listing agent
- Built in 1972 — when were the roof, HVAC, electrical panel, plumbing, and water heater last replaced?
- Is there a deadline driving the sale (1031 exchange, divorce, estate, relocation)? That informs how much negotiation room exists.
- What's the average days-on-market for RENTAL listings here right now (not sales)? A rising rental-DOM trend means longer vacancies and softer asking-rent achievability than the comps imply.
- What's the recent tenant-quality profile in this submarket — average credit score on applications, eviction rate, late-payment / NSF rate, and stable-employment percentage? A property-management company in the area should have these aggregated.
- How much new for-sale + rental construction is in the pipeline within 1–3 miles? Heavy new supply typically softens prices + rents 12–24 months out; constrained supply supports both.
Investment metrics
- 1% rule
- 1.04% ✓
- Cap rate
- 7.85%
- Cash-on-cash
- 5.56%
- DSCR
- 1.25
- GRM
- 8.0
CMA / ARV
- ARV (on-the-fly)
- $202,686
- Comps found
- 11
Show comp detail 11 sales within ~0.75 mi
| Address | Dist | Beds/Ba | Sqft | Sold | Price | $/sf | Match |
|---|---|---|---|---|---|---|---|
| 6470 Cedar Hurst Trl | 0.03mi | 4/2.5 (+1) | 1,150 (-6%) | 9mo | $125,000 | $109 | 72 |
| 3400 Flat Shoals Rd | 0.61mi | 3/2.0 | 1,238 (+1%) | 8mo | $140,000 | $113 | 60 |
| 3510 Leisure Ln | 0.44mi | 3/2.0 | 1,297 (+6%) | 18mo | $205,000 | $158 | 52 |
| 3420 Leisure Ln | 0.44mi | 3/2.0 | 1,388 (+14%) | 11mo | $225,000 | $162 | 46 |
| 6945 Brown Dr S | 0.75mi | 3/2.0 | 1,130 (-8%) | 14mo | $190,000 | $168 | 39 |
| 3580 Keels Ln | 0.41mi | 3/2.0 | 1,368 (+12%) | 24mo | $234,999 | $172 | 39 |
| 3205 Cadiz Cir | 0.64mi | 4/2.0 (+1) | 1,309 (+7%) | 16mo | $217,000 | $166 | 38 |
| 6949 Merrywood Dr | 0.68mi | 3/3.0 | 1,150 (-6%) | 20mo | $205,000 | $178 | 36 |
| 6850 Brown Dr S | 0.71mi | 3/2.0 | 1,344 (+10%) | 20mo | $207,000 | $154 | 32 |
| 245 Adena Ln W | 0.73mi | 4/2.0 (+1) | 1,348 (+10%) | 13mo | $230,000 | $171 | 31 |
| 6878 Merrywood Dr | 0.64mi | 3/2.5 | 1,392 (+14%) | 22mo | $265,000 | $190 | 24 |
Match score weights: distance 35% · size 25% · config 20% · recency 20%. Top-matched comps best support the ARV.
Projected returns pro-forma
10.0% appreciation · 0.95% rent growth · sell at horizon
- IRR
- 27.5%
- Equity multiple
- 3.17×
- Total profit
- $114,610
- Equity at exit
- $170,266
- IRR
- 23.5%
- Equity multiple
- 7.01×
- Total profit
- $317,887
- Equity at exit
- $367,185
Cash invested: $52,920 (down + closing). Projections, not guarantees.
Landlord ↔ Tenant lean methodology
- Overall (STATE)
- 90 Strongly Landlord-Friendly
- State Georgia
- 90 Strongly Landlord-Friendly · R+3
- County
- — inherits STATE
- City
- — inherits STATE
ZIP-level market 30349
- Home prices YoY
- 4.6%
- Rents YoY
- 0.9%
- Active inventory
- 655
- Price-to-rent
- 8.0×
Monthly cashflow live
- Estimated rent
- $1,964 high interval (Pro) →
- Mortgage (P&I)
- −$991
- Tax est. 1.5%
- −$236 /mo · $2,835/yr
- Insurance
- −$79
- HOA
- −$0
- Vacancy / Maint / Mgmt
- −$412
- Net cashflow
- $245
Break-even live
Sensitivity live
| Price | -10% $376 | -5% $310 | +0% $245 | +5% $180 | +10% $115 |
|---|---|---|---|---|---|
| Rent | -10% $90 | -5% $168 | +0% $245 | +5% $323 | +10% $400 |
| Rate | -1.0pp $340 | -0.5pp $293 | base $245 | +0.5pp $196 | +1.0pp $146 |
UW: 25.0% down · 7.5% · 30yr · 1.5% tax · 5.0% vac · 8.0% maint · 8.0% mgmt
Financing live
Cash to close
- Down payment
- $47,250
- Closing costs
- $5,670
- Reserves months
- —
- Total cash needed
- —
Loan-product check · same deal, 3 products live
Conventional
25% down · 7.5% · 30yr
- Down + closing
- —
- Monthly P&I
- —
- Monthly cashflow
- —
- DSCR
- —
- Eligible?
- —
Personal DTI + credit; lowest rate.
DSCR
20% down · 8.5% · 30yr
- Down + closing
- —
- Monthly P&I
- —
- Monthly cashflow
- —
- DSCR
- —
- Eligible?
- —
No personal income docs; deal must DSCR.
Hard money
10% down · 12.0% · 12mo
- Down + closing
- —
- Monthly P&I
- —
- Monthly cashflow
- —
- DSCR
- —
- Eligible?
- —
Short-term bridge; refi at stabilization.
Rent comps 21 comps
| Address | Beds | Baths | Sqft | Rent | $/sqft | DOM | Units | Dist |
|---|---|---|---|---|---|---|---|---|
| 3800 Leisure Ln Atlanta, GA | 3.0 | 2.0 | 1198 | $2,350 | $1.96 | 23d | 1 | 0.10mi |
| 6445 Connell Rd Atlanta, GA | 3.0 | 2.0 | 1357 | $1,856 | $1.37 | 45d | 1 | 0.27mi |
| 6440 Connell Rd Atlanta, GA | 3.0 | 2.0 | 1391 | $1,695 | $1.22 | 25d | 1 | 0.30mi |
| 6500 Connell Rd Atlanta, GA | 3.0 | 2.0 | 1483 | $1,650 | $1.11 | 25d | 1 | 0.33mi |
| 325 Pointer Ct Atlanta, GA | 3.0 | 2.0 | 1474 | $1,620 | $1.10 | 6d | 1 | 0.38mi |
| 6770 Buffington Rd Union City, GA | 1.0–3.0 | 1.0–2.0 | 950 | $1,699 | $1.79 | 0d | 23 | 0.48mi |
| 3500 Keels Ln Atlanta, GA | 3.0 | 2.0 | 1272 | $1,755 | $1.38 | 3d | 1 | 0.50mi |
| 2560 Foxlair Trl Atlanta, GA | 4.0 | 2.0 | 1485 | $1,795 | $1.21 | 25d | 1 | 0.57mi |
| 4050 Morgan Rd Union City, GA | 1.0–3.0 | 1.0–2.0 | 988 | $1,750 | $1.77 | 6d | 21 | 0.74mi |
| 6985 Smoke Ridge Dr Fairburn, GA | 4.0 | 2.0 | 1054 | $1,820 | $1.73 | 0d | 1 | 0.74mi |
| 6415 El Caudillo Ct Atlanta, GA | 3.0 | 3.0 | 1498 | $2,800 | $1.87 | 6d | 1 | 0.78mi |
| 7210 Buck Creek Dr Fairburn, GA | 3.0 | 2.0 | 1140 | $1,666 | $1.46 | 0d | 1 | 0.99mi |
| 7045 Birling Dr Atlanta, GA | 4.0 | 3.0 | 1488 | $1,765 | $1.19 | 45d | 1 | 1.03mi |
| 6237 Hickory Lane Cir Union City, GA | 4.0 | 2.5 | 1420 | $2,300 | $1.62 | 25d | 1 | 1.15mi |
| 7060 Kimberly Mill Rd Atlanta, GA | 3.0 | 1.0 | 1056 | $1,425 | $1.35 | 6d | 1 | 1.16mi |
| 7060 Kimberly Mill Rd Atlanta, GA | 3.0 | 1.0 | 1056 | $1,425 | $1.35 | 0d | 1 | 1.16mi |
| 6450 Peppermill Ln Atlanta, GA | 4.0 | 2.0 | 1188 | $1,531 | $1.29 | 25d | 1 | 1.31mi |
| 6345 Peppermill Ln Atlanta, GA | 3.0 | 2.5 | 1224 | $1,800 | $1.47 | 45d | 1 | 1.31mi |
| 2820 Greenbower Ct Atlanta, GA | 3.0 | 2.0 | 1338 | $1,730 | $1.29 | 5d | 1 | 1.34mi |
| 3206 Pine Tree Trl Unit 15C Atlanta, GA | 3.0 | 2.5 | 1466 | $1,950 | $1.33 | 6d | 1 | 1.41mi |
| 4128 Flat Trl Union City, GA | 3.0 | 2.5 | 1450 | $1,700 | $1.17 | 45d | 1 | 1.47mi |
Listing history 4 events
-
2026-06-21days on market $189,000 Coming Soon 5 DOM
-
2026-06-18days on market $189,000 Coming Soon 2 DOM
-
2026-06-17remarks 678-char remark
-
2026-06-17$189,000 Coming Soon 1 DOM
ⓘ Source: listings_history table (triggers on properties + properties_extension) + one-shot
backfill from property_details.listing_events for pre-trigger history.
Climate risk First Street
- Flood 1/10 Low FEMA zone X (unshaded) · 0% chance over 30 yrs
- Wildfire 4/10 Moderate
- Heat 6/10 Major 7 d/yr ≥105°F today · 18 d/yr by 30 yrs out
- Wind 6/10 Major 27% chance of damaging wind over 30 yrs
- Air quality 4/10 Moderate 4 unhealthy d/yr today · 6 by 30 yrs out
Nearby sold comps map
Loading sold comps map…
Walkable amenities ~0.75 mi
Loading nearby amenities…
Taxation est. · year 1
- Rental income
- $23,564
- − Mortgage interest
- −$10,587
- − Property taxes
- −$2,835
- − Insurance
- −$945
- − Repairs & maintenance
- −$1,885
- − Management
- −$1,885
- − Depreciation
- −$5,498
- Taxable loss
- −$71
- Est. tax savings @ 24.0%
- +$17
- After-tax cash flow
- $2,959/yr
For passive investors: Depreciation is non-cash, so a rental often shows a tax loss while cash-flowing — sheltering income. Rental losses are passive: they offset passive income freely, and up to $25,000/yr can offset ordinary (W-2) income if you actively participate and your MAGI is under $100k (phasing out to $0 by $150k); unused losses carry forward. On sale, claimed depreciation is recaptured at up to 25%, and gains may owe capital-gains tax (a 1031 exchange can defer both). Figures are a year-1 estimate at your 24.0% rate — not tax advice; consult a CPA.
Schools (NCES district)
- District
- Fulton County
- NCES district ID
- 1302280
- Math proficiency
- 49% ▼ -2.00%
- Reading proficiency
- 53% ▬ 0.00%
- Median HH income
- $68,035
- Composite
- 45.33/100
- National rank
- #2640
- State rank
- #12 of 174 in GA
Livability — South Fulton
No livability data for this city. (Only ~50 U.S. cities are tracked.)
Census & demographics
- Census place
- South Fulton, GA
- County
- Fulton County · 1,094,430 people
- City population
- 127,674
- Metro
- Atlanta-Sandy Springs-Alpharetta, GA
- Population (ZIP)
- 79,872
- Household income
- $67,023
- Rent vs Own
- Severe rent burden
- 4258.0
Population outlook (Fulton County) Hauer SSP2
- Today (2025)
- 1,203,707 people
- By 2030
- 1,299,706 · +8.0%
- By 2040
- 1,488,256 · +23.6%
- By 2050
- 1,664,580 · +38.3%
- By 2075
- 2,036,072 · +69.2%
- By 2100
- 2,222,402 · +84.6%
Race, ethnicity, and origin ACS 2023
- Neighborhood character
- Predominantly Black (89%)
- Race & ethnicity
- Black 89% Hispanic / Latino 5% Two or more races 4% White 3%
- Foreign-born
- 9% · Canada
- Languages at home
- 88% English-only · Spanish 6% French/Haitian/Cajun 1%
Political lean MEDSL · Fulton
- 2024 margin
- Solid D (+44.9) · D 71.9% · R 27.0% · Other 1.1%
- 2008→2024 swing
- +9.8pp toward D · 2008: 35.0pp · 2024: 44.9pp
- All cycles
- 2024: D+44.9 2020: D+46.4 2016: D+42.1 2012: D+29.6 2008: D+35.0
Not yet ingested
- Civics
- —
Market trends
- HPI YoY
- ▲ 18.01%
- Current HPI
- 407.99
- Rent YoY
- ▲ 0.95%
- Metro
- Atlanta-Sandy Springs-Alpharetta, GA
- State GDP YoY
- ▲ 2.66%
- F500 in state
- 28
Industry mix (Fortune 500 HQ in GA)
| Industry | F500 HQs | Revenue |
|---|---|---|
| Paper / Packaging | 2 | $29B |
|
||
| Retail | 1 | $160B |
|
||
| Transportation / Logistics | 1 | $91B |
|
||
| Airlines | 1 | $62B |
|
||
| Consumer Goods | 1 | $47B |
|
||
| Utilities | 1 | $25B |
|
||
Price history
+481.5% since first listed2 events — show timeline
- 2026-06-16 Coming Soon $189,000 FMLS
- 1977-09-28 Sold (Public Records) $32,500 Public Records
Property tax history
-42.3%/yrLatest (2012): $2 · -42.3% YoY. Source: county tax records.
Cash-flow waterfall
monthlySold comps — $/sqft
last 12 mo · ≤1 miLoading sold comps…