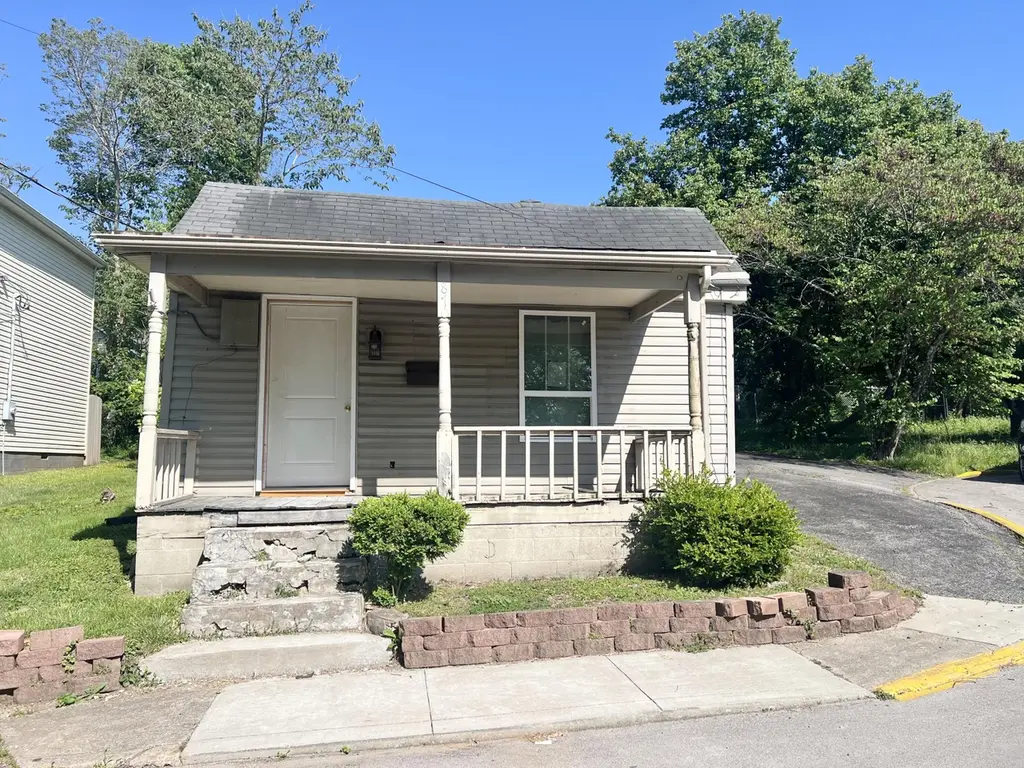
870 Lylesville St · Paris, KY
Flood risk 1/10 · Minimal
- FEMA flood zone
- X (unshaded)
- Chance of flooding over 30 yrs
- 0.0%
- Est. flood insurance / yr
- $507 – $1,088
Fire risk 3/10 · Minor
- Est. fire insurance / yr
- $839 – $1,559
Heat risk 4/10 · Minor
- Hot days now (above 102°F)
- 7 days/yr
- Hot days in 30 yrs
- 19 days/yr
Wind risk 2/10 · Minimal
- Chance of severe wind over 30 yrs
- 2.0%
Air-quality risk 2/10 · Minimal
- Unhealthy air days now
- 1 days/yr
- Unhealthy air days in 30 yrs
- 1 days/yr
Risk factors via First Street. Map © Google.
Why this score? — see what drove the B grade
The composite is a weighted blend of 9 inputs, each scored 0–100. Each bar is that input's sub-score; the figure is the points it added to the 100-point composite (weight × sub-score).
- Cash flow +29.9/30.0
- ARV discount +15.0/15.0
- DSCR +10.0/10.0
- 1% rule +7.2/10.0
- Livability +3.4/5.0
- Rent growth +2.5/5.0
- Condition / age +2.5/5.0
- Schools +1.7/10.0
- Appreciation +0.0/10.0
$91,000
🖨 Deal sheet 📄 Offer letter ✓ Due diligence
Listing remarks
Investor Special or Custom Home Opportunity! This one-story home offers 3 bedrooms, 1 full bath, and a functional layout featuring an open-concept kitchen and living area. The property is the perfect project for an investor or a homeowner looking to finish a home to their exact style and preferences. Significant improvements have been completed, including new plumbing, updated electrical, new subflooring, and drywall. The bathroom and laundry room are fully finished, allowing you to focus primarily on cosmetic upgrades. A new HVAC unit is included and ready for installation. The home will require roof repair or replacement, along with additional exterior work, making it an excellent opport
Key facts
- Updated electrical
- New plumbing
- Open-concept kitchen
Tags
Property features AI
Finance
- Other: Parcel number 026-50-04-027.00
- Financial info: Not specified
- HOA & community: Subdivision: City Limits
Exterior
- Parking: Not specified
- Security: Not specified
- Utilities: Public water; Public sewer; Electricity connected; Water service available
- Home design: Single-story house
- Construction: Vinyl siding exterior; Shingle roof; Block foundation; Built area approximately 880
- Exterior features: Shed(s) on the property; Neighborhood view
Interior
- Kitchen: Not specified
- Bedrooms: Not specified
- Flooring: Not specified
- Bathrooms: 1 full bathroom
- Heating & cooling: Has heating (type listed as Other); Cooling available (type listed as Other)
- Interior features: Crawl space basement; No fireplace; Total of 2 rooms
- Laundry & utility: Not specified
Neighborhood map
What this means for you Summary
Snapshot
- This is a 3-bed/1.0-bath other listed at $91k.
Deal economics
- At list price, monthly cash flow is $338 ($4k/yr) — positive.
- The deal already cash-flows at list — no discount required.
- Meets the 1% rule at list price ($1k rent vs $91k).
- Recommended offer: $88k (3.0% below list) — sets the bar for market timing.
- Cap rate 10.8% vs local median 3.3% in Paris — top-decile yield for the area; either an underpriced asset or a hidden risk that comps aren't pricing in. Stress-test before assuming the spread holds.
Location & tenants
- Location reads 67/100 on livability (#218 in KY) — a middle-class / working-renter tenant base. Strengths: crime A+, cost of living A+, housing A+; Watch: schools D, amenities F, commute F.
- Paris Independent (town): math 13% / reading 29% proficiency, ranked #159 of 165 in KY (top 96%) — low school quality limits family demand, transient renter base, plan for 1-2y turnover; 68% free/reduced lunch — lower-income household profile, screen leases tightly.
- Market conditions: 126 active listings in the ZIP; 4 comparable units currently listed for rent nearby; rentals at typical pace (median 21d on market — plan ~3-4 weeks tenant-placement turnaround); 90 units permitted in Bourbon County in 2024 (0 in 5+ unit buildings).
Forward outlook
- Local home prices are declining (-3.0%/yr); year-one equity from $629 of loan paydown is wiped out by about $3k of value loss. Plan a longer hold.
- At projected returns (-3.0% appreciation + 3.0% rent growth), your $25k cash investment doubles in ~8 years — after that, you're playing with house money.
Negotiation context
- It's been on market 44 days — a 3% lower offer ($88k) is reasonable based on typical stale-listing flexibility.
- 2 sale attempts since 2y ago; this cycle's ask has dropped $8k (8%) from the opening price — seller is motivated, your offer sets the floor, not the list.
Questions for the listing agent
- It's been on market 44 days. Have you received any prior offers? Is the seller open to a 3% concession, seller financing, or rate buy-down credit?
- Is there a deadline driving the sale (1031 exchange, divorce, estate, relocation)? That informs how much negotiation room exists.
- Schools are D-rated, which usually means shorter tenancies and higher turnover. Who's the typical renter profile here, and what's been the actual vacancy rate?
- What's the average days-on-market for RENTAL listings here right now (not sales)? A rising rental-DOM trend means longer vacancies and softer asking-rent achievability than the comps imply.
- What's the recent tenant-quality profile in this submarket — average credit score on applications, eviction rate, late-payment / NSF rate, and stable-employment percentage? A property-management company in the area should have these aggregated.
- How much new for-sale + rental construction is in the pipeline within 1–3 miles? Heavy new supply typically softens prices + rents 12–24 months out; constrained supply supports both.
Investment metrics
- 1% rule
- 1.22% ✓
- Cap rate
- 10.75%
- Cash-on-cash
- 15.93%
- DSCR
- 1.71
- GRM
- 6.9
CMA / ARV
- ARV (median comp)
- $118,030
- List price
- $91,000
- Delta
- -22.90%
- Verdict
- UNDERPRICED
- Comps
- 20 within 1.0 mi
Projected returns pro-forma
-3.0% appreciation · 3.0% rent growth · sell at horizon
- IRR
- 6.8%
- Equity multiple
- 1.27×
- Total profit
- $6,754
- Equity at exit
- $13,568
- IRR
- 16.1%
- Equity multiple
- 2.31×
- Total profit
- $33,452
- Equity at exit
- $7,868
Cash invested: $25,480 (down + closing). Projections, not guarantees.
Landlord ↔ Tenant lean methodology
- Overall (STATE)
- 83 Strongly Landlord-Friendly
- State Kentucky
- 83 Strongly Landlord-Friendly · R+16
- County
- — inherits STATE
- City
- — inherits STATE
ZIP-level market 40361
- Home prices YoY
- -23.1%
- Active inventory
- 126
- Price-to-rent
- 6.9×
Monthly cashflow live
- Estimated rent
- $1,106 medium interval (Pro) →
- Mortgage (P&I)
- −$477
- Tax from tax record
- −$20 /mo · $245/yr
- Insurance
- −$38
- HOA
- −$0
- Vacancy / Maint / Mgmt
- −$232
- Net cashflow
- $338
Break-even live
UW: 25.0% down · 7.5% · 30yr · 1.5% tax · 5.0% vac · 8.0% maint · 8.0% mgmt
Financing live
Cash to close
- Down payment
- $22,750
- Closing costs
- $2,730
- Reserves months
- —
- Total cash needed
- —
Loan-product check · same deal, 3 products live
Conventional
25% down · 7.5% · 30yr
- Down + closing
- —
- Monthly P&I
- —
- Monthly cashflow
- —
- DSCR
- —
- Eligible?
- —
Personal DTI + credit; lowest rate.
DSCR
20% down · 8.5% · 30yr
- Down + closing
- —
- Monthly P&I
- —
- Monthly cashflow
- —
- DSCR
- —
- Eligible?
- —
No personal income docs; deal must DSCR.
Hard money
10% down · 12.0% · 12mo
- Down + closing
- —
- Monthly P&I
- —
- Monthly cashflow
- —
- DSCR
- —
- Eligible?
- —
Short-term bridge; refi at stabilization.
Rent comps 4 comps
| Address | Beds | Baths | Sqft | Rent | $/sqft | DOM | Units | Dist |
|---|---|---|---|---|---|---|---|---|
| 1207 High St Paris, KY | 2.0 | 1.0 | 846 | $950 | $1.12 | 13d | 1 | 0.26mi |
| 552 Vine St Paris, KY | 2.0 | 1.0 | 900 | $750 | $0.83 | 21d | 1 | 0.60mi |
| 142 Bradford Dr Paris, KY | 2.0 | 1.0 | 1023 | $925 | $0.90 | 21d | 1 | 1.41mi |
| 151 Bradford Dr Paris, KY | 2.0 | 1.5 | 1023 | $895 | $0.87 | 21d | 1 | 1.41mi |
Listing history 18 events
-
2026-06-18days on market $91,000 Active 44 DOM
-
2026-06-17days on market $91,000 Active 43 DOM
-
2026-06-16days on market $91,000 Active 42 DOM
-
2026-06-15days on market $91,000 Active 41 DOM
-
2026-06-14days on market $91,000 Active 39 DOM
-
2026-06-13days on market $91,000 Active 38 DOM
-
2026-06-10days on market $91,000 Active 36 DOM
-
2026-06-09days on market $91,000 Active 35 DOM
-
2026-06-08days on market $91,000 Active 34 DOM
-
2026-06-07pricedays on market $91,000 Active 33 DOM
-
2026-06-03days on market $99,000 Active 29 DOM
-
2026-06-02days on market $99,000 Active 28 DOM
-
2026-06-01days on market $99,000 Active 27 DOM
-
2026-05-31days on market $99,000 Active 26 DOM
-
2026-05-31days on market $99,000 Active 25 DOM
-
2026-05-04$99,000 Active 928-char remark
-
2024-03-20historical
-
2024-03-15$70,000 Active
ⓘ Source: listings_history table (triggers on properties + properties_extension) + one-shot
backfill from property_details.listing_events for pre-trigger history.
Tax reassessment forecast KY · Resets to sale price
- Current annual tax
- $245 · $20/mo
- Projected year-2 tax
- $783 · $65/mo
- Expected delta
- +$537/yr (+$45/mo · 218.8%)
ⓘ Screening estimate from a state-policy table — verify with the county assessor before closing.
Climate risk First Street
- Flood 1/10 Low FEMA zone X (unshaded) · 0% chance over 30 yrs
- Wildfire 3/10 Moderate
- Heat 4/10 Moderate 7 d/yr ≥102°F today · 19 d/yr by 30 yrs out
- Wind 2/10 Low 2% chance of damaging wind over 30 yrs
- Air quality 2/10 Low 1 unhealthy d/yr today · 1 by 30 yrs out
Nearby sold comps map
Loading sold comps map…
Walkable amenities ~0.75 mi
Loading nearby amenities…
Taxation est. · year 1
- Rental income
- $13,273
- − Mortgage interest
- −$5,097
- − Property taxes
- −$245
- − Insurance
- −$455
- − Repairs & maintenance
- −$1,062
- − Management
- −$1,062
- − Depreciation
- −$2,647
- Taxable income
- $2,704
- Est. tax owed @ 24.0%
- −$649
- After-tax cash flow
- $3,409/yr
For passive investors: Depreciation is non-cash, so a rental often shows a tax loss while cash-flowing — sheltering income. Rental losses are passive: they offset passive income freely, and up to $25,000/yr can offset ordinary (W-2) income if you actively participate and your MAGI is under $100k (phasing out to $0 by $150k); unused losses carry forward. On sale, claimed depreciation is recaptured at up to 25%, and gains may owe capital-gains tax (a 1031 exchange can defer both). Figures are a year-1 estimate at your 24.0% rate — not tax advice; consult a CPA.
Schools (NCES district)
- District
- Paris Independent
- NCES district ID
- 2104710
- Math proficiency
- 13% ▼ -17.00%
- Reading proficiency
- 29% ▼ -7.00%
- Median HH income
- $34,822
- Composite
- 17.23/100
- National rank
- #9096
- State rank
- #159 of 165 in KY
Livability — Paris
- Score
- 67/100
- State rank
- #218
- US rank
- #10589
Category grades
Schools grade is shown separately in the Schools card above.
Census & demographics
- Census place
- Paris, KY
- County
- Bourbon County · 18,361 people
- City population
- 18,361
- Metro
- Lexington-Fayette, KY
- Population (ZIP)
- 18,361
- Household income
- $63,333
- Rent vs Own
- Severe rent burden
- 509.0
Population outlook (Bourbon County) Hauer SSP2
- Today (2025)
- 20,485 people
- By 2030
- 20,559 · +0.4%
- By 2040
- 20,491 · +0.0%
- By 2050
- 20,065 · -2.1%
- By 2075
- 19,173 · -6.4%
- By 2100
- 16,646 · -18.7%
Race, ethnicity, and origin ACS 2023
- Neighborhood character
- Predominantly White (83%)
- Race & ethnicity
- White 83% Hispanic / Latino 8% Two or more races 6% Black 5%
- Hispanic origin (detail)
- Mexican 6% Cuban 1%
- Common ancestry
- Slovak 2% Serbian 2% Iranian 2%
- Foreign-born
- 4% · Canada, Dominican Republic
- Languages at home
- 94% English-only · Spanish 5% French/Haitian/Cajun 1%
Political lean MEDSL · Bourbon
- 2024 margin
- Solid R (+33.5) · D 32.4% · R 65.9% · Other 1.7%
- 2008→2024 swing
- -16.3pp toward R · 2008: -17.2pp · 2024: -33.5pp
- All cycles
- 2024: R+33.5 2020: R+30.0 2016: R+31.6 2012: R+20.4 2008: R+17.2
Not yet ingested
- Civics
- —
Market trends
- HPI YoY
- ▼ -72.90%
- Current HPI
- 241.9393
- Rent YoY
- —
- Metro
- Lexington-Fayette, KY
- State GDP YoY
- ▲ 1.81%
- F500 in state
- 4
Industry mix (Fortune 500 HQ in KY)
| Industry | F500 HQs | Revenue |
|---|---|---|
| Healthcare | 1 | $118B |
|
||
| Food / Beverage | 1 | $7B |
|
||
Price history
+30.0% since first listed4 events — show timeline
- 2026-06-04 Price Changed $91,000 ImagineMLS
- 2026-05-04 Listed $99,000 ImagineMLS
- 2024-03-20 Listing Removed — ImagineMLS
- 2024-03-15 Listed $70,000 ImagineMLS
Property tax history
+7.4%/yrLatest (2025): $245 · -2.6% YoY. Source: county tax records.
Cash-flow waterfall
monthlySold comps — $/sqft
last 12 mo · ≤1 miLoading sold comps…