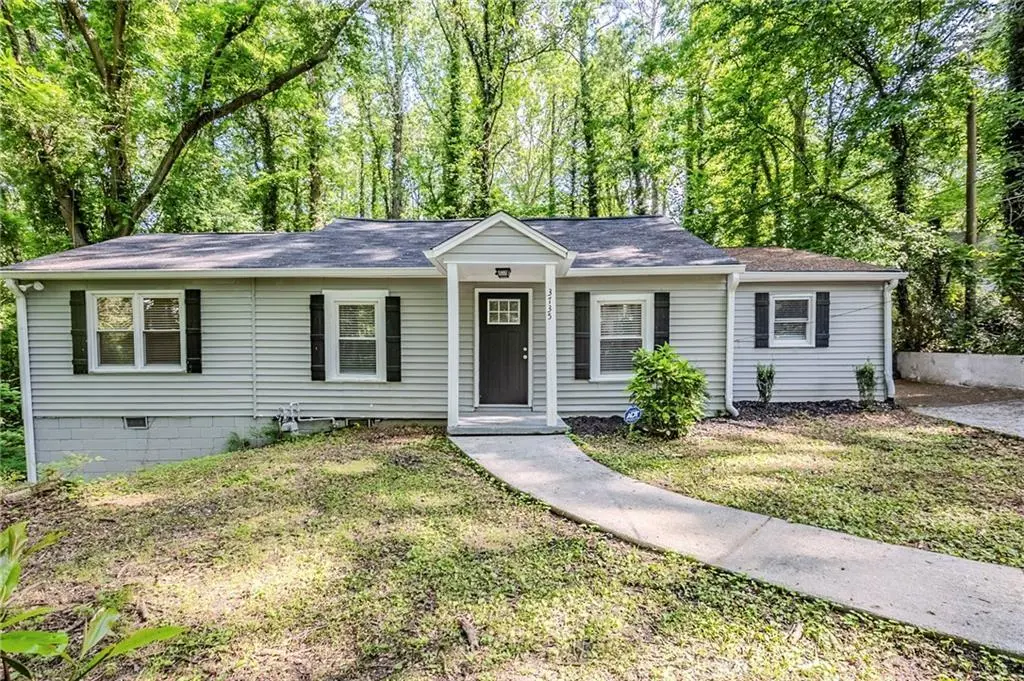
3735 Boulder Park Dr SW · Atlanta, GA
Flood risk 1/10 · Minimal
- FEMA flood zone
- X (unshaded)
- Chance of flooding over 30 yrs
- 0.0%
- Est. flood insurance / yr
- $473 – $860
Fire risk 3/10 · Minor
- Est. fire insurance / yr
- $963 – $1,789
Heat risk 5/10 · Moderate
- Hot days now (above 103°F)
- 6 days/yr
- Hot days in 30 yrs
- 15 days/yr
Wind risk 4/10 · Minor
- Chance of severe wind over 30 yrs
- 18.0%
Air-quality risk 3/10 · Minor
- Unhealthy air days now
- 3 days/yr
- Unhealthy air days in 30 yrs
- 3 days/yr
Risk factors via First Street. Map © Google.
Why this score? — see what drove the D+ grade
The composite is a weighted blend of 9 inputs, each scored 0–100. Each bar is that input's sub-score; the figure is the points it added to the 100-point composite (weight × sub-score).
- ARV discount +15.0/15.0
- Cash flow +13.2/30.0
- Livability +4.2/5.0
- 1% rule +4.0/10.0
- DSCR +4.0/10.0
- Rent growth +3.2/5.0
- Schools +2.7/10.0
- Condition / age +2.5/5.0
- Appreciation +0.0/10.0
$223,500
🖨 Deal sheet 📄 Offer letter ✓ Due diligence
Listing remarks MLS
Welcome to this beautifully maintained 5-bedroom, 3-bathroom single-story home that blends comfort, style, and functionality. Step inside to discover an open-concept layout enhanced by elegant hardwood and tile flooring throughout. The heart of the home is the gourmet kitchen, featuring crisp white cabinetry, luxurious stone countertops, and sleek stainless steel appliances - perfect for everyday living and entertaining. Each bathroom offers modern finishes and ample space, while the five generously sized bedrooms provide flexibility for family, guests, or a home office. Outside, enjoy the expansive backyard ideal for gatherings or relaxation, a charming front porch for your morning coffee, and a private driveway offering convenient parking. This move-in-ready gem offers the perfect blend of indoor charm and outdoor space - don't miss your opportunity to make it yours!
Key facts
- 0.69 acre lot
- 2 parking spots
- Built 1940
Neighborhood map
What this means for you Summary
Snapshot
- This is a 3-bed/2.0-bath single-family listed at $224k.
Deal economics
- At list price, monthly cash flow is $-5 ($-61/yr) — negative.
- To cash-flow at today's rent, offer at most $223k (0.4% below list).
- To meet the 1% rule (rent ≥ 1% of price), the offer needs to be $201k (10.1% below list).
- Recommended offer: $201k (10.1% below list) — sets the bar for 1% rule.
- Cap rate 6.3% vs local median 3.1% in Atlanta — top-decile yield for the area; either an underpriced asset or a hidden risk that comps aren't pricing in. Stress-test before assuming the spread holds.
Location & tenants
- Location reads 83/100 on livability (#6 in GA, #919 nationally) — a professional / high-income tenant draw. Strengths: amenities A+, commute A+, housing A+; Watch: schools C-, cost of living C-.
- Atlanta Public Schools (urban): math 28% / reading 35% proficiency, ranked #80 of 174 in GA (top 46%) — families likely to look elsewhere, expect single-tenant / working-renter base with shorter leases; 71% free/reduced lunch — lower-income household profile, screen leases tightly.
- Market conditions: Rents rising (+2.6%/yr); 483 active listings in the ZIP; 39 comparable units currently listed for rent nearby; rentals at typical pace (median 25d on market — plan ~3-4 weeks tenant-placement turnaround); 11,565 units permitted in Fulton County in 2024 (8,159 in 5+ unit buildings).
- This rent runs 39% of the median local income ($63k/yr) — at the standard rent-burdened threshold; future hikes will face affordability resistance.
Forward outlook
- Local home prices are declining (-3.0%/yr); year-one equity from $2k of loan paydown is wiped out by about $7k of value loss. Plan a longer hold.
- Fulton County population projected at +38% by 2050 — long-run rental-demand tailwind backs the buy-and-hold thesis.
Negotiation context
- It's been on market 79 days — a 6% lower offer ($210k) is reasonable based on typical stale-listing flexibility.
- 10 sale attempts since 7y ago with the ask held roughly flat each time — persistent listings suggest the price (not the market) is what's stuck; bring a comps-based counter.
- Current owner paid $165k; 35% above their basis — modest negotiation headroom, anchor on the comps not their cost.
Risks & watch-outs
- Watch-outs: built in 1940 — expect roof / HVAC / electrical / plumbing capex.
- Climate carrying-cost: extreme-heat days projected 6→15/yr by 2055 (HVAC capex compounding) — expect insurance premiums to compound above CPI over the hold.
Questions for the listing agent
- What do current leases actually rent for vs. the listed asking? Can we see a recent rent roll and the last 12 months of T-12 income?
- It's been on market 79 days. Have you received any prior offers? Is the seller open to a 10% concession, seller financing, or rate buy-down credit?
- Built in 1940 — when were the roof, HVAC, electrical panel, plumbing, and water heater last replaced?
- Why hasn't it sold? Are there any deal-killer items the seller is aware of (foundation, flood, title, zoning, code violations)?
- Is there a deadline driving the sale (1031 exchange, divorce, estate, relocation)? That informs how much negotiation room exists.
- The area grade is low — what's the realistic commute time and amenity access for the typical tenant pool here? Any planned neighborhood developments (good or bad) we should know about?
- What's the average days-on-market for RENTAL listings here right now (not sales)? A rising rental-DOM trend means longer vacancies and softer asking-rent achievability than the comps imply.
- What's the recent tenant-quality profile in this submarket — average credit score on applications, eviction rate, late-payment / NSF rate, and stable-employment percentage? A property-management company in the area should have these aggregated.
- How much new for-sale + rental construction is in the pipeline within 1–3 miles? Heavy new supply typically softens prices + rents 12–24 months out; constrained supply supports both.
Investment metrics
- 1% rule
- 0.90% ✗
- Cap rate
- 6.27%
- Cash-on-cash
- -0.10%
- DSCR
- 1.00
- GRM
- 9.3
CMA / ARV
- ARV (median comp)
- $272,015
- List price
- $223,500
- Delta
- -17.84%
- Verdict
- UNDERPRICED
- Comps
- 20 within 1.0 mi
Show comp detail 12 sales within ~0.75 mi
| Address | Dist | Beds/Ba | Sqft | Sold | Price | $/sf | Match |
|---|---|---|---|---|---|---|---|
| 225 Fairburn Rd SW | 0.08mi | 2/2.0 (-1) | 1,686 (-2%) | 2mo | $80,000 | $47 | 87 |
| 238 Howell Dr SW | 0.34mi | 4/2.0 (+1) | 1,743 (+2%) | 3mo | $220,000 | $126 | 74 |
| 3888 Boulder Park Dr SW | 0.37mi | 3/2.5 | 1,650 (-4%) | 7mo | $380,000 | $230 | 68 |
| 580 Morrow Ln SW | 0.64mi | 3/2.5 | 1,740 (+2%) | 4mo | $340,000 | $195 | 62 |
| 202 Nathan Rd SW | 0.51mi | 4/2.5 (+1) | 1,792 (+4%) | 1mo | $171,000 | $95 | 61 |
| 259 Tarragon Way SW | 0.48mi | 4/3.0 (+1) | 1,805 (+5%) | 6mo | $250,000 | $139 | 54 |
| 3897 Ester Dr SW | 0.53mi | 3/2.0 | 1,562 (-9%) | 9mo | $232,000 | $149 | 53 |
| 852 Regal Ln SW | 0.56mi | 3/2.5 | 1,938 (+13%) | 2mo | $320,000 | $165 | 48 |
| 605 Lofty Ln SW | 0.54mi | 3/2.5 | 1,952 (+14%) | 3mo | $285,000 | $146 | 48 |
| 583 Tarragon Ct SW | 0.67mi | 3/2.5 | 1,507 (-12%) | 4mo | $225,000 | $149 | 44 |
| 273 Fennel Way SW | 0.55mi | 4/2.0 (+1) | 1,474 (-14%) | 6mo | $200,000 | $136 | 41 |
| 587 Tarragon Way SW | 0.68mi | 3/2.0 | 1,458 (-15%) | 4mo | $239,000 | $164 | 40 |
Match score weights: distance 35% · size 25% · config 20% · recency 20%. Top-matched comps best support the ARV.
Projected returns pro-forma
-3.0% appreciation · 2.63% rent growth · sell at horizon
- IRR
- -16.9%
- Equity multiple
- 0.41×
- Total profit
- $-37,226
- Equity at exit
- $33,325
- IRR
- -9.4%
- Equity multiple
- 0.43×
- Total profit
- $-35,627
- Equity at exit
- $19,324
Cash invested: $62,580 (down + closing). Projections, not guarantees.
Landlord ↔ Tenant lean methodology
- Overall (STATE)
- 90 Strongly Landlord-Friendly
- State Georgia
- 90 Strongly Landlord-Friendly · R+3
- County
- — inherits STATE
- City
- — inherits STATE
ZIP-level market 30331
- Home prices YoY
- -34.2%
- Rents YoY
- 2.6%
- Active inventory
- 483
- Price-to-rent
- 9.3×
Monthly cashflow live
- Estimated rent
- $2,009 high interval (Pro) →
- Mortgage (P&I)
- −$1,172
- Tax from tax record
- −$327 /mo · $3,927/yr
- Insurance
- −$93
- HOA
- −$0
- Vacancy / Maint / Mgmt
- −$422
- Net cashflow
- $-5
Break-even live
UW: 25.0% down · 7.5% · 30yr · 1.5% tax · 5.0% vac · 8.0% maint · 8.0% mgmt
Financing live
Cash to close
- Down payment
- $55,875
- Closing costs
- $6,705
- Reserves months
- —
- Total cash needed
- —
Loan-product check · same deal, 3 products live
Conventional
25% down · 7.5% · 30yr
- Down + closing
- —
- Monthly P&I
- —
- Monthly cashflow
- —
- DSCR
- —
- Eligible?
- —
Personal DTI + credit; lowest rate.
DSCR
20% down · 8.5% · 30yr
- Down + closing
- —
- Monthly P&I
- —
- Monthly cashflow
- —
- DSCR
- —
- Eligible?
- —
No personal income docs; deal must DSCR.
Hard money
10% down · 12.0% · 12mo
- Down + closing
- —
- Monthly P&I
- —
- Monthly cashflow
- —
- DSCR
- —
- Eligible?
- —
Short-term bridge; refi at stabilization.
Rent comps 39 comps
| Address | Beds | Baths | Sqft | Rent | $/sqft | DOM | Units | Dist |
|---|---|---|---|---|---|---|---|---|
| 415 Fairburn Rd SW Atlanta, GA | 1.0–3.0 | 1.0–2.0 | 890 | $1,490 | $1.67 | 2d | 31 | 0.41mi |
| 841 Ambient Way SW Atlanta, GA | 2.0 | 2.5 | 1344 | $1,895 | $1.41 | 17d | 1 | 0.41mi |
| 755 Crestwell Cir SW Atlanta, GA | 2.0 | 2.5 | 1546 | $1,800 | $1.16 | 24d | 1 | 0.42mi |
| 586 Oakside Dr SW Unit A Atlanta, GA | 3.0 | 1.0 | 1075 | $1,325 | $1.23 | 15d | 1 | 0.43mi |
| 586 Oakside Dr SW Unit B Atlanta, GA | 2.0 | 1.0 | 1075 | $1,065 | $0.99 | 15d | 1 | 0.43mi |
| 832 Ambient Way SW Atlanta, GA | 2.0 | 2.5 | 1500 | $2,250 | $1.50 | 24d | 1 | 0.44mi |
| 722 Crestwell Cir #722 Atlanta, GA | 2.0 | 3.0 | 1440 | $2,279 | $1.58 | 21d | 1 | 0.46mi |
| 887 Ambient Way SW Atlanta, GA | 2.0 | 2.5 | 1344 | $2,250 | $1.67 | 24d | 1 | 0.46mi |
| 3915 Basil Way SW Atlanta, GA | 3.0 | 2.0 | 1287 | $2,600 | $2.02 | 24d | 1 | 0.46mi |
| 897 Ambient Way SW Atlanta, GA | 2.0 | 2.5 | 1500 | $2,155 | $1.44 | 24d | 1 | 0.48mi |
| 3919 Wisteria Ln SW Atlanta, GA | 4.0 | 2.0 | 1126 | $1,730 | $1.54 | 14d | 1 | 0.48mi |
| 708 Crestwell Cir SW Atlanta, GA | 2.0 | 2.5 | 1236 | $1,645 | $1.33 | 24d | 1 | 0.49mi |
| 900 Society Cir SW Atlanta, GA | 4.0 | 3.5 | 1710 | $2,500 | $1.46 | 24d | 1 | 0.49mi |
| 648 Providence Pl SW #37 Atlanta, GA | 3.0 | 3.5 | 1416 | $2,195 | $1.55 | 24d | 1 | 0.54mi |
| 778 Nehemiah Ln SW Atlanta, GA | 2.0 | 2.5 | 1576 | $1,950 | $1.24 | 24d | 1 | 0.55mi |
| 350 Fennel Way SW Atlanta, GA | 4.0 | 2.0 | 1450 | $1,500 | $1.03 | 21d | 1 | 0.55mi |
| 658 Providence Pl SW Atlanta, GA | 3.0 | 3.5 | 1571 | $2,100 | $1.34 | 24d | 1 | 0.57mi |
| 95 Howell Dr SW Atlanta, GA | 3.0 | 2.5 | 1840 | $1,840 | $1.00 | 14d | 1 | 0.59mi |
| 87 Howell Dr SW Atlanta, GA | 3.0 | 2.5 | 1840 | $2,700 | $1.47 | 24d | 1 | 0.59mi |
| 975 Society Cir SW Atlanta, GA | 4.0 | 3.5 | 1700 | $2,350 | $1.38 | 2d | 1 | 0.61mi |
| 513 Constellation Overlook SW Atlanta, GA | 3.0 | 2.5 | 1446 | $2,300 | $1.59 | 24d | 1 | 0.64mi |
| 494 Plainville Dr SW Atlanta, GA | 3.0 | 2.0 | 1567 | $2,400 | $1.53 | 24d | 1 | 0.70mi |
| 440 Dartmouth Dr SW Atlanta, GA | 4.0 | 3.0 | 1148 | $1,795 | $1.56 | 21d | 1 | 0.76mi |
| 4172 Renfrew Ct SW Atlanta, GA | 4.0 | 2.0 | 1136 | $1,200 | $1.06 | 8d | 1 | 0.76mi |
| 3616 Utoy Dr SW Atlanta, GA | 3.0 | 3.5 | 1496 | $1,950 | $1.30 | 44d | 1 | 0.76mi |
| 40 Candlelight Ln SW Unit A Atlanta, GA | 2.0 | 2.0 | 1098 | $1,500 | $1.37 | 24d | 1 | 0.81mi |
| 40 Candlelight Ln SW Apt B Atlanta, GA | 3.0 | 3.0 | 1274 | $1,800 | $1.41 | 24d | 1 | 0.81mi |
| 3354 Delmar Ln NW Atlanta, GA | 3.0 | 2.0 | 1170 | $1,700 | $1.45 | 24d | 1 | 0.87mi |
| 3230 Cushman Cir SW Atlanta, GA | 2.0 | 1.0 | 1143 | $1,200 | $1.05 | 8d | 1 | 0.97mi |
| 206 Harwell Rd NW Atlanta, GA | 4.0 | 2.0 | 2000 | $2,023 | $1.01 | 21d | 1 | 1.00mi |
| 3311 Rabun Dr SW Atlanta, GA | 3.0 | 2.0 | 1523 | $2,350 | $1.54 | 24d | 1 | 1.03mi |
| 751 Fairburn Rd SW Atlanta, GA | 1.0–3.0 | 1.0–2.0 | 1162 | $2,170 | $1.87 | 3d | 32 | 1.09mi |
| 3188 Delmar Ln NW Atlanta, GA | 3.0 | 2.0 | 1124 | $2,400 | $2.14 | 24d | 1 | 1.15mi |
| 3606 Ginnis Dr SW #8 Atlanta, GA | 2.0 | 2.5 | 1224 | $1,411 | $1.15 | 8d | 1 | 1.21mi |
| 470 Bolton Rd NW Unit D1 Atlanta, GA | 2.0 | 1.5 | 1100 | $1,395 | $1.27 | 24d | 1 | 1.25mi |
| 451 Fairlock Ln NW Atlanta, GA | 3.0 | 1.0 | 1141 | $1,450 | $1.27 | 24d | 1 | 1.29mi |
| 3590 Collier Dr NW Atlanta, GA | 4.0 | 4.0 | 1110 | $1,100 | $0.99 | 11d | 1 | 1.34mi |
| 3051 Delmar Ln NW Atlanta, GA | 3.0 | 2.0 | 1971 | $2,500 | $1.27 | 24d | 1 | 1.40mi |
| 4341 Cascade Rd SW Atlanta, GA | 1.0–3.0 | 1.0–2.0 | 959 | $1,535 | $1.60 | 44d | 1 | 1.48mi |
Listing history 35 events
-
2026-05-31status $223,500 Pending 79 DOM
-
2026-03-12$223,500 New 887-char remark
Show marketing remark (905 chars)
Welcome to this beautifully maintained 5-bedroom, 3-bathroom single-story home that blends comfort, style, and functionality. Step inside to discover an open-concept layout enhanced by elegant hardwood and tile flooring throughout. The heart of the home is the gourmet kitchen, featuring crisp white cabinetry, luxurious stone countertops, and sleek stainless steel appliances — perfect for everyday living and entertaining. Each bathroom offers modern finishes and ample space, while the five generously sized bedrooms provide flexibility for family, guests, or a home office. Outside, enjoy the expansive backyard ideal for gatherings or relaxation, a charming front porch for your morning coffee, and a private driveway offering convenient parking. This move-in-ready gem offers the perfect blend of indoor charm and outdoor space — don’t miss your opportunity to make it yours!
-
2026-03-12$223,500 Active 905-char remark
Show marketing remark (905 chars)
Welcome to this beautifully maintained 5-bedroom, 3-bathroom single-story home that blends comfort, style, and functionality. Step inside to discover an open-concept layout enhanced by elegant hardwood and tile flooring throughout. The heart of the home is the gourmet kitchen, featuring crisp white cabinetry, luxurious stone countertops, and sleek stainless steel appliances — perfect for everyday living and entertaining. Each bathroom offers modern finishes and ample space, while the five generously sized bedrooms provide flexibility for family, guests, or a home office. Outside, enjoy the expansive backyard ideal for gatherings or relaxation, a charming front porch for your morning coffee, and a private driveway offering convenient parking. This move-in-ready gem offers the perfect blend of indoor charm and outdoor space — don’t miss your opportunity to make it yours!
-
2026-03-11historical
-
2026-03-10historical
-
2025-05-07$240,000 New
-
2025-05-07$240,000 Active
-
2024-01-02historical $1,595
-
2023-12-27$1,595
-
2020-10-27soldstatus $165,000
-
2020-10-02soldstatus $165,000 Closed
-
2020-10-02soldstatus $165,000 Sold
-
2020-09-14status Under Contract
-
2020-09-14status Pending
-
2020-09-02price $189,000
-
2020-09-01price $189,000
-
2020-08-20price $215,000
-
2020-08-20price $215,000
-
2020-08-14price $225,000
-
2020-08-14price $225,000
-
2020-08-09price $239,900
-
2020-08-09price $239,900
-
2020-08-03$249,900 Active
-
2020-08-03$249,900 New
-
2020-07-16historical
-
2020-07-15price $225,000
-
2020-05-21$249,900 New
-
2019-09-11soldstatus $78,000
-
2019-08-26soldstatus $78,000 Closed
-
2019-08-08status Pending
-
2019-08-05price $84,000
-
2019-07-22status Active
-
2019-07-11status Pending
-
2019-06-28$85,000 Active
-
2017-12-15soldstatus $70,000
ⓘ Source: listings_history table (triggers on properties + properties_extension) + one-shot
backfill from property_details.listing_events for pre-trigger history.
Tax reassessment forecast GA · Resets to sale price
- Current annual tax
- $3,927 · $327/mo
- Projected year-2 tax
- $3,927 · $327/mo
- Expected delta
- $0/yr ($0/mo · 0.0%)
ⓘ Screening estimate from a state-policy table — verify with the county assessor before closing.
Climate risk First Street
- Flood 1/10 Low FEMA zone X (unshaded) · 0% chance over 30 yrs
- Wildfire 3/10 Moderate
- Heat 5/10 Major 6 d/yr ≥103°F today · 15 d/yr by 30 yrs out
- Wind 4/10 Moderate 18% chance of damaging wind over 30 yrs
- Air quality 3/10 Moderate 3 unhealthy d/yr today · 3 by 30 yrs out
Nearby sold comps map
Loading sold comps map…
Walkable amenities ~0.75 mi
Loading nearby amenities…
Taxation est. · year 1
- Rental income
- $24,112
- − Mortgage interest
- −$12,519
- − Property taxes
- −$3,927
- − Insurance
- −$1,118
- − Repairs & maintenance
- −$1,929
- − Management
- −$1,929
- − Depreciation
- −$6,502
- Taxable loss
- −$3,812
- Est. tax savings @ 24.0%
- +$915
- After-tax cash flow
- $854/yr
For passive investors: Depreciation is non-cash, so a rental often shows a tax loss while cash-flowing — sheltering income. Rental losses are passive: they offset passive income freely, and up to $25,000/yr can offset ordinary (W-2) income if you actively participate and your MAGI is under $100k (phasing out to $0 by $150k); unused losses carry forward. On sale, claimed depreciation is recaptured at up to 25%, and gains may owe capital-gains tax (a 1031 exchange can defer both). Figures are a year-1 estimate at your 24.0% rate — not tax advice; consult a CPA.
Schools (NCES district)
- District
- Atlanta Public Schools
- NCES district ID
- 1300120
- Math proficiency
- 28% ▼ -6.00%
- Reading proficiency
- 35% ▼ -2.00%
- Median HH income
- $48,306
- Composite
- 27.27/100
- National rank
- #7006
- State rank
- #80 of 174 in GA
Livability — Atlanta
- Score
- 83/100
- State rank
- #6
- US rank
- #919
Category grades
Schools grade is shown separately in the Schools card above.
Census & demographics
- Census place
- Atlanta, GA
- County
- Fulton County · 1,094,430 people
- City population
- 629,525
- Metro
- Atlanta-Sandy Springs-Alpharetta, GA
- Population (ZIP)
- 62,567
- Household income
- $62,623
- Rent vs Own
- Severe rent burden
- 3748.0
Population outlook (Fulton County) Hauer SSP2
- Today (2025)
- 1,203,707 people
- By 2030
- 1,299,706 · +8.0%
- By 2040
- 1,488,256 · +23.6%
- By 2050
- 1,664,580 · +38.3%
- By 2075
- 2,036,072 · +69.2%
- By 2100
- 2,222,402 · +84.6%
Race, ethnicity, and origin ACS 2023
- Neighborhood character
- Predominantly Black (94%)
- Race & ethnicity
- Black 94% Two or more races 3% Hispanic / Latino 2%
- Common ancestry
- Hispanic 1%
- Foreign-born
- 4% · Canada
- Languages at home
- 95% English-only · Spanish 1% French/Haitian/Cajun 1%
Political lean MEDSL · Fulton
- 2024 margin
- Solid D (+44.9) · D 71.9% · R 27.0% · Other 1.1%
- 2008→2024 swing
- +9.8pp toward D · 2008: 35.0pp · 2024: 44.9pp
- All cycles
- 2024: D+44.9 2020: D+46.4 2016: D+42.1 2012: D+29.6 2008: D+35.0
Not yet ingested
- Civics
- —
Market trends
- HPI YoY
- ▼ -106.38%
- Current HPI
- 204.5402
- Rent YoY
- ▲ 2.63%
- Metro
- Atlanta-Sandy Springs-Alpharetta, GA
- State GDP YoY
- ▲ 2.66%
- F500 in state
- 28
Industry mix (Fortune 500 HQ in GA)
| Industry | F500 HQs | Revenue |
|---|---|---|
| Paper / Packaging | 2 | $29B |
|
||
| Retail | 1 | $160B |
|
||
| Transportation / Logistics | 1 | $91B |
|
||
| Airlines | 1 | $62B |
|
||
| Consumer Goods | 1 | $47B |
|
||
| Utilities | 1 | $25B |
|
||
Price history
+219.3% since first listed34 events — show timeline
- 2026-03-12 Listed $223,500 FMLS
- 2026-03-12 Listed $223,500 GAMLS
- 2026-03-11 Listing Removed — GAMLS
- 2026-03-10 Listing Removed — FMLS
- 2025-05-07 Listed $240,000 FMLS
- 2025-05-07 Listed $240,000 GAMLS
- 2024-01-02 Rental Removed $1,595 GAMLS
- 2023-12-27 Listed for Rent $1,595 GAMLS
- 2020-10-27 Sold (Public Records) $165,000 Public Records
- 2020-10-02 Sold (MLS) $165,000 GAMLS
- 2020-10-02 Sold (MLS) $165,000 FMLS
- 2020-09-14 Pending — GAMLS
- 2020-09-14 Pending — FMLS
- 2020-09-02 Price Changed $189,000 GAMLS
- 2020-09-01 Price Changed $189,000 FMLS
- 2020-08-20 Price Changed $215,000 GAMLS
- 2020-08-20 Price Changed $215,000 FMLS
- 2020-08-14 Price Changed $225,000 GAMLS
- 2020-08-14 Price Changed $225,000 FMLS
- 2020-08-09 Price Changed $239,900 GAMLS
- 2020-08-09 Price Changed $239,900 FMLS
- 2020-08-03 Listed $249,900 GAMLS
- 2020-08-03 Listed $249,900 FMLS
- 2020-07-16 Listing Removed — GAMLS
- 2020-07-15 Price Changed $225,000 GAMLS
- 2020-05-21 Listed $249,900 GAMLS
- 2019-09-11 Sold (Public Records) $78,000 Public Records
- 2019-08-26 Sold (MLS) $78,000 FMLS
- 2019-08-08 Pending — FMLS
- 2019-08-05 Price Changed $84,000 FMLS
- 2019-07-22 Relisted — FMLS
- 2019-07-11 Pending — FMLS
- 2019-06-28 Listed $85,000 FMLS
- 2017-12-15 Sold (Public Records) $70,000 Public Records
Property tax history
+6.4%/yrLatest (2025): $3,927 · -3.5% YoY. Source: county tax records.
Cash-flow waterfall
monthlySold comps — $/sqft
last 12 mo · ≤1 miLoading sold comps…