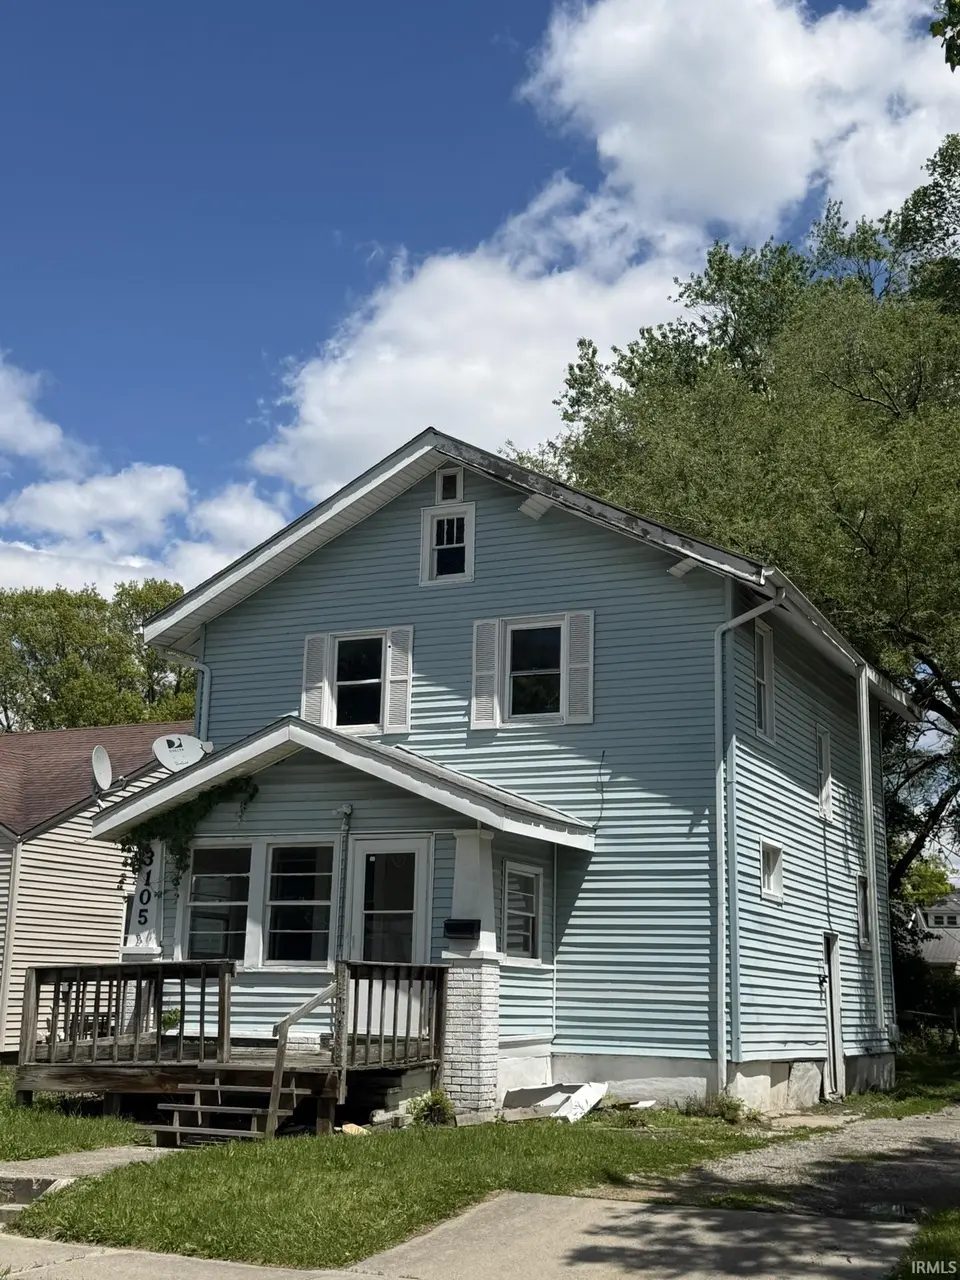
3105 Central Dr · Fort Wayne, IN
Flood risk 1/10 · Minimal
- FEMA flood zone
- X (unshaded)
- Chance of flooding over 30 yrs
- 0.0%
- Est. flood insurance / yr
- $473 – $860
Fire risk 1/10 · Minimal
- Est. fire insurance / yr
- $717 – $1,331
Heat risk 3/10 · Minor
- Hot days now (above 100°F)
- 7 days/yr
- Hot days in 30 yrs
- 17 days/yr
Wind risk 2/10 · Minimal
- Chance of severe wind over 30 yrs
- —
Air-quality risk 3/10 · Minor
- Unhealthy air days now
- 2 days/yr
- Unhealthy air days in 30 yrs
- 3 days/yr
Risk factors via First Street. Map © Google.
Why this score? — see what drove the B+ grade
The composite is a weighted blend of 9 inputs, each scored 0–100. Each bar is that input's sub-score; the figure is the points it added to the 100-point composite (weight × sub-score).
- Cash flow +30.0/30.0
- ARV discount +15.0/15.0
- 1% rule +10.0/10.0
- DSCR +10.0/10.0
- Livability +4.2/5.0
- Rent growth +3.7/5.0
- Condition / age +2.5/5.0
- Schools +2.2/10.0
- Appreciation +0.0/10.0
$69,900
🖨 Deal sheet 📄 Offer letter ✓ Due diligence
Listing remarks
Updated home that needs some work, Newer tear-off reroof, vinyl siding, and vinyl replacement windows. Private drive off street. Interior in generally good condition. Information is believed accurate but not guaranteed and should be verified. * Listing agent does seller representation only, buyers may pick their own broker. Selling for cash with waiver of inspections only. Information believed accurate but should be verified and is not guaranteed.
Key facts
- Vinyl siding
- 4,792 sq ft lot
- Built 1900
Tags
Property features AI
Finance
- Other: Located in Fort Wayne Community school district
- Financial info: Annual tax information available
- HOA & community: Subdivision: Pontiac Place
Exterior
- Utilities: Public water; Public sewer
- Home design: Single-family residence; Site-built home; 2 stories
- Construction: Vinyl siding
- Exterior features: Level lot; Lot dimensions approximately 36 x 130
Interior
- Bedrooms: 6 total rooms (bedrooms and other rooms included)
- Flooring: Vinyl
- Bathrooms: 1 full bathroom
- Heating & cooling: Natural gas heating; No central cooling
- Interior features: Vinyl flooring; Full basement
- Laundry & utility: Laundry in basement
Neighborhood map
What this means for you Summary
Snapshot
- This is a 3-bed/1.0-bath single-family listed at $70k.
Deal economics
- At list price, monthly cash flow is $459 ($6k/yr) — positive.
- The deal already cash-flows at list — no discount required.
- Meets the 1% rule at list price ($1k rent vs $70k).
- Cap rate 14.2% vs local median 4.8% in Fort Wayne — top-decile yield for the area; either an underpriced asset or a hidden risk that comps aren't pricing in. Stress-test before assuming the spread holds.
Location & tenants
- Location reads 84/100 on livability (#6 in IN, #676 nationally) — a professional / high-income tenant draw. Strengths: amenities A+, commute A+, cost of living A+; Watch: crime C-, employment D+.
- Fort Wayne Community Schools (urban): math 22% / reading 29% proficiency, ranked #263 of 301 in IN (top 87%) — low school quality limits family demand, transient renter base, plan for 1-2y turnover; 60% free/reduced lunch — lower-income household profile, screen leases tightly.
- Zoned schools: J Wilbur Haley Elementary School (math 19% / reading 20%, grade F, #814 of 994 statewide, top 83%, 568 students, 65% FRL); Lane Middle School (math 9% / reading 20%, grade F, #300 of 330 statewide, top 91%, 710 students, 74% FRL); R Nelson Snider High School (math 27% / reading 53%, grade F, #217 of 369 statewide, top 59%, 1,899 students, 50% FRL) — zoned schools at 63% FRL track the district average.
- Market conditions: Rents rising fast (+4.9%/yr); 129 active listings in the ZIP; 22 comparable units currently listed for rent nearby; rentals at typical pace (median 21d on market — plan ~3-4 weeks tenant-placement turnaround); 1,861 units permitted in Allen County in 2024 (576 in 5+ unit buildings).
- This rent runs 31% of the median local income ($48k/yr) — at the standard rent-burdened threshold; future hikes will face affordability resistance.
Forward outlook
- Local home prices are declining (-3.0%/yr); year-one equity from $483 of loan paydown is wiped out by about $2k of value loss. Plan a longer hold.
- Allen County population projected at +10% by 2050 — modest demand growth; plan on rents tracking national, not racing it.
- At projected returns (-3.0% appreciation + 4.9% rent growth), your $20k cash investment doubles in ~5 years — after that, you're playing with house money.
Negotiation context
- Only 5 days on market — expect competitive offers; lowballing is unlikely to land.
- 2 sale attempts with the ask held roughly flat each time — persistent listings suggest the price (not the market) is what's stuck; bring a comps-based counter.
Risks & watch-outs
- Watch-outs: built in 1900 — expect roof / HVAC / electrical / plumbing capex.
Questions for the listing agent
- Built in 1900 — when were the roof, HVAC, electrical panel, plumbing, and water heater last replaced?
- Is there a deadline driving the sale (1031 exchange, divorce, estate, relocation)? That informs how much negotiation room exists.
- Schools are D-rated, which usually means shorter tenancies and higher turnover. Who's the typical renter profile here, and what's been the actual vacancy rate?
- What's the average days-on-market for RENTAL listings here right now (not sales)? A rising rental-DOM trend means longer vacancies and softer asking-rent achievability than the comps imply.
- What's the recent tenant-quality profile in this submarket — average credit score on applications, eviction rate, late-payment / NSF rate, and stable-employment percentage? A property-management company in the area should have these aggregated.
- How much new for-sale + rental construction is in the pipeline within 1–3 miles? Heavy new supply typically softens prices + rents 12–24 months out; constrained supply supports both.
Investment metrics
- 1% rule
- 1.75% ✓
- Cap rate
- 14.17%
- Cash-on-cash
- 28.13%
- DSCR
- 2.25
- GRM
- 4.8
CMA / ARV
- ARV (on-the-fly)
- $87,584
- Comps found
- 12
Show comp detail 12 sales within ~0.75 mi
| Address | Dist | Beds/Ba | Sqft | Sold | Price | $/sf | Match |
|---|---|---|---|---|---|---|---|
| 3105 Central Dr | 0.00mi | 3/1.0 | 1,288 (0%) | 1mo | $65,000 | $50 | 99 |
| 3110 Central Dr | 0.03mi | 3/1.0 | 1,224 (-5%) | 0mo | $123,000 | $100 | 90 |
| 3201 S Anthony Blvd | 0.13mi | 3/1.0 | 1,248 (-3%) | 5mo | $65,000 | $52 | 85 |
| 3034 Lillie St | 0.22mi | 3/1.0 | 1,350 (+5%) | 1mo | $90,000 | $67 | 81 |
| 3311 Reed St | 0.33mi | 3/1.0 | 1,380 (+7%) | 0mo | $81,000 | $59 | 72 |
| 3522 Oliver St | 0.60mi | 3/1.0 | 1,292 (+0%) | 4mo | $135,000 | $104 | 68 |
| 3015 Holton Ave | 0.38mi | 3/1.0 | 1,185 (-8%) | 1mo | $80,000 | $68 | 68 |
| 3026 Abbott St | 0.17mi | 3/1.5 | 1,476 (+15%) | 1mo | $165,000 | $112 | 65 |
| 3002 Holton Ave | 0.41mi | 3/1.0 | 1,156 (-10%) | 5mo | $135,000 | $117 | 60 |
| 3317 Smith St | 0.60mi | 3/1.0 | 1,182 (-8%) | 4mo | $65,000 | $55 | 55 |
| 1515 E Rudisill Blvd | 0.51mi | 3/1.0 | 1,125 (-13%) | 2mo | $114,900 | $102 | 53 |
| 1024 Eckart St | 0.63mi | 3/1.5 | 1,421 (+10%) | 2mo | $81,000 | $57 | 49 |
Match score weights: distance 35% · size 25% · config 20% · recency 20%. Top-matched comps best support the ARV.
Projected returns pro-forma
-3.0% appreciation · 4.93% rent growth · sell at horizon
- IRR
- 24.6%
- Equity multiple
- 2.04×
- Total profit
- $20,354
- Equity at exit
- $10,422
- IRR
- 33.6%
- Equity multiple
- 4.36×
- Total profit
- $65,832
- Equity at exit
- $6,044
Cash invested: $19,572 (down + closing). Projections, not guarantees.
Landlord ↔ Tenant lean methodology
- Overall (STATE)
- 90 Strongly Landlord-Friendly
- State Indiana
- 90 Strongly Landlord-Friendly · R+11
- County
- — inherits STATE
- City
- — inherits STATE
ZIP-level market 46806
- Home prices YoY
- -33.6%
- Rents YoY
- 4.9%
- Active inventory
- 129
- Price-to-rent
- 4.8×
Monthly cashflow live
- Estimated rent
- $1,224 high interval (Pro) →
- Mortgage (P&I)
- −$367
- Tax from tax record
- −$112 /mo · $1,347/yr
- Insurance
- −$29
- HOA
- −$0
- Vacancy / Maint / Mgmt
- −$257
- Net cashflow
- $459
Break-even live
UW: 25.0% down · 7.5% · 30yr · 1.5% tax · 5.0% vac · 8.0% maint · 8.0% mgmt
Financing live
Cash to close
- Down payment
- $17,475
- Closing costs
- $2,097
- Reserves months
- —
- Total cash needed
- —
Loan-product check · same deal, 3 products live
Conventional
25% down · 7.5% · 30yr
- Down + closing
- —
- Monthly P&I
- —
- Monthly cashflow
- —
- DSCR
- —
- Eligible?
- —
Personal DTI + credit; lowest rate.
DSCR
20% down · 8.5% · 30yr
- Down + closing
- —
- Monthly P&I
- —
- Monthly cashflow
- —
- DSCR
- —
- Eligible?
- —
No personal income docs; deal must DSCR.
Hard money
10% down · 12.0% · 12mo
- Down + closing
- —
- Monthly P&I
- —
- Monthly cashflow
- —
- DSCR
- —
- Eligible?
- —
Short-term bridge; refi at stabilization.
Rent comps 22 comps
| Address | Beds | Baths | Sqft | Rent | $/sqft | DOM | Units | Dist |
|---|---|---|---|---|---|---|---|---|
| 3410 S Anthony Blvd Fort Wayne, IN | 3.0 | 1.0 | 900 | $1,200 | $1.33 | 43d | 1 | 0.20mi |
| 2903 Queen St Fort Wayne, IN | 3.0 | 2.0 | 1460 | $1,200 | $0.82 | 43d | 1 | 0.35mi |
| 2720 Queen St Fort Wayne, IN | 3.0 | 2.0 | 1316 | $1,395 | $1.06 | 13d | 1 | 0.39mi |
| 3009 Holton Ave Fort Wayne, IN | 3.0 | 1.0 | 1212 | $1,400 | $1.16 | 13d | 1 | 0.39mi |
| 1024 Colerick St Fort Wayne, IN | 4.0 | 1.0 | 1388 | $1,065 | $0.77 | 21d | 1 | 0.65mi |
| 1023 Hamilton Ave Fort Wayne, IN | 3.0 | 1.0 | 1152 | $1,075 | $0.93 | 13d | 1 | 0.67mi |
| 4014 Oliver St Fort Wayne, IN | 3.0 | 1.0 | 936 | $1,050 | $1.12 | 13d | 1 | 0.74mi |
| 4325 Werling Dr Fort Wayne, IN | 1.0–3.0 | 1.0–2.0 | 923 | $1,164 | $1.26 | 43d | 1 | 0.74mi |
| 2806 New Haven Ave Fort Wayne, IN | 3.0 | 1.0 | 1410 | $1,125 | $0.80 | 21d | 1 | 0.98mi |
| 4705 S Anthony Blvd Fort Wayne, IN | 3.0 | 1.0 | 1110 | $1,050 | $0.95 | 13d | 1 | 0.98mi |
| 2730 Chestnut St Fort Wayne, IN | 3.0 | 1.5 | 1312 | $950 | $0.72 | 21d | 1 | 1.03mi |
| 4405 S Park Dr Fort Wayne, IN | 2.0 | 1.0 | 1440 | $1,175 | $0.82 | 13d | 1 | 1.04mi |
| 451 E Pontiac St Fort Wayne, IN | 3.0 | 1.0 | 1308 | $1,050 | $0.80 | 43d | 1 | 1.10mi |
| 859 Buchanan St Fort Wayne, IN | 1.0–4.0 | 1.0 | 887 | $1,074 | $1.21 | 21d | 1 | 1.14mi |
| 3702 Trace Cir Fort Wayne, IN | 2.0–4.0 | 2.0 | 1571 | $1,903 | $1.21 | 43d | 6 | 1.17mi |
| 3801 Lafayette St Fort Wayne, IN | 2.0 | 1.0 | 1116 | $995 | $0.89 | 13d | 1 | 1.17mi |
| 2530 Lafayette St Fort Wayne, IN | 4.0 | 1.0 | 1816 | $1,500 | $0.83 | 43d | 1 | 1.23mi |
| 4133 Lafayette St Fort Wayne, IN | 4.0 | 2.0 | 1640 | $1,400 | $0.85 | 21d | 1 | 1.26mi |
| 420 E Dewald St Fort Wayne, IN | 3.0 | 1.5 | 1472 | $1,300 | $0.88 | 43d | 1 | 1.29mi |
| 116 E Pontiac St Fort Wayne, IN | 3.0 | 1.5 | 1400 | $1,175 | $0.84 | 21d | 1 | 1.40mi |
| 1131 E Lewis St Fort Wayne, IN | 4.0 | 2.0 | 1476 | $1,950 | $1.32 | 13d | 1 | 1.48mi |
| 3510 S Harrison St Fort Wayne, IN | 3.0 | 1.0 | 1248 | $975 | $0.78 | 13d | 1 | 1.48mi |
Listing history 5 events
-
2026-05-21status Pending
-
2026-05-16$69,900 Active
-
2026-03-16price $64,900
-
2026-03-03price $69,500
-
2026-02-22$74,000 Active
ⓘ Source: listings_history table (triggers on properties + properties_extension) + one-shot
backfill from property_details.listing_events for pre-trigger history.
Tax reassessment forecast IN · Partial reset (capped growth)
- Current annual tax
- $1,347 · $112/mo
- Projected year-2 tax
- $1,347 · $112/mo
- Expected delta
- $0/yr ($0/mo · 0.0%)
ⓘ Screening estimate from a state-policy table — verify with the county assessor before closing.
Climate risk First Street
- Flood 1/10 Low FEMA zone X (unshaded) · 0% chance over 30 yrs
- Wildfire 1/10 Low
- Heat 3/10 Moderate 7 d/yr ≥100°F today · 17 d/yr by 30 yrs out
- Wind 2/10 Low
- Air quality 3/10 Moderate 2 unhealthy d/yr today · 3 by 30 yrs out
Nearby sold comps map
Loading sold comps map…
Walkable amenities ~0.75 mi
Loading nearby amenities…
Taxation est. · year 1
- Rental income
- $14,685
- − Mortgage interest
- −$3,915
- − Property taxes
- −$1,347
- − Insurance
- −$350
- − Repairs & maintenance
- −$1,175
- − Management
- −$1,175
- − Depreciation
- −$2,033
- Taxable income
- $4,690
- Est. tax owed @ 24.0%
- −$1,126
- After-tax cash flow
- $4,381/yr
For passive investors: Depreciation is non-cash, so a rental often shows a tax loss while cash-flowing — sheltering income. Rental losses are passive: they offset passive income freely, and up to $25,000/yr can offset ordinary (W-2) income if you actively participate and your MAGI is under $100k (phasing out to $0 by $150k); unused losses carry forward. On sale, claimed depreciation is recaptured at up to 25%, and gains may owe capital-gains tax (a 1031 exchange can defer both). Figures are a year-1 estimate at your 24.0% rate — not tax advice; consult a CPA.
Schools (NCES district)
- District
- Fort Wayne Community Schools
- NCES district ID
- 1803630
- Math proficiency
- 22% ▼ -11.00%
- Reading proficiency
- 29% ▼ -7.00%
- Median HH income
- $41,951
- Composite
- 21.68/100
- National rank
- #8275
- State rank
- #263 of 301 in IN
Livability — Fort Wayne
- Score
- 84/100
- State rank
- #6
- US rank
- #676
Category grades
Schools grade is shown separately in the Schools card above.
Census & demographics
- Census place
- Fort Wayne, IN
- County
- Allen County · 326,813 people
- City population
- 326,813
- Metro
- Fort Wayne, IN
- Population (ZIP)
- 26,425
- Household income
- $47,895
- Rent vs Own
- Severe rent burden
- 1184.0
Population outlook (Allen County) Hauer SSP2
- Today (2025)
- 394,020 people
- By 2030
- 405,128 · +2.8%
- By 2040
- 423,476 · +7.5%
- By 2050
- 435,137 · +10.4%
- By 2075
- 450,293 · +14.3%
- By 2100
- 424,101 · +7.6%
Race, ethnicity, and origin ACS 2023
- Neighborhood character
- Highly diverse neighborhood (Simpson 0.74)
- Race & ethnicity
- Black 37% Hispanic / Latino 26% White 21% Asian 12% Two or more races 11% Native American 2%
- Hispanic origin (detail)
- Mexican 18% Puerto Rican 1%
- Common ancestry
- Italian 1% Romanian 1% Lithuanian 1%
- Foreign-born
- 19% · Canada, Philippines, South Korea
- Languages at home
- 71% English-only · Spanish 19% Other Asian/Pacific 9%
Political lean MEDSL · Allen
- 2024 margin
- R (+12.5) · D 42.9% · R 55.4% · Other 1.7%
- 2008→2024 swing
- -8.1pp toward R · 2008: -4.3pp · 2024: -12.5pp
- All cycles
- 2024: R+12.5 2020: R+11.2 2016: R+19.6 2012: R+16.8 2008: R+4.3
Not yet ingested
- Civics
- —
Market trends
- HPI YoY
- ▼ -148.00%
- Current HPI
- 291.8198
- Rent YoY
- ▲ 4.93%
- Metro
- Fort Wayne, IN
- State GDP YoY
- ▲ 2.90%
- F500 in state
- 18
Industry mix (Fortune 500 HQ in IN)
| Industry | F500 HQs | Revenue |
|---|---|---|
| Industrial Machinery | 2 | $37B |
|
||
| Healthcare | 1 | $177B |
|
||
| Pharmaceuticals | 1 | $45B |
|
||
| Metals / Steel | 1 | $18B |
|
||
| Agriculture | 1 | $17B |
|
||
| Packaging | 1 | $12B |
|
||
Price history
-5.5% since first listed5 events — show timeline
- 2026-05-21 Pending — IRMLS
- 2026-05-16 Listed $69,900 IRMLS
- 2026-03-16 Price Changed $64,900 IRMLS
- 2026-03-03 Price Changed $69,500 IRMLS
- 2026-02-22 Listed $74,000 IRMLS
Property tax history
+12.6%/yrLatest (2024): $1,347 · +38.6% YoY. Source: county tax records.
Cash-flow waterfall
monthlySold comps — $/sqft
last 12 mo · ≤1 miLoading sold comps…