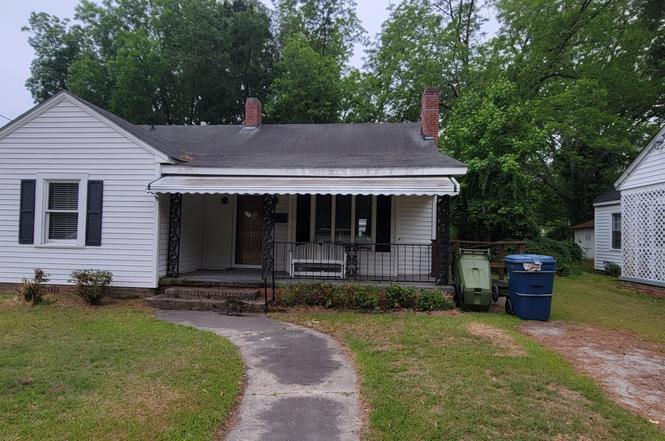
329 E 11th St · Washington, NC
Flood risk 7/10 · Major
- FEMA flood zone
- X (unshaded)
- Chance of flooding over 30 yrs
- 0.76%
- Est. flood insurance / yr
- $507 – $1,088
Fire risk 4/10 · Minor
- Est. fire insurance / yr
- $906 – $1,684
Heat risk 9/10 · Severe
- Hot days now (above 109°F)
- 7 days/yr
- Hot days in 30 yrs
- 17 days/yr
Wind risk 8/10 · Major
- Chance of severe wind over 30 yrs
- 80.0%
Air-quality risk 2/10 · Minimal
- Unhealthy air days now
- 2 days/yr
- Unhealthy air days in 30 yrs
- 2 days/yr
Risk factors via First Street. Map © Google.
Why this score? — see what drove the B- grade
The composite is a weighted blend of 9 inputs, each scored 0–100. Each bar is that input's sub-score; the figure is the points it added to the 100-point composite (weight × sub-score).
- Cash flow +25.0/30.0
- ARV discount +15.0/15.0
- DSCR +8.2/10.0
- 1% rule +5.5/10.0
- Schools +3.4/10.0
- Livability +3.2/5.0
- Rent growth +2.5/5.0
- Condition / age +2.5/5.0
- Appreciation +0.0/10.0
$125,000
🖨 Deal sheet 📄 Offer letter ✓ Due diligence
Listing remarks
Calling all investors or DIY buyers!! This home needs some TLC, but can either be your forever home or rental investment. Potential workshop located in back. In the heart of Washington and close to medical, shopping, restaurants, and beautiful downtown Washington waterfront. This won't last long!
Key facts
- Close to restaurants
- Heart of washington
- Close to medical
Tags
Property features AI
Finance
- Other: Zoned residential
Exterior
- Parking: On-site unpaved parking
- Utilities: Public water; Public sewer / sewer connected
- Home design: Single family residence; One story; Entry level: 1
- Construction: Vinyl siding and frame construction; Brick/mortar foundation; Shingle roof; Built on one level
- Exterior features: Covered front porch; Storm door(s); Outbuilding; Open lot; Has view
Interior
- Kitchen: Gas range; Microwave; Refrigerator; Electric water heater
- Bedrooms: 6 total rooms (bedroom count not specified)
- Flooring: Vinyl
- Bathrooms: 1 full bathroom; Accessible full bath
- Heating & cooling: Propane heating; Other heating; Central air conditioning
- Interior features: Ceiling fan(s); Eat-in kitchen; Storm windows; Unfurnished
- Laundry & utility: Washer; Dryer; Washer hookup
Neighborhood map
What this means for you Summary
Snapshot
- This is a 2-bed/1.0-bath single-family listed at $125k.
Deal economics
- At list price, monthly cash flow is $206 ($2k/yr) — positive.
- The deal already cash-flows at list — no discount required.
- Meets the 1% rule at list price ($1k rent vs $125k).
- Cap rate 8.9% vs local median 2.3% in Washington — top-decile yield for the area; either an underpriced asset or a hidden risk that comps aren't pricing in. Stress-test before assuming the spread holds.
Location & tenants
- Location reads 64/100 on livability (#341 in NC) — a middle-class / working-renter tenant base. Strengths: cost of living A+, health & safety A+, housing B+; Watch: crime F, amenities F, commute F.
- Beaufort County Schools (rural): math 39% / reading 42% proficiency, ranked #112 of 178 in NC (top 63%) — families likely to look elsewhere, expect single-tenant / working-renter base with shorter leases; 67% free/reduced lunch — lower-income household profile, screen leases tightly.
- Zoned schools: John Small Elementary (math 28% / reading 37%, grade F, #897 of 1,410 statewide, top 64%, 453 students, 99% FRL); P S Jones Middle (math 32% / reading 42%, grade F, #262 of 475 statewide, top 57%, 727 students, 100% FRL); Washington High (math 27% / reading 32%, grade F, #459 of 535 statewide, top 87%, 839 students, 99% FRL) — zoned schools average 99% FRL vs 67% district-wide (33 pts higher); higher-poverty schools than district average — tighter screening recommended.
- Market conditions: 162 active listings in the ZIP; 2 comparable units currently listed for rent nearby; 216 units permitted in Beaufort County in 2024 (0 in 5+ unit buildings).
Forward outlook
- Local home prices are declining (-3.0%/yr); year-one equity from $864 of loan paydown is wiped out by about $4k of value loss. Plan a longer hold.
- Beaufort County population projected at -10% by 2050 — secular population decline; favor cash flow + early exit over multi-decade hold.
Negotiation context
- Only 2 days on market — expect competitive offers; lowballing is unlikely to land.
Risks & watch-outs
- Watch-outs: flood insurance adds $66/mo; built in 1948 — expect roof / HVAC / electrical / plumbing capex.
- Climate carrying-cost: major flood risk; severe wind risk, 80% chance of damaging wind over 30y; extreme-heat days projected 7→17/yr by 2055 (HVAC capex compounding) — expect insurance premiums to compound above CPI over the hold.
Questions for the listing agent
- Built in 1948 — when were the roof, HVAC, electrical panel, plumbing, and water heater last replaced?
- What's the actual annual flood-insurance premium (NFIP or private), and is the property in a SFHA with mandatory coverage?
- Is there a deadline driving the sale (1031 exchange, divorce, estate, relocation)? That informs how much negotiation room exists.
- Schools are D-rated, which usually means shorter tenancies and higher turnover. Who's the typical renter profile here, and what's been the actual vacancy rate?
- Crime grade is F in this area — have there been break-ins, vandalism, or insurance claims at this property in the last 3 years? What carrier currently insures it and at what premium?
- What's the average days-on-market for RENTAL listings here right now (not sales)? A rising rental-DOM trend means longer vacancies and softer asking-rent achievability than the comps imply.
- What's the recent tenant-quality profile in this submarket — average credit score on applications, eviction rate, late-payment / NSF rate, and stable-employment percentage? A property-management company in the area should have these aggregated.
- How much new for-sale + rental construction is in the pipeline within 1–3 miles? Heavy new supply typically softens prices + rents 12–24 months out; constrained supply supports both.
Investment metrics
- 1% rule
- 1.05% ✓
- Cap rate
- 8.91%
- Cash-on-cash
- 9.35%
- DSCR
- 1.42
- GRM
- 7.9
CMA / ARV
- ARV (on-the-fly)
- $165,825
- Comps found
- 12
Show comp detail 12 sales within ~0.75 mi
| Address | Dist | Beds/Ba | Sqft | Sold | Price | $/sf | Match |
|---|---|---|---|---|---|---|---|
| 410 E 12th St | 0.09mi | 2/1.0 | 928 (-8%) | 7mo | $185,000 | $199 | 77 |
| 306 E 10th St | 0.12mi | 3/2.0 (+1) | 1,002 (-0%) | 9mo | $165,000 | $165 | 77 |
| 807 E 8th St | 0.41mi | 2/1.0 | 962 (-4%) | 1mo | $160,000 | $166 | 73 |
| 511 Aycock St | 0.48mi | 2/1.0 | 980 (-2%) | 2mo | $33,500 | $34 | 72 |
| 345 E 13th St | 0.14mi | 2/1.0 | 919 (-9%) | 10mo | $165,000 | $180 | 71 |
| 220 N Bonner St | 0.67mi | 2/1.0 | 990 (-2%) | 6mo | $157,500 | $159 | 61 |
| 603 E 8th St | 0.26mi | 2/1.0 | 1,142 (+14%) | 11mo | $152,500 | $134 | 56 |
| 102 E 13th St | 0.34mi | 2/1.5 | 1,122 (+12%) | 13mo | $235,000 | $209 | 52 |
| 1010 E 7th St | 0.58mi | 2/1.0 | 884 (-12%) | 4mo | $85,000 | $96 | 50 |
| 701 Gladden St | 0.58mi | 3/2.0 (+1) | 1,050 (+4%) | 11mo | $180,000 | $171 | 48 |
| 303 W 7th St | 0.63mi | 3/1.0 (+1) | 1,100 (+10%) | 7mo | $170,000 | $155 | 44 |
| 130 W 6th St | 0.50mi | 3/2.0 (+1) | 1,137 (+13%) | 6mo | $162,500 | $143 | 40 |
Match score weights: distance 35% · size 25% · config 20% · recency 20%. Top-matched comps best support the ARV.
Projected returns pro-forma
-3.0% appreciation · 3.0% rent growth · sell at horizon
- IRR
- -5.5%
- Equity multiple
- 0.80×
- Total profit
- $-7,127
- Equity at exit
- $18,638
- IRR
- 4.2%
- Equity multiple
- 1.31×
- Total profit
- $10,699
- Equity at exit
- $10,808
Cash invested: $35,000 (down + closing). Projections, not guarantees.
Landlord ↔ Tenant lean methodology
- Overall (STATE)
- 85 Strongly Landlord-Friendly
- State North Carolina
- 85 Strongly Landlord-Friendly · R+3
- County
- — inherits STATE
- City
- — inherits STATE
ZIP-level market 27889
- Home prices YoY
- -24.4%
- Active inventory
- 162
- Price-to-rent
- 7.9×
Monthly cashflow live
- Estimated rent
- $1,313 medium interval (Pro) →
- Mortgage (P&I)
- −$656
- Tax from tax record
- −$57 /mo · $687/yr
- Insurance
- −$52
- Flood insurance flood zone
- −$66 /mo · $798/yr
- HOA
- −$0
- Vacancy / Maint / Mgmt
- −$276
- Net cashflow
- $206
Break-even live
UW: 25.0% down · 7.5% · 30yr · 1.5% tax · 5.0% vac · 8.0% maint · 8.0% mgmt
Financing live
Cash to close
- Down payment
- $31,250
- Closing costs
- $3,750
- Reserves months
- —
- Total cash needed
- —
Loan-product check · same deal, 3 products live
Conventional
25% down · 7.5% · 30yr
- Down + closing
- —
- Monthly P&I
- —
- Monthly cashflow
- —
- DSCR
- —
- Eligible?
- —
Personal DTI + credit; lowest rate.
DSCR
20% down · 8.5% · 30yr
- Down + closing
- —
- Monthly P&I
- —
- Monthly cashflow
- —
- DSCR
- —
- Eligible?
- —
No personal income docs; deal must DSCR.
Hard money
10% down · 12.0% · 12mo
- Down + closing
- —
- Monthly P&I
- —
- Monthly cashflow
- —
- DSCR
- —
- Eligible?
- —
Short-term bridge; refi at stabilization.
Rent comps 2 comps
| Address | Beds | Baths | Sqft | Rent | $/sqft | DOM | Units | Dist |
|---|---|---|---|---|---|---|---|---|
| 1509 N Respess St Washington, NC | 3.0 | 2.0 | 1284 | $1,650 | $1.29 | 21d | 1 | 0.59mi |
| 940 Runyon Rd Washington, NC | 2.0–4.0 | 1.0–1.5 | 1081 | $1,063 | $0.98 | 21d | 2 | 0.80mi |
Listing history 3 events
-
2026-06-19days on market $125,000 Active 2 DOM
-
2026-06-17remarks 297-char remark
-
2026-06-17$125,000 Active 1 DOM
ⓘ Source: listings_history table (triggers on properties + properties_extension) + one-shot
backfill from property_details.listing_events for pre-trigger history.
Tax reassessment forecast NC · Resets to sale price
- Current annual tax
- $687 · $57/mo
- Projected year-2 tax
- $1,025 · $85/mo
- Expected delta
- +$338/yr (+$28/mo · 49.2%)
ⓘ Screening estimate from a state-policy table — verify with the county assessor before closing.
Climate risk First Street
- Flood 7/10 Severe FEMA zone X (unshaded) · 76% chance over 30 yrs
- Wildfire 4/10 Moderate
- Heat 9/10 Extreme 7 d/yr ≥109°F today · 17 d/yr by 30 yrs out
- Wind 8/10 Severe 80% chance of damaging wind over 30 yrs
- Air quality 2/10 Low 2 unhealthy d/yr today · 2 by 30 yrs out
Nearby sold comps map
Loading sold comps map…
Walkable amenities ~0.75 mi
Loading nearby amenities…
Taxation est. · year 1
- Rental income
- $15,759
- − Mortgage interest
- −$7,002
- − Property taxes
- −$687
- − Insurance
- −$1,422
- − Repairs & maintenance
- −$1,261
- − Management
- −$1,261
- − Depreciation
- −$3,636
- Taxable income
- $489
- Est. tax owed @ 24.0%
- −$117
- After-tax cash flow
- $2,356/yr
For passive investors: Depreciation is non-cash, so a rental often shows a tax loss while cash-flowing — sheltering income. Rental losses are passive: they offset passive income freely, and up to $25,000/yr can offset ordinary (W-2) income if you actively participate and your MAGI is under $100k (phasing out to $0 by $150k); unused losses carry forward. On sale, claimed depreciation is recaptured at up to 25%, and gains may owe capital-gains tax (a 1031 exchange can defer both). Figures are a year-1 estimate at your 24.0% rate — not tax advice; consult a CPA.
Schools (NCES district)
- District
- Beaufort County Schools
- NCES district ID
- 3700330
- Math proficiency
- 39% ▬ 0.00%
- Reading proficiency
- 42% ▲ 3.00%
- Median HH income
- $40,486
- Composite
- 33.99/100
- National rank
- #5320
- State rank
- #112 of 178 in NC
Livability — Washington
- Score
- 64/100
- State rank
- #341
- US rank
- #13721
Category grades
Schools grade is shown separately in the Schools card above.
Census & demographics
- Census place
- Washington, NC
- County
- Beaufort County · 24,371 people
- City population
- 24,371
- Metro
- Washington, NC
- Population (ZIP)
- 24,371
- Household income
- $53,179
- Rent vs Own
- Severe rent burden
- 857.0
Population outlook (Beaufort County) Hauer SSP2
- Today (2025)
- 47,069 people
- By 2030
- 46,417 · -1.4%
- By 2040
- 44,455 · -5.6%
- By 2050
- 42,239 · -10.3%
- By 2075
- 37,349 · -20.7%
- By 2100
- 32,434 · -31.1%
Race, ethnicity, and origin ACS 2023
- Neighborhood character
- Diverse neighborhood (Simpson 0.58)
- Race & ethnicity
- White 58% Black 27% Hispanic / Latino 10% Two or more races 7%
- Hispanic origin (detail)
- Mexican 8% Puerto Rican 1%
- Common ancestry
- Slovak 1% Serbian 1% Italian 1%
- Foreign-born
- 5% · Canada, Vietnam
- Languages at home
- 91% English-only · Spanish 8% Vietnamese 1%
Political lean MEDSL · Beaufort
- 2024 margin
- Solid R (+31.1) · D 34.1% · R 65.2%
- 2008→2024 swing
- -13.7pp toward R · 2008: -17.4pp · 2024: -31.1pp
- All cycles
- 2024: R+31.1 2020: R+25.9 2016: R+24.5 2012: R+19.3 2008: R+17.4
Not yet ingested
- Civics
- —
Market trends
- HPI YoY
- ▼ -94.40%
- Current HPI
- 291.9128
- Rent YoY
- —
- Metro
- Washington, NC
- State GDP YoY
- ▲ 3.28%
- F500 in state
- 26
Industry mix (Fortune 500 HQ in NC)
| Industry | F500 HQs | Revenue |
|---|---|---|
| Financial Services | 2 | $213B |
|
||
| Retail | 2 | $95B |
|
||
| Industrial Conglomerate | 1 | $38B |
|
||
| Metals / Steel | 1 | $35B |
|
||
| Utilities | 1 | $30B |
|
||
| Industrial Machinery | 1 | $19B |
|
||
Price history
1 event — show timeline
- 2026-06-17 Listed $125,000 Hive MLS
Property tax history
+5.0%/yrLatest (2025): $687 · +37.1% YoY. Source: county tax records.
Cash-flow waterfall
monthlySold comps — $/sqft
last 12 mo · ≤1 miLoading sold comps…