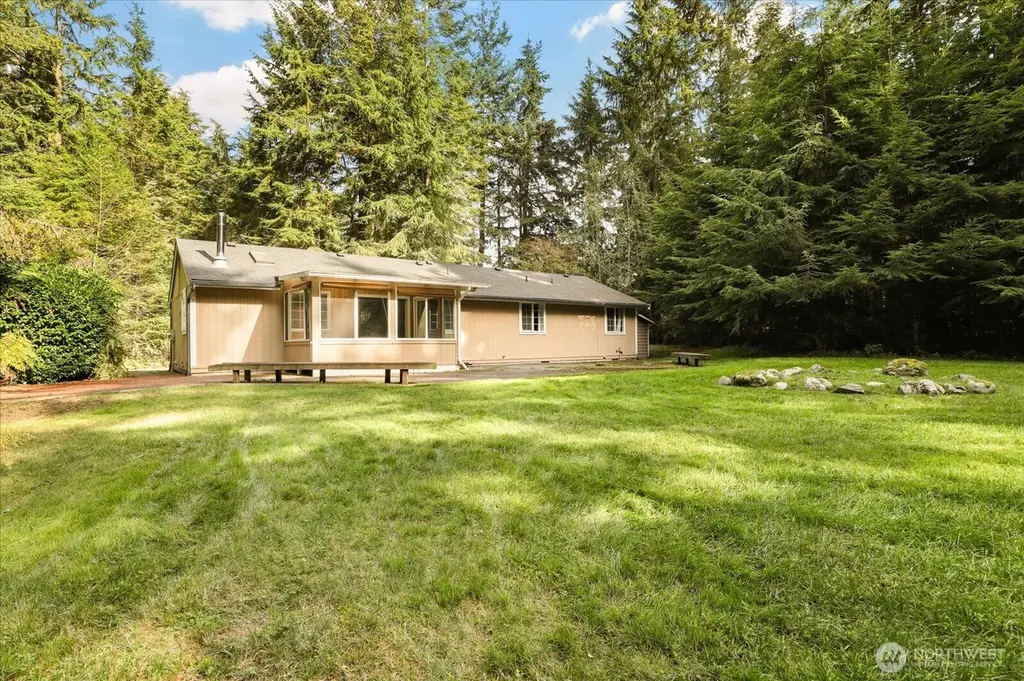
3100 Sea Eagle Ln · Freeland, WA
Flood risk 1/10 · Minimal
- FEMA flood zone
- X (unshaded)
- Chance of flooding over 30 yrs
- 0.0%
- Est. flood insurance / yr
- $507 – $1,088
Fire risk 2/10 · Minimal
- Est. fire insurance / yr
- $604 – $1,122
Heat risk 1/10 · Minimal
- Hot days now (above 83°F)
- 7 days/yr
- Hot days in 30 yrs
- 16 days/yr
Wind risk 1/10 · Minimal
- Chance of severe wind over 30 yrs
- —
Air-quality risk 6/10 · Moderate
- Unhealthy air days now
- 8 days/yr
- Unhealthy air days in 30 yrs
- 9 days/yr
Risk factors via First Street. Map © Google.
Why this score? — see what drove the C grade
The composite is a weighted blend of 9 inputs, each scored 0–100. Each bar is that input's sub-score; the figure is the points it added to the 100-point composite (weight × sub-score).
- ARV discount +15.0/15.0
- Cash flow +14.8/30.0
- Appreciation +6.8/10.0
- Schools +5.6/10.0
- DSCR +4.5/10.0
- 1% rule +3.4/10.0
- Livability +3.2/5.0
- Rent growth +2.5/5.0
- Condition / age +2.5/5.0
$435,000
🖨 Deal sheet 📄 Offer letter ✓ Due diligence
Listing remarks
Whidbey Island fixer opportunity on 2.6± private acres in Greenbank. This 3-bedroom, 1.75-bath home requires significant repairs and updates throughout and is being sold as-is. Cash sale only. The property will not qualify for conventional financing in its current condition. For buyers ready to take on a project, there is clear upside and room to add value while restoring its island charm. The peaceful setting features mature landscaping and natural privacy, just minutes from Greenbank Farm, local shops, and dining. Ideal for investors, builders, or buyers looking for a full renovation project in a desirable Whidbey Island location.
Key facts
- Privacy
- 2.6 acres
- Mature landscaping
Tags
Neighborhood map
What this means for you Summary
Snapshot
- This is a 3-bed/2.0-bath single-family listed at $435k.
Deal economics
- At list price, monthly cash flow is $121 ($1k/yr) — positive.
- The deal already cash-flows at list — no discount required.
- To meet the 1% rule (rent ≥ 1% of price), the offer needs to be $367k (15.7% below list).
- Recommended offer: $367k (15.7% below list) — sets the bar for 1% rule.
- Cap rate 6.6% vs local median 1.9% in Freeland — top-decile yield for the area; either an underpriced asset or a hidden risk that comps aren't pricing in. Stress-test before assuming the spread holds.
Location & tenants
- Location reads 64/100 on livability (#367 in WA) — a middle-class / working-renter tenant base. Strengths: crime A+, employment A+, housing A; Watch: health & safety C-, schools F, amenities F.
- Coupeville School District (rural): math 54% / reading 73% proficiency, ranked #40 of 291 in WA (top 14%) — acceptable for families but not a draw, mixed tenant base, ~2y average lease.
- Market conditions: 36 active listings in the ZIP; 402 units permitted in Island County in 2024 (54 in 5+ unit buildings).
Forward outlook
- In year one you build about $19k of equity ($3k loan paydown + $16k appreciation (3.6% local appreciation)).
- Island County population projected to shrink 6% by 2050 — rents likely to lag national; underwrite the cash flow, not the appreciation.
- At projected returns (3.6% appreciation + 3.0% rent growth), your $122k cash investment doubles in ~6 years — after that, you're playing with house money.
- By year 2, paydown + projected appreciation supports a ~$30k cash-out refi (75% LTV) — recoverable capital for the next deal without selling this one.
Negotiation context
- It's been on market 205 days — a 12% lower offer ($383k) is reasonable based on typical stale-listing flexibility.
- 2 sale attempts; this cycle's ask has dropped $64k (13%) from the opening price — seller is motivated, your offer sets the floor, not the list.
- Current owner paid $126k; list at $435k implies a 245% gain — meaningful room to come down on a strong offer.
Questions for the listing agent
- It's been on market 205 days. Have you received any prior offers? Is the seller open to a 16% concession, seller financing, or rate buy-down credit?
- Why hasn't it sold? Are there any deal-killer items the seller is aware of (foundation, flood, title, zoning, code violations)?
- Is there a deadline driving the sale (1031 exchange, divorce, estate, relocation)? That informs how much negotiation room exists.
- Schools are F-rated, which usually means shorter tenancies and higher turnover. Who's the typical renter profile here, and what's been the actual vacancy rate?
- What's the average days-on-market for RENTAL listings here right now (not sales)? A rising rental-DOM trend means longer vacancies and softer asking-rent achievability than the comps imply.
- What's the recent tenant-quality profile in this submarket — average credit score on applications, eviction rate, late-payment / NSF rate, and stable-employment percentage? A property-management company in the area should have these aggregated.
- How much new for-sale + rental construction is in the pipeline within 1–3 miles? Heavy new supply typically softens prices + rents 12–24 months out; constrained supply supports both.
Investment metrics
- 1% rule
- 0.84% ✗
- Cap rate
- 6.63%
- Cash-on-cash
- 1.20%
- DSCR
- 1.05
- GRM
- 9.9
CMA / ARV
- ARV (median comp)
- $736,089
- List price
- $435,000
- Delta
- -40.90%
- Verdict
- UNDERPRICED
- Comps
- 20 within 2.0 mi
Projected returns pro-forma
3.59% appreciation · 3.0% rent growth · sell at horizon
- IRR
- 10.2%
- Equity multiple
- 1.61×
- Total profit
- $73,767
- Equity at exit
- $210,192
- IRR
- 12.2%
- Equity multiple
- 2.93×
- Total profit
- $235,146
- Equity at exit
- $335,769
Cash invested: $121,800 (down + closing). Projections, not guarantees.
Landlord ↔ Tenant lean methodology
- Overall (STATE)
- 28 Tenant-Leaning
- State Washington
- 28 Tenant-Leaning · D+8
- County
- — inherits STATE
- City
- — inherits STATE
ZIP-level market 98253
- Home prices YoY
- 1.6%
- Active inventory
- 36
- Price-to-rent
- 9.9×
Monthly cashflow live
- Estimated rent
- $3,665 medium interval (Pro) →
- Mortgage (P&I)
- −$2,281
- Tax from tax record
- −$312 /mo · $3,743/yr
- Insurance
- −$181
- HOA
- −$0
- Vacancy / Maint / Mgmt
- −$770
- Net cashflow
- $121
Break-even live
UW: 25.0% down · 7.5% · 30yr · 1.5% tax · 5.0% vac · 8.0% maint · 8.0% mgmt
Financing live
Cash to close
- Down payment
- $108,750
- Closing costs
- $13,050
- Reserves months
- —
- Total cash needed
- —
Loan-product check · same deal, 3 products live
Conventional
25% down · 7.5% · 30yr
- Down + closing
- —
- Monthly P&I
- —
- Monthly cashflow
- —
- DSCR
- —
- Eligible?
- —
Personal DTI + credit; lowest rate.
DSCR
20% down · 8.5% · 30yr
- Down + closing
- —
- Monthly P&I
- —
- Monthly cashflow
- —
- DSCR
- —
- Eligible?
- —
No personal income docs; deal must DSCR.
Hard money
10% down · 12.0% · 12mo
- Down + closing
- —
- Monthly P&I
- —
- Monthly cashflow
- —
- DSCR
- —
- Eligible?
- —
Short-term bridge; refi at stabilization.
Listing history 26 events
-
2026-06-19days on market $435,000 Active 205 DOM
-
2026-06-18days on market $435,000 Active 204 DOM
-
2026-06-17days on market $435,000 Active 203 DOM
-
2026-06-16days on market $435,000 Active 202 DOM
-
2026-06-15days on market $435,000 Active 201 DOM
-
2026-06-14days on market $435,000 Active 199 DOM
-
2026-06-13days on market $435,000 Active 198 DOM
-
2026-06-10days on market $435,000 Active 196 DOM
-
2026-06-09days on market $435,000 Active 195 DOM
-
2026-06-08days on market $435,000 Active 194 DOM
-
2026-06-07days on market $435,000 Active 193 DOM
-
2026-06-05days on market $435,000 Active 190 DOM
-
2026-06-03days on market $435,000 Active 189 DOM
-
2026-06-02days on market $435,000 Active 188 DOM
-
2026-06-01days on market $435,000 Active 187 DOM
-
2026-05-31days on market $435,000 Active 186 DOM
-
2026-05-30days on market $435,000 Active 185 DOM
-
2026-04-03status Active
-
2026-04-02status Pending - Backup Offer Requested
-
2026-02-15status Pending
-
2026-02-04price $435,000
-
2025-10-09$499,000 Active
-
1995-06-01soldstatus $126,000
-
1994-08-01soldstatus $35,000
-
1981-01-01soldstatus $21,500
-
1979-08-01soldstatus $23,450
ⓘ Source: listings_history table (triggers on properties + properties_extension) + one-shot
backfill from property_details.listing_events for pre-trigger history.
Tax reassessment forecast WA · Resets to sale price
- Current annual tax
- $3,743 · $312/mo
- Projected year-2 tax
- $4,263 · $355/mo
- Expected delta
- +$520/yr (+$43/mo · 13.9%)
ⓘ Screening estimate from a state-policy table — verify with the county assessor before closing.
Climate risk First Street
- Flood 1/10 Low FEMA zone X (unshaded) · 0% chance over 30 yrs
- Wildfire 2/10 Low
- Heat 1/10 Low 7 d/yr ≥83°F today · 16 d/yr by 30 yrs out
- Wind 1/10 Low
- Air quality 6/10 Major 8 unhealthy d/yr today · 9 by 30 yrs out
Nearby sold comps map
Loading sold comps map…
Walkable amenities ~0.75 mi
Loading nearby amenities…
Taxation est. · year 1
- Rental income
- $43,986
- − Mortgage interest
- −$24,367
- − Property taxes
- −$3,743
- − Insurance
- −$2,175
- − Repairs & maintenance
- −$3,519
- − Management
- −$3,519
- − Depreciation
- −$12,655
- Taxable loss
- −$5,991
- Est. tax savings @ 24.0%
- +$1,438
- After-tax cash flow
- $2,895/yr
For passive investors: Depreciation is non-cash, so a rental often shows a tax loss while cash-flowing — sheltering income. Rental losses are passive: they offset passive income freely, and up to $25,000/yr can offset ordinary (W-2) income if you actively participate and your MAGI is under $100k (phasing out to $0 by $150k); unused losses carry forward. On sale, claimed depreciation is recaptured at up to 25%, and gains may owe capital-gains tax (a 1031 exchange can defer both). Figures are a year-1 estimate at your 24.0% rate — not tax advice; consult a CPA.
Schools (NCES district)
- District
- Coupeville School District
- NCES district ID
- 5301800
- Math proficiency
- 54% ▲ 4.00%
- Reading proficiency
- 73% ▲ 1.00%
- Median HH income
- $57,404
- Composite
- 56.12/100
- National rank
- #2536
- State rank
- #40 of 291 in WA
Livability — Freeland
- Score
- 64/100
- State rank
- #367
- US rank
- #13986
Category grades
Schools grade is shown separately in the Schools card above.
Census & demographics
- City population
- 4,531
- Population (ZIP)
- 2,141
Population outlook (Island County) Hauer SSP2
- Today (2025)
- 82,019 people
- By 2030
- 81,329 · -0.8%
- By 2040
- 78,552 · -4.2%
- By 2050
- 77,042 · -6.1%
- By 2075
- 80,799 · -1.5%
- By 2100
- 84,451 · +3.0%
Race, ethnicity, and origin ACS 2023
- Neighborhood character
- Predominantly White (87%)
- Race & ethnicity
- White 87% Two or more races 10% Hispanic / Latino 5%
- Hispanic origin (detail)
- Mexican 4%
- Common ancestry
- Portuguese 5% Slovak 4% Italian 4%
- Foreign-born
- 6% · Canada
- Languages at home
- 97% English-only · German/W. Germanic 1% Other Asian/Pacific 1%
Political lean MEDSL · Island
- 2024 margin
- D (+16.6) · D 56.8% · R 40.3% · Other 2.9%
- 2008→2024 swing
- +10.3pp toward D · 2008: 6.2pp · 2024: 16.6pp
- All cycles
- 2024: D+16.6 2020: D+12.0 2016: D+5.9 2012: D+4.4 2008: D+6.2
Not yet ingested
- Civics
- —
Market trends
- HPI YoY
- ▲ 3.59%
- Current HPI
- 227.7902
- Rent YoY
- —
- Metro
- —
- State GDP YoY
- ▲ 4.65%
- F500 in state
- 22
Industry mix (Fortune 500 HQ in WA)
| Industry | F500 HQs | Revenue |
|---|---|---|
| Retail | 2 | $269B |
|
||
| Technology / Retail | 1 | $638B |
|
||
| Technology | 1 | $245B |
|
||
| Telecommunications | 1 | $38B |
|
||
| Food / Beverage | 1 | $36B |
|
||
| Automotive / Trucks | 1 | $34B |
|
||
Price history
+1755.0% since first listed9 events — show timeline
- 2026-04-03 Relisted — NWMLS as Distributed by MLS Grid
- 2026-04-02 Pending — NWMLS as Distributed by MLS Grid
- 2026-02-15 Pending — NWMLS as Distributed by MLS Grid
- 2026-02-04 Price Changed $435,000 NWMLS as Distributed by MLS Grid
- 2025-10-09 Listed $499,000 NWMLS as Distributed by MLS Grid
- 1995-06-01 Sold (Public Records) $126,000 Public Records
- 1994-08-01 Sold (Public Records) $35,000 Public Records
- 1981-01-01 Sold (Public Records) $21,500 Public Records
- 1979-08-01 Sold (Public Records) $23,450 Public Records
Property tax history
+4.2%/yrLatest (2026): $3,743 · +3.5% YoY. Source: county tax records.
Cash-flow waterfall
monthlySold comps — $/sqft
last 12 mo · ≤1 miLoading sold comps…