28383 S 568 Rd · Caney Ridge, OK
Flood risk 4/10 · Minor
- FEMA flood zone
- X (unshaded)
- Chance of flooding over 30 yrs
- 0.22%
- Est. flood insurance / yr
- $507 – $1,088
Fire risk 6/10 · Moderate
- Est. fire insurance / yr
- $2,463 – $4,575
Heat risk 6/10 · Moderate
- Hot days now (above 110°F)
- 7 days/yr
- Hot days in 30 yrs
- 20 days/yr
Wind risk 2/10 · Minimal
- Chance of severe wind over 30 yrs
- 4.0%
Air-quality risk 2/10 · Minimal
- Unhealthy air days now
- 1 days/yr
- Unhealthy air days in 30 yrs
- 1 days/yr
Risk factors via First Street. Map © Google.
Why this score? — see what drove the B+ grade
The composite is a weighted blend of 9 inputs, each scored 0–100. Each bar is that input's sub-score; the figure is the points it added to the 100-point composite (weight × sub-score).
- Cash flow +30.0/30.0
- 1% rule +10.0/10.0
- DSCR +10.0/10.0
- Appreciation +10.0/10.0
- ARV discount +7.5/15.0
- Schools +2.8/10.0
- Rent growth +2.5/5.0
- Livability +2.5/5.0
- Condition / age +2.5/5.0
$25,000
🖨 Deal sheet 📄 Offer letter ✓ Due diligence
Listing remarks
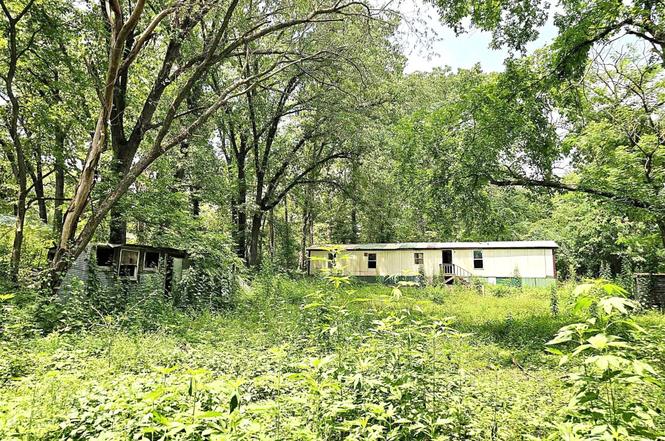
This Lake Tenkiller lot is a blank canvas with no restrictions, ready for your custom vision. The home on the property is ready to be rebuilt, offering a prime opportunity to create your dream lake retreat. Enjoy the freedom to design and build in this serene and scenic location.
Key facts
- Lake tenkiller lot
- Rebuild opportunity
- Dream lake retreat
Tags
Property features AI
Exterior
- Parking: Dirt driveway
- Security: No safety shelter
- Utilities: Electricity available; Water available (rural); Septic tank
- Home design: Single-wide mobile home; 1 story; Faces south; Crawlspace foundation
- Construction: Aluminum siding; Metal roof; Built per public records
- Exterior features: Dirt driveway; Shed(s); Corner lot; Mature trees; Beach access to Tenkiller Lake; Boat ramp/lift access to Tenkiller Lake
Interior
- Kitchen: Built-in range
- Bedrooms: Bedroom details not provided
- Flooring: Wood floors
- Bathrooms: 1 full bathroom
- Heating & cooling: Electric heating; Space heater; Window cooling unit(s)
- Interior features: Aluminum window frames; No additional interior features listed
- Laundry & utility: Electric water heater
Neighborhood map
What this means for you Summary
Snapshot
- This is a 2-bed/2.0-bath manufactured listed at $25k.
Deal economics
- At list price, monthly cash flow is $575 ($7k/yr) — positive.
- The deal already cash-flows at list — no discount required.
- Meets the 1% rule at list price ($946 rent vs $25k).
- Recommended offer: $22k (12.0% below list) — sets the bar for market timing.
Location & tenants
- Location reads: area grade B — affects rentability + tenant quality, not the cash-flow math above.
- Tenkiller (rural): math 30% / reading 30% proficiency, ranked #268 of 513 in OK (top 52%) — families likely to look elsewhere, expect single-tenant / working-renter base with shorter leases; 68% free/reduced lunch — lower-income household profile, screen leases tightly.
- Market conditions: 10 active listings in the ZIP; 48 units permitted in Cherokee County in 2024 (0 in 5+ unit buildings).
Forward outlook
- In year one you build about $3k of equity ($173 loan paydown + $2k appreciation (10.0% local appreciation)).
- Cherokee County population projected at +15% by 2050 — modest demand growth; plan on rents tracking national, not racing it.
- At projected returns (10.0% appreciation + 3.0% rent growth), your $7k cash investment doubles in ~1 year — after that, you're playing with house money.
- By year 10, paydown + projected appreciation supports a ~$32k cash-out refi (75% LTV) — recoverable capital for the next deal without selling this one.
Negotiation context
- It's been on market 121 days — a 12% lower offer ($22k) is reasonable based on typical stale-listing flexibility.
- 6 sale attempts since 22y ago with the ask held roughly flat each time — persistent listings suggest the price (not the market) is what's stuck; bring a comps-based counter.
Risks & watch-outs
- Climate carrying-cost: major wildfire risk; extreme-heat days projected 7→20/yr by 2055 (HVAC capex compounding) — expect insurance premiums to compound above CPI over the hold.
Questions for the listing agent
- It's been on market 121 days. Have you received any prior offers? Is the seller open to a 12% concession, seller financing, or rate buy-down credit?
- Built in 1960 — when were the roof, HVAC, electrical panel, plumbing, and water heater last replaced?
- Why hasn't it sold? Are there any deal-killer items the seller is aware of (foundation, flood, title, zoning, code violations)?
- Is there a deadline driving the sale (1031 exchange, divorce, estate, relocation)? That informs how much negotiation room exists.
- What's the average days-on-market for RENTAL listings here right now (not sales)? A rising rental-DOM trend means longer vacancies and softer asking-rent achievability than the comps imply.
- What's the recent tenant-quality profile in this submarket — average credit score on applications, eviction rate, late-payment / NSF rate, and stable-employment percentage? A property-management company in the area should have these aggregated.
- How much new for-sale + rental construction is in the pipeline within 1–3 miles? Heavy new supply typically softens prices + rents 12–24 months out; constrained supply supports both.
Investment metrics
- 1% rule
- 3.78% ✓
- Cap rate
- 33.88%
- Cash-on-cash
- 98.53%
- DSCR
- 5.38
- GRM
- 2.2
CMA / ARV
No comps found within radius.
Projected returns pro-forma
10.0% appreciation · 3.0% rent growth · sell at horizon
- IRR
- —
- Equity multiple
- 8.18×
- Total profit
- $50,236
- Equity at exit
- $22,522
- IRR
- —
- Equity multiple
- 18.03×
- Total profit
- $119,178
- Equity at exit
- $48,570
Cash invested: $7,000 (down + closing). Projections, not guarantees.
Landlord ↔ Tenant lean methodology
- Overall (STATE)
- 83 Strongly Landlord-Friendly
- State Oklahoma
- 83 Strongly Landlord-Friendly · R+20
- County
- — inherits STATE
- City
- — inherits STATE
ZIP-level market 74471
- Home prices YoY
- 4.1%
- Active inventory
- 10
- Price-to-rent
- 2.2×
Monthly cashflow live
- Estimated rent
- $946 medium interval (Pro) →
- Mortgage (P&I)
- −$131
- Tax est. 1.5%
- −$31 /mo · $375/yr
- Insurance
- −$10
- HOA
- −$0
- Vacancy / Maint / Mgmt
- −$199
- Net cashflow
- $575
Break-even live
UW: 25.0% down · 7.5% · 30yr · 1.5% tax · 5.0% vac · 8.0% maint · 8.0% mgmt
Financing live
Cash to close
- Down payment
- $6,250
- Closing costs
- $750
- Reserves months
- —
- Total cash needed
- —
Loan-product check · same deal, 3 products live
Conventional
25% down · 7.5% · 30yr
- Down + closing
- —
- Monthly P&I
- —
- Monthly cashflow
- —
- DSCR
- —
- Eligible?
- —
Personal DTI + credit; lowest rate.
DSCR
20% down · 8.5% · 30yr
- Down + closing
- —
- Monthly P&I
- —
- Monthly cashflow
- —
- DSCR
- —
- Eligible?
- —
No personal income docs; deal must DSCR.
Hard money
10% down · 12.0% · 12mo
- Down + closing
- —
- Monthly P&I
- —
- Monthly cashflow
- —
- DSCR
- —
- Eligible?
- —
Short-term bridge; refi at stabilization.
Listing history 25 events
-
2026-06-18days on market $25,000 Active 121 DOM
-
2026-06-17days on market $25,000 Active 120 DOM
-
2026-06-16days on market $25,000 Active 119 DOM
-
2026-06-15days on market $25,000 Active 118 DOM
-
2026-06-13days on market $25,000 Active 116 DOM
-
2026-06-12days on market $25,000 Active 115 DOM
-
2026-06-09days on market $25,000 Active 112 DOM
-
2026-06-08days on market $25,000 Active 111 DOM
-
2026-06-08days on market $25,000 Active 110 DOM
-
2026-06-07days on market $25,000 Active 109 DOM
-
2026-06-04days on market $25,000 Active 106 DOM
-
2026-06-02days on market $25,000 Active 105 DOM
-
2026-06-01days on market $25,000 Active 104 DOM
-
2026-05-31days on market $25,000 Active 103 DOM
-
2026-02-17$25,000 Active
-
2026-02-17historical
-
2025-08-23historical
-
2025-08-22$35,000 Active
-
2025-02-21$35,000 Active
-
2025-02-21historical
-
2024-10-29status Active
-
2024-10-03status Pending
-
2024-07-24$35,000 Active
-
2004-07-21historical
-
2004-01-21$35,000
ⓘ Source: listings_history table (triggers on properties + properties_extension) + one-shot
backfill from property_details.listing_events for pre-trigger history.
Climate risk First Street
- Flood 4/10 Moderate FEMA zone X (unshaded) · 22% chance over 30 yrs
- Wildfire 6/10 Major
- Heat 6/10 Major 7 d/yr ≥110°F today · 20 d/yr by 30 yrs out
- Wind 2/10 Low 4% chance of damaging wind over 30 yrs
- Air quality 2/10 Low 1 unhealthy d/yr today · 1 by 30 yrs out
Nearby sold comps map
Loading sold comps map…
Walkable amenities ~0.75 mi
Loading nearby amenities…
Taxation est. · year 1
- Rental income
- $11,355
- − Mortgage interest
- −$1,400
- − Property taxes
- −$375
- − Insurance
- −$125
- − Repairs & maintenance
- −$908
- − Management
- −$908
- − Depreciation
- −$727
- Taxable income
- $6,910
- Est. tax owed @ 24.0%
- −$1,658
- After-tax cash flow
- $5,238/yr
For passive investors: Depreciation is non-cash, so a rental often shows a tax loss while cash-flowing — sheltering income. Rental losses are passive: they offset passive income freely, and up to $25,000/yr can offset ordinary (W-2) income if you actively participate and your MAGI is under $100k (phasing out to $0 by $150k); unused losses carry forward. On sale, claimed depreciation is recaptured at up to 25%, and gains may owe capital-gains tax (a 1031 exchange can defer both). Figures are a year-1 estimate at your 24.0% rate — not tax advice; consult a CPA.
Schools (NCES district)
- District
- Tenkiller
- NCES district ID
- 4029670
- Math proficiency
- 30% ▲ 5.00%
- Reading proficiency
- 30% ▲ 5.00%
- Median HH income
- $36,042
- Composite
- 27.71/100
- National rank
- #12314
- State rank
- #268 of 513 in OK
Livability — Caney Ridge
No livability data for this city. (Only ~50 U.S. cities are tracked.)
Census & demographics
- Census place
- Caney Ridge, OK
- Population (ZIP)
- 1,499
Population outlook (Cherokee County) Hauer SSP2
- Today (2025)
- 51,747 people
- By 2030
- 53,481 · +3.4%
- By 2040
- 56,503 · +9.2%
- By 2050
- 59,370 · +14.7%
- By 2075
- 67,178 · +29.8%
- By 2100
- 70,900 · +37.0%
Race, ethnicity, and origin ACS 2023
- Neighborhood character
- Highly diverse neighborhood (Simpson 0.74)
- Race & ethnicity
- White 51% Native American 30% Two or more races 16% Hispanic / Latino 3% Asian 1% Black 1%
- Common ancestry
- Slovak 1% Iranian 1% Serbian 1%
- Foreign-born
- 1%
- Languages at home
- 92% English-only · Spanish 3% Tagalog/Filipino 1% Other Asian/Pacific 1%
Political lean MEDSL · Cherokee
- 2024 margin
- Solid R (+32.6) · D 32.7% · R 65.3% · Other 2.0%
- 2008→2024 swing
- -20.4pp toward R · 2008: -12.2pp · 2024: -32.6pp
- All cycles
- 2024: R+32.6 2020: R+29.3 2016: R+27.5 2012: R+14.1 2008: R+12.2
Not yet ingested
- Civics
- —
Market trends
- HPI YoY
- ▲ 12.54%
- Current HPI
- 318.6079
- Rent YoY
- —
- Metro
- —
- State GDP YoY
- ▲ 1.55%
- F500 in state
- 6
Industry mix (Fortune 500 HQ in OK)
| Industry | F500 HQs | Revenue |
|---|---|---|
| Energy | 3 | $48B |
|
||
Price history
-28.6% since first listed11 events — show timeline
- 2026-02-17 Listing Removed — MLS Technology, Inc.
- 2026-02-17 Listed $25,000 MLS Technology, Inc.
- 2025-08-23 Listing Removed — MLS Technology, Inc.
- 2025-08-22 Listed $35,000 MLS Technology, Inc.
- 2025-02-21 Listing Removed — MLS Technology, Inc.
- 2025-02-21 Listed $35,000 MLS Technology, Inc.
- 2024-10-29 Relisted — MLS Technology, Inc.
- 2024-10-03 Pending — MLS Technology, Inc.
- 2024-07-24 Listed $35,000 MLS Technology, Inc.
- 2004-07-21 Listing Removed — MLS Technology, Inc.
- 2004-01-21 Listed $35,000 MLS Technology, Inc.
Property tax history
+2.0%/yrLatest (2025): $42 · -33.3% YoY. Source: county tax records.
Cash-flow waterfall
monthlySold comps — $/sqft
last 12 mo · ≤1 miLoading sold comps…