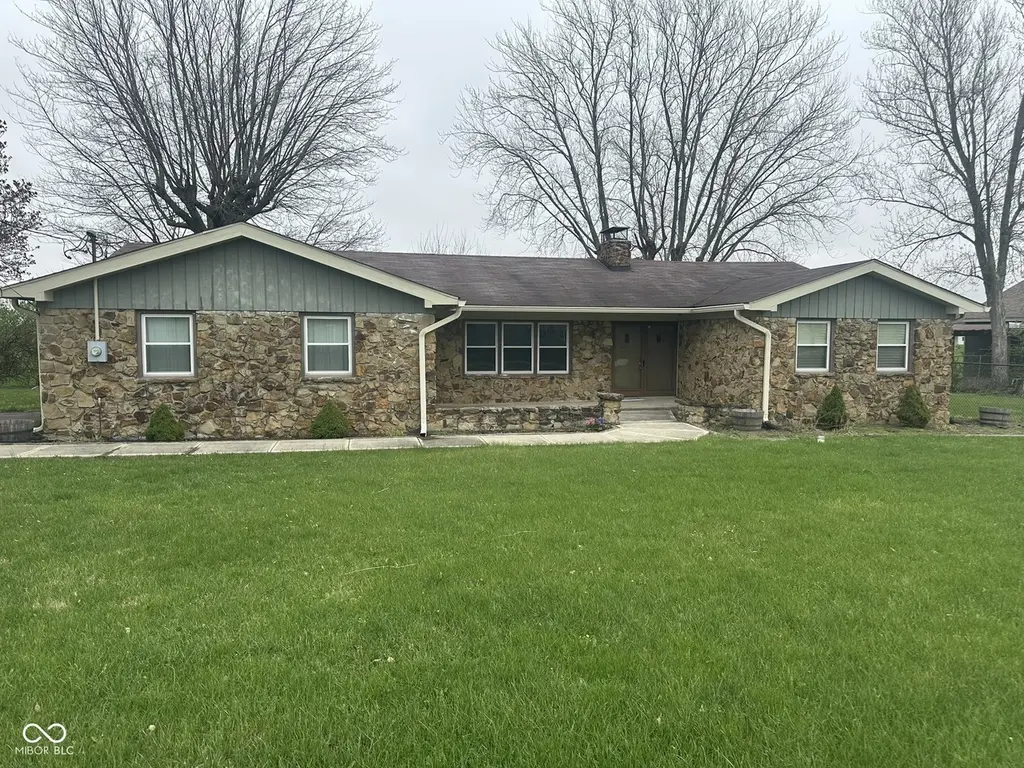
1639 N Buck Creek Rd · Cumberland, IN
Flood risk 1/10 · Minimal
- FEMA flood zone
- X (unshaded)
- Chance of flooding over 30 yrs
- 0.0%
- Est. flood insurance / yr
- $473 – $860
Fire risk 1/10 · Minimal
- Est. fire insurance / yr
- $717 – $1,331
Heat risk 3/10 · Minor
- Hot days now (above 101°F)
- 7 days/yr
- Hot days in 30 yrs
- 18 days/yr
Wind risk 2/10 · Minimal
- Chance of severe wind over 30 yrs
- 1.0%
Air-quality risk 2/10 · Minimal
- Unhealthy air days now
- 1 days/yr
- Unhealthy air days in 30 yrs
- 2 days/yr
Risk factors via First Street. Map © Google.
Why this score? — see what drove the D grade
The composite is a weighted blend of 9 inputs, each scored 0–100. Each bar is that input's sub-score; the figure is the points it added to the 100-point composite (weight × sub-score).
- Cash flow +12.8/30.0
- ARV discount +11.6/15.0
- Schools +4.1/10.0
- DSCR +3.8/10.0
- 1% rule +3.6/10.0
- Rent growth +3.2/5.0
- Livability +3.1/5.0
- Condition / age +2.5/5.0
- Appreciation +0.0/10.0
$250,000
🖨 Deal sheet 📄 Offer letter ✓ Due diligence
Listing remarks MLS
Great place 3 bedroom 2 bath with full finished basement on .46 acre lot.Great room with fireplace, nice eat-in kitchen, big laundry room, nice glassed in finished porch.Personal property (Washer and Dryer not included)
Key facts
- Generous lot
- Charming porch
- Practical shed
Tags
Neighborhood map
What this means for you Summary
Snapshot
- This is a 3-bed/2.0-bath single-family listed at $250k.
Deal economics
- At list price, monthly cash flow is $-23 ($-277/yr) — negative.
- To cash-flow at today's rent, offer at most $247k (1.3% below list).
- To meet the 1% rule (rent ≥ 1% of price), the offer needs to be $216k (13.7% below list).
- Recommended offer: $216k (13.7% below list) — sets the bar for 1% rule.
- Cap rate 6.2% vs local median 3.8% in Cumberland — top-decile yield for the area; either an underpriced asset or a hidden risk that comps aren't pricing in. Stress-test before assuming the spread holds.
Location & tenants
- Location reads 62/100 on livability (#486 in IN) — a middle-class / working-renter tenant base. Strengths: cost of living A+, housing A+, employment A-; Watch: crime D+, amenities F, commute F.
- Mt Vernon Community School Corporation (rural): math 43% / reading 48% proficiency, ranked #70 of 301 in IN (top 23%) — families likely to look elsewhere, expect single-tenant / working-renter base with shorter leases; only 18% free/reduced lunch — higher-income household profile.
- Zoned schools: Mt Comfort Elementary School (math 43% / reading 40%, grade F, #478 of 994 statewide, top 49%, 650 students, 39% FRL); Mt Vernon High School (math 41% / reading 71%, grade C, #73 of 369 statewide, top 20%, 1,431 students, 27% FRL) — zoned schools average 33% FRL vs 18% district-wide (15 pts higher); higher-poverty schools than district average — tighter screening recommended.
- Market conditions: Rents rising (+2.9%/yr); 481 active listings in the ZIP; 6 comparable units currently listed for rent nearby; rentals leasing fast (median 2d on market — plan ~1-2 weeks tenant-placement turnaround); solid renter incomes; 1,091 units permitted in Hancock County in 2024 (0 in 5+ unit buildings).
- This rent runs 31% of the median local income ($83k/yr) — at the standard rent-burdened threshold; future hikes will face affordability resistance.
Forward outlook
- Local home prices are declining (-3.0%/yr); year-one equity from $2k of loan paydown is wiped out by about $8k of value loss. Plan a longer hold.
- Hancock County population projected at +7% by 2050 — modest demand growth; plan on rents tracking national, not racing it.
Negotiation context
- Only 6 days on market — expect competitive offers; lowballing is unlikely to land.
- 3 sale attempts since 14y ago with the ask held roughly flat each time — persistent listings suggest the price (not the market) is what's stuck; bring a comps-based counter.
- Current owner paid $190k; 32% above their basis — modest negotiation headroom, anchor on the comps not their cost.
Questions for the listing agent
- What do current leases actually rent for vs. the listed asking? Can we see a recent rent roll and the last 12 months of T-12 income?
- Built in 1967 — when were the roof, HVAC, electrical panel, plumbing, and water heater last replaced?
- Is there a deadline driving the sale (1031 exchange, divorce, estate, relocation)? That informs how much negotiation room exists.
- Schools are F-rated, which usually means shorter tenancies and higher turnover. Who's the typical renter profile here, and what's been the actual vacancy rate?
- Crime grade is D in this area — have there been break-ins, vandalism, or insurance claims at this property in the last 3 years? What carrier currently insures it and at what premium?
- The area grade is low — what's the realistic commute time and amenity access for the typical tenant pool here? Any planned neighborhood developments (good or bad) we should know about?
- What's the average days-on-market for RENTAL listings here right now (not sales)? A rising rental-DOM trend means longer vacancies and softer asking-rent achievability than the comps imply.
- What's the recent tenant-quality profile in this submarket — average credit score on applications, eviction rate, late-payment / NSF rate, and stable-employment percentage? A property-management company in the area should have these aggregated.
- How much new for-sale + rental construction is in the pipeline within 1–3 miles? Heavy new supply typically softens prices + rents 12–24 months out; constrained supply supports both.
Investment metrics
- 1% rule
- 0.86% ✗
- Cap rate
- 6.18%
- Cash-on-cash
- -0.40%
- DSCR
- 0.98
- GRM
- 9.7
CMA / ARV
- ARV (on-the-fly)
- $275,060
- Comps found
- 12
Show comp detail 12 sales within ~0.75 mi
| Address | Dist | Beds/Ba | Sqft | Sold | Price | $/sf | Match |
|---|---|---|---|---|---|---|---|
| 2716 Autumn Rd | 0.09mi | 3/2.0 | 1,618 (0%) | 4mo | $255,000 | $158 | 92 |
| 2698 Cabin Hill Rd | 0.14mi | 3/2.0 | 1,618 (0%) | 4mo | $265,000 | $164 | 91 |
| 2748 Autumn Rd | 0.11mi | 3/2.0 | 1,618 (0%) | 7mo | $259,000 | $160 | 89 |
| 2427 Apple Tree Ln | 0.32mi | 3/2.0 | 1,618 (0%) | 13mo | $265,000 | $164 | 74 |
| 12299 Rustic Meadow Dr | 0.21mi | 3/2.0 | 1,804 (+12%) | 1mo | $289,000 | $160 | 70 |
| 1733 N Buck Creek Rd | 0.09mi | 3/1.5 | 1,470 (-9%) | 15mo | $315,000 | $214 | 66 |
| 1441 N 700 W | 0.55mi | 3/2.0 | 1,575 (-3%) | 8mo | $275,000 | $175 | 64 |
| 7394 W 100 N | 0.63mi | 3/2.0 | 1,544 (-5%) | 10mo | $302,000 | $196 | 55 |
| 1084 N 700 W | 0.73mi | 3/2.0 | 1,712 (+6%) | 10mo | $333,000 | $195 | 48 |
| 1393 N Salem Ct | 0.52mi | 3/2.0 | 1,836 (+14%) | 9mo | $299,900 | $163 | 46 |
| 1346 N Winchester Dr | 0.60mi | 3/2.0 | 1,790 (+11%) | 15mo | $305,000 | $170 | 42 |
| 1093 N Buckingham Ct | 0.63mi | 3/2.0 | 1,834 (+13%) | 18mo | $320,000 | $174 | 34 |
Match score weights: distance 35% · size 25% · config 20% · recency 20%. Top-matched comps best support the ARV.
Projected returns pro-forma
-3.0% appreciation · 2.88% rent growth · sell at horizon
- IRR
- -17.1%
- Equity multiple
- 0.40×
- Total profit
- $-42,210
- Equity at exit
- $37,276
- IRR
- -9.2%
- Equity multiple
- 0.43×
- Total profit
- $-39,584
- Equity at exit
- $21,615
Cash invested: $70,000 (down + closing). Projections, not guarantees.
Landlord ↔ Tenant lean methodology
- Overall (STATE)
- 90 Strongly Landlord-Friendly
- State Indiana
- 90 Strongly Landlord-Friendly · R+11
- County
- — inherits STATE
- City
- — inherits STATE
ZIP-level market 46140
- Rents YoY
- 2.9%
- Active inventory
- 481
- Price-to-rent
- 9.7×
Monthly cashflow live
- Estimated rent
- $2,158 high interval (Pro) →
- Mortgage (P&I)
- −$1,311
- Tax est. 1.5%
- −$312 /mo · $3,750/yr
- Insurance
- −$104
- HOA
- −$0
- Vacancy / Maint / Mgmt
- −$453
- Net cashflow
- $-23
Break-even live
UW: 25.0% down · 7.5% · 30yr · 1.5% tax · 5.0% vac · 8.0% maint · 8.0% mgmt
Financing live
Cash to close
- Down payment
- $62,500
- Closing costs
- $7,500
- Reserves months
- —
- Total cash needed
- —
Loan-product check · same deal, 3 products live
Conventional
25% down · 7.5% · 30yr
- Down + closing
- —
- Monthly P&I
- —
- Monthly cashflow
- —
- DSCR
- —
- Eligible?
- —
Personal DTI + credit; lowest rate.
DSCR
20% down · 8.5% · 30yr
- Down + closing
- —
- Monthly P&I
- —
- Monthly cashflow
- —
- DSCR
- —
- Eligible?
- —
No personal income docs; deal must DSCR.
Hard money
10% down · 12.0% · 12mo
- Down + closing
- —
- Monthly P&I
- —
- Monthly cashflow
- —
- DSCR
- —
- Eligible?
- —
Short-term bridge; refi at stabilization.
Rent comps 6 comps
| Address | Beds | Baths | Sqft | Rent | $/sqft | DOM | Units | Dist |
|---|---|---|---|---|---|---|---|---|
| 1801 Walt Whitman DR Greenfield, IN | 2.0–3.0 | 1.5–3.5 | 1396 | $2,750 | $1.97 | 1d | 13 | 0.58mi |
| 6857 Poetry Pl Greenfield, IN | 1.0–3.0 | 1.0–2.0 | 990 | $1,785 | $1.80 | 1d | 13 | 0.72mi |
| 2321 Allford Ct Indianapolis, IN | 4.0 | 2.5 | 2148 | $2,305 | $1.07 | 7d | 1 | 0.77mi |
| 2204 Valley Creek West Ln Indianapolis, IN | 4.0 | 2.0 | 1680 | $1,976 | $1.18 | 1d | 1 | 0.88mi |
| 1932 Herford Dr Indianapolis, IN | 3.0 | 2.0 | 1700 | $2,161 | $1.27 | 1d | 1 | 1.00mi |
| 11729 Serenity Ln Indianapolis, IN | 3.0 | 2.0 | 1516 | $1,815 | $1.20 | 23d | 1 | 1.25mi |
Listing history 10 events
-
2026-04-23status Pending
-
2026-04-16$250,000 Active
-
2019-10-21soldstatus $190,000 Sold 219-char remark
Show marketing remark (219 chars)
Great place 3 bedroom 2 bath with full finished basement on .46 acre lot.Great room with fireplace, nice eat-in kitchen, big laundry room, nice glassed in finished porch.Personal property (Washer and Dryer not included)
-
2019-09-20status Pending 219-char remark
Show marketing remark (219 chars)
Great place 3 bedroom 2 bath with full finished basement on .46 acre lot.Great room with fireplace, nice eat-in kitchen, big laundry room, nice glassed in finished porch.Personal property (Washer and Dryer not included)
-
2019-09-09price $199,900 219-char remark
Show marketing remark (219 chars)
Great place 3 bedroom 2 bath with full finished basement on .46 acre lot.Great room with fireplace, nice eat-in kitchen, big laundry room, nice glassed in finished porch.Personal property (Washer and Dryer not included)
-
2019-09-01$215,000 Active 219-char remark
Show marketing remark (219 chars)
Great place 3 bedroom 2 bath with full finished basement on .46 acre lot.Great room with fireplace, nice eat-in kitchen, big laundry room, nice glassed in finished porch.Personal property (Washer and Dryer not included)
-
2013-04-01soldstatus $76,500
-
2013-03-12historical 349-char remark
Show marketing remark (349 chars)
Incredible price on this newly remodeled, sprawling brick ranch in Greenfield. Sitting on ½ acre lot and nestled in a rural location, this home truly has it all -- above ground pool w/deck, fenced rear yard, barn, oversized 2-car garage, hardwood floors, enclosed glass patio, 2 fireplaces and partially finished basement. This is a must see!
-
2013-03-05soldstatus $76,500 349-char remark
Show marketing remark (349 chars)
Incredible price on this newly remodeled, sprawling brick ranch in Greenfield. Sitting on ½ acre lot and nestled in a rural location, this home truly has it all -- above ground pool w/deck, fenced rear yard, barn, oversized 2-car garage, hardwood floors, enclosed glass patio, 2 fireplaces and partially finished basement. This is a must see!
-
2012-06-27$79,900 349-char remark
Show marketing remark (349 chars)
Incredible price on this newly remodeled, sprawling brick ranch in Greenfield. Sitting on ½ acre lot and nestled in a rural location, this home truly has it all -- above ground pool w/deck, fenced rear yard, barn, oversized 2-car garage, hardwood floors, enclosed glass patio, 2 fireplaces and partially finished basement. This is a must see!
ⓘ Source: listings_history table (triggers on properties + properties_extension) + one-shot
backfill from property_details.listing_events for pre-trigger history.
Climate risk First Street
- Flood 1/10 Low FEMA zone X (unshaded) · 0% chance over 30 yrs
- Wildfire 1/10 Low
- Heat 3/10 Moderate 7 d/yr ≥101°F today · 18 d/yr by 30 yrs out
- Wind 2/10 Low 100% chance of damaging wind over 30 yrs
- Air quality 2/10 Low 1 unhealthy d/yr today · 2 by 30 yrs out
Nearby sold comps map
Loading sold comps map…
Walkable amenities ~0.75 mi
Loading nearby amenities…
Taxation est. · year 1
- Rental income
- $25,892
- − Mortgage interest
- −$14,004
- − Property taxes
- −$3,750
- − Insurance
- −$1,250
- − Repairs & maintenance
- −$2,071
- − Management
- −$2,071
- − Depreciation
- −$7,273
- Taxable loss
- −$4,527
- Est. tax savings @ 24.0%
- +$1,086
- After-tax cash flow
- $809/yr
For passive investors: Depreciation is non-cash, so a rental often shows a tax loss while cash-flowing — sheltering income. Rental losses are passive: they offset passive income freely, and up to $25,000/yr can offset ordinary (W-2) income if you actively participate and your MAGI is under $100k (phasing out to $0 by $150k); unused losses carry forward. On sale, claimed depreciation is recaptured at up to 25%, and gains may owe capital-gains tax (a 1031 exchange can defer both). Figures are a year-1 estimate at your 24.0% rate — not tax advice; consult a CPA.
Schools (NCES district)
- District
- Mt Vernon Community School Corporation
- NCES district ID
- 1807260
- Math proficiency
- 43% ▼ -12.00%
- Reading proficiency
- 48% ▼ -7.00%
- Median HH income
- $73,671
- Composite
- 41.3/100
- National rank
- #3514
- State rank
- #70 of 301 in IN
Livability — Cumberland
- Score
- 62/100
- State rank
- #486
- US rank
- #17302
Category grades
Schools grade is shown separately in the Schools card above.
Census & demographics
- County
- Hancock County · 59,521 people
- Metro
- Indianapolis-Carmel-Anderson, IN
- Population (ZIP)
- 43,511
- Household income
- $83,056
- Rent vs Own
- Severe rent burden
- 795.0
Population outlook (Hancock County) Hauer SSP2
- Today (2025)
- 77,820 people
- By 2030
- 79,914 · +2.7%
- By 2040
- 82,734 · +6.3%
- By 2050
- 83,348 · +7.1%
- By 2075
- 82,439 · +5.9%
- By 2100
- 74,181 · -4.7%
Race, ethnicity, and origin ACS 2023
- Neighborhood character
- Predominantly White (92%)
- Race & ethnicity
- White 92% Two or more races 5% Hispanic / Latino 3% Black 1%
- Common ancestry
- Italian 3% Lithuanian 3% Slovak 1%
- Foreign-born
- 3% · Canada
- Languages at home
- 96% English-only · Spanish 2% Other Indo-European 1%
Political lean MEDSL · Hancock
- 2024 margin
- Solid R (+33.7) · D 32.2% · R 65.9% · Other 1.9%
- 2008→2024 swing
- -4.1pp toward R · 2008: -29.6pp · 2024: -33.7pp
- All cycles
- 2024: R+33.7 2020: R+37.5 2016: R+44.8 2012: R+41.0 2008: R+29.6
Not yet ingested
- Civics
- —
Market trends
- HPI YoY
- ▼ -131.67%
- Current HPI
- 225.0367
- Rent YoY
- ▲ 2.88%
- Metro
- Indianapolis-Carmel-Anderson, IN
- State GDP YoY
- ▲ 2.90%
- F500 in state
- 18
Industry mix (Fortune 500 HQ in IN)
| Industry | F500 HQs | Revenue |
|---|---|---|
| Industrial Machinery | 2 | $37B |
|
||
| Healthcare | 1 | $177B |
|
||
| Pharmaceuticals | 1 | $45B |
|
||
| Metals / Steel | 1 | $18B |
|
||
| Agriculture | 1 | $17B |
|
||
| Packaging | 1 | $12B |
|
||
Price history
+212.9% since first listed10 events — show timeline
- 2026-04-23 Pending — MIBOR as Distributed by MLS Grid
- 2026-04-16 Listed $250,000 MIBOR as Distributed by MLS Grid
- 2019-10-21 Sold (MLS) $190,000 MIBOR as Distributed by MLS Grid
- 2019-09-20 Pending — MIBOR as Distributed by MLS Grid
- 2019-09-09 Price Changed $199,900 MIBOR as Distributed by MLS Grid
- 2019-09-01 Listed $215,000 MIBOR as Distributed by MLS Grid
- 2013-04-01 Sold (Public Records) $76,500 Public Records
- 2013-03-12 Listing Removed — MIBOR as Distributed by MLS Grid
- 2013-03-05 Sold (MLS) $76,500 MIBOR as Distributed by MLS Grid
- 2012-06-27 Listed $79,900 MIBOR as Distributed by MLS Grid
Property tax history
-43.6%/yrLatest (2021): $15 · -50.0% YoY. Source: county tax records.
Cash-flow waterfall
monthlySold comps — $/sqft
last 12 mo · ≤1 miLoading sold comps…