 Multi-family
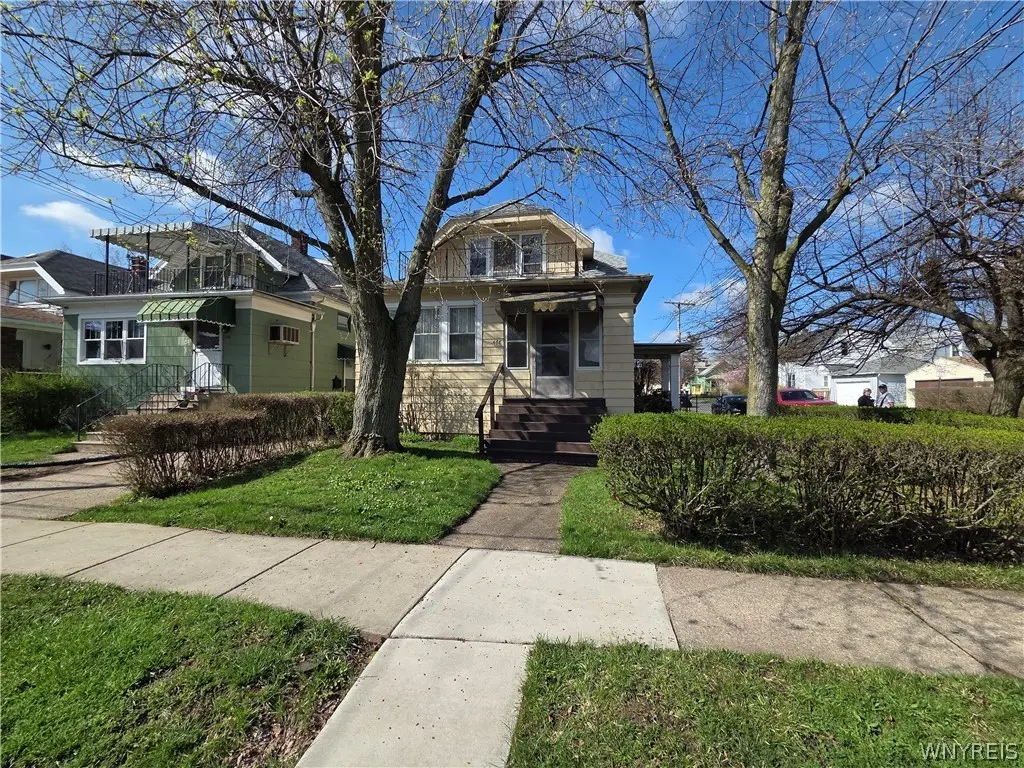
468 Lisbon Ave · Buffalo, NY
Flood risk 1/10 · Minimal
- FEMA flood zone
- X (unshaded)
- Chance of flooding over 30 yrs
- 0.0%
- Est. flood insurance / yr
- $507 – $1,088
Fire risk 1/10 · Minimal
- Est. fire insurance / yr
- $691 – $1,283
Heat risk 3/10 · Minor
- Hot days now (above 92°F)
- 7 days/yr
- Hot days in 30 yrs
- 15 days/yr
Wind risk 1/10 · Minimal
- Chance of severe wind over 30 yrs
- —
Air-quality risk 3/10 · Minor
- Unhealthy air days now
- 2 days/yr
- Unhealthy air days in 30 yrs
- 3 days/yr
Risk factors via First Street. Map © Google.
Why this score? — see what drove the C grade
The composite is a weighted blend of 9 inputs, each scored 0–100. Each bar is that input's sub-score; the figure is the points it added to the 100-point composite (weight × sub-score).
- Cash flow +27.6/30.0
- DSCR +9.7/10.0
- 1% rule +7.5/10.0
- Livability +3.9/5.0
- Schools +3.3/10.0
- Rent growth +2.7/5.0
- Condition / age +2.5/5.0
- ARV discount +0.0/15.0
- Appreciation +0.0/10.0
$189,900
🖨 Deal sheet 📄 Offer letter ✓ Due diligence
Multi-family units
County records classify this as Multi-Family (2-4 Unit). Listing-text estimate: 1 unit. estimate disagrees with records
Listing remarks
Spacious and well-maintained multifamily home in the heart of the sought-after University District! This solid investment opportunity features a lower two-bedroom unit showcasing hardwood floors throughout, stunning leaded glass windows, and an abundance of original charm. The upper unit offers a comfortable one-bedroom layout with open porch and is currently tenant-occupied, providing immediate income potential. Additional highlights include a an abundance of storage space, full basement, two-car garage, and a fully fenced yard—perfect for added convenience and outdoor enjoyment. Ideally located just minutes from shopping, dining, public transportation, and local universities. Whethe
Key facts
- Leaded glass windows
- Full basement
- Storage space
Tags
Property features AI
Finance
- Financial info: Property configured as 2 total units; Owner pays trash collection and water; Operating expenses include maintenance, trash, and water; Unit rents: one unit at $650/month; the other is month-to-month
Exterior
- Parking: Attached garage with two spaces; Concrete driveway
- Utilities: Public water connected; Sewer connected; High-speed internet available; Circuit breaker electrical
- Home design: Two-story multifamily property; Corner lot; City street frontage; Resale condition
- Construction: Composite siding; Copper plumbing; Block foundation; Existing year built
- Exterior features: Fully fenced yard; Open porch
Interior
- Kitchen: Eat-in kitchens in both units
- Bedrooms: One 1-bedroom unit; One 2-bedroom unit
- Flooring: Carpet; Hardwood; Vinyl; Varies
- Bathrooms: Two full bathrooms (one in each unit)
- Heating & cooling: Gas forced air heating
- Interior features: Ceiling fans; Natural woodwork; Full basement
- Laundry & utility: Gas water heater; Separate gas and electric meters for each unit
Neighborhood map
What this means for you Summary
Snapshot
- This is a 3-bed/2.0-bath multifamily listed at $190k.
Deal economics
- At list price, monthly cash flow is $569 ($7k/yr) — positive.
- The deal already cash-flows at list — no discount required.
- Meets the 1% rule at list price ($2k rent vs $190k).
- Cap rate 9.9% vs local median 8.0% in Buffalo — meaningfully above typical; check what's discounted (condition, days-on-market, listing class) to confirm the premium yield is real.
Location & tenants
- Location reads 77/100 on livability (#195 in NY, #3,011 nationally) — a middle-class / working-renter tenant base. Strengths: commute A+, housing A+, health & safety A+; Watch: crime F, employment D-.
- Buffalo City School District (urban): math 41% / reading 40% proficiency, ranked #535 of 590 in NY (top 91%) — families likely to look elsewhere, expect single-tenant / working-renter base with shorter leases; 75% free/reduced lunch — lower-income household profile, screen leases tightly.
- Market conditions: Rents flat; 237 active listings in the ZIP; 19 comparable units currently listed for rent nearby; rentals at typical pace (median 24d on market — plan ~3-4 weeks tenant-placement turnaround); lower-income renter base — watch delinquency; 1,244 units permitted in Erie County in 2024 (563 in 5+ unit buildings).
- At $2,382/mo this rent would consume 64% of the median local household income ($45k/yr) (locally 2873% of renters already pay >50% of income on rent) — very limited rent-growth headroom before tenants either downsize or default.
Forward outlook
- Local home prices are declining (-3.0%/yr); year-one equity from $1k of loan paydown is wiped out by about $6k of value loss. Plan a longer hold.
Negotiation context
- Only 13 days on market — expect competitive offers; lowballing is unlikely to land.
- 2 sale attempts with the ask held roughly flat each time — persistent listings suggest the price (not the market) is what's stuck; bring a comps-based counter.
Risks & watch-outs
- Watch-outs: built in 1925 — expect roof / HVAC / electrical / plumbing capex.
Questions for the listing agent
- Built in 1925 — when were the roof, HVAC, electrical panel, plumbing, and water heater last replaced?
- Is there a deadline driving the sale (1031 exchange, divorce, estate, relocation)? That informs how much negotiation room exists.
- Crime grade is F in this area — have there been break-ins, vandalism, or insurance claims at this property in the last 3 years? What carrier currently insures it and at what premium?
- What's the average days-on-market for RENTAL listings here right now (not sales)? A rising rental-DOM trend means longer vacancies and softer asking-rent achievability than the comps imply.
- What's the recent tenant-quality profile in this submarket — average credit score on applications, eviction rate, late-payment / NSF rate, and stable-employment percentage? A property-management company in the area should have these aggregated.
- How much new apartment / multifamily construction is in the pipeline within 1–3 miles? Heavy new supply (>2% of stock underway) typically softens rents 12–24 months out; light construction supports rent growth.
Investment metrics
- 1% rule
- 1.25% ✓
- Cap rate
- 9.89%
- Cash-on-cash
- 12.85%
- DSCR
- 1.57
- GRM
- 6.6
CMA / ARV
- ARV (on-the-fly)
- $133,278
- Comps found
- 8
Show comp detail 8 sales within ~0.75 mi
| Address | Dist | Beds/Ba | Sqft | Sold | Price | $/sf | Match |
|---|---|---|---|---|---|---|---|
| 496 Lisbon Ave | 0.05mi | 4/2.0 (+1) | 1,500 (+9%) | 10mo | $155,000 | $103 | 69 |
| 516 Dartmouth Ave | 0.36mi | 4/2.0 (+1) | 1,485 (+8%) | 1mo | $140,000 | $94 | 64 |
| 188 Westminster Ave | 0.40mi | 4/2.0 (+1) | 1,326 (-4%) | 12mo | $129,000 | $97 | 60 |
| 420 Berkshire Ave | 0.39mi | 4/2.0 (+1) | 1,391 (+1%) | 22mo | $160,000 | $115 | 56 |
| 95 Westminster Ave | 0.47mi | 3/2.0 | 1,270 (-8%) | 12mo | $109,500 | $86 | 55 |
| 587 Lisbon Ave | 0.23mi | 4/2.0 (+1) | 1,573 (+14%) | 7mo | $210,000 | $134 | 55 |
| 49 Thornton Ave | 0.57mi | 4/2.0 (+1) | 1,529 (+11%) | 6mo | $100,000 | $65 | 45 |
| 108 Hastings Ave | 0.70mi | 4/2.0 (+1) | 1,463 (+6%) | 18mo | $1,125 | $1 | 36 |
Match score weights: distance 35% · size 25% · config 20% · recency 20%. Top-matched comps best support the ARV.
Projected returns pro-forma
-3.0% appreciation · 0.67% rent growth · sell at horizon
- IRR
- 0.0%
- Equity multiple
- 1.00×
- Total profit
- $73
- Equity at exit
- $28,315
- IRR
- 7.1%
- Equity multiple
- 1.48×
- Total profit
- $25,537
- Equity at exit
- $16,419
Cash invested: $53,172 (down + closing). Projections, not guarantees.
Landlord ↔ Tenant lean methodology
- Overall (STATE)
- 15 Strongly Tenant-Friendly
- State New York
- 15 Strongly Tenant-Friendly · D+10
- County
- — inherits STATE
- City
- — inherits STATE
ZIP-level market 14215
- Home prices YoY
- -30.0%
- Rents YoY
- 0.7%
- Active inventory
- 237
- Price-to-rent
- 12.6×
Monthly cashflow live
- Estimated rent
- $2,382 medium interval (Pro) →
- Mortgage (P&I)
- −$996
- Tax est. 1.5%
- −$237 /mo · $2,848/yr
- Insurance
- −$79
- HOA
- −$0
- Vacancy / Maint / Mgmt
- −$500
- Net cashflow
- $569
Break-even live
2-unit breakdown (identical units grouped — click to expand)
| Units | Beds | Baths | Est. rent |
|---|---|---|---|
| 1× unit | 2 | 1 | $1,257 |
| 1× unit | 1 | 1 | $1,125 |
| Total (2 units) | $2,382 | ||
UW: 25.0% down · 7.5% · 30yr · 1.5% tax · 5.0% vac · 8.0% maint · 8.0% mgmt
Financing live
Cash to close
- Down payment
- $47,475
- Closing costs
- $5,697
- Reserves months
- —
- Total cash needed
- —
Loan-product check · same deal, 3 products live
Conventional
25% down · 7.5% · 30yr
- Down + closing
- —
- Monthly P&I
- —
- Monthly cashflow
- —
- DSCR
- —
- Eligible?
- —
Personal DTI + credit; lowest rate.
DSCR
20% down · 8.5% · 30yr
- Down + closing
- —
- Monthly P&I
- —
- Monthly cashflow
- —
- DSCR
- —
- Eligible?
- —
No personal income docs; deal must DSCR.
Hard money
10% down · 12.0% · 12mo
- Down + closing
- —
- Monthly P&I
- —
- Monthly cashflow
- —
- DSCR
- —
- Eligible?
- —
Short-term bridge; refi at stabilization.
Rent comps 19 comps
| Address | Beds | Baths | Sqft | Rent | $/sqft | DOM | Units | Dist |
|---|---|---|---|---|---|---|---|---|
| 220 Dartmouth Ave Buffalo, NY | 2.0 | 1.0 | 1000 | $1,100 | $1.10 | 23d | 1 | 0.34mi |
| 265 Lisbon Ave Unit 2 Buffalo, NY | 3.0 | 1.0 | 1200 | $1,400 | $1.17 | 43d | 1 | 0.40mi |
| 189 Westminster Ave Buffalo, NY | 4.0 | 1.5 | 1065 | $1,595 | $1.50 | 10d | 1 | 0.44mi |
| 263 Minnesota Ave Unit Upper Buffalo, NY | 3.0 | 1.0 | 1242 | $1,500 | $1.21 | 14d | 1 | 0.45mi |
| 222 Lisbon Ave Unit Upper Buffalo, NY | 3.0 | 1.0 | 1400 | $1,400 | $1.00 | 43d | 1 | 0.48mi |
| 222 Lisbon Ave Buffalo, NY | 4.0 | 1.0 | 1300 | $1,400 | $1.08 | 23d | 1 | 0.48mi |
| 97 Davidson Ave Buffalo, NY | 3.0 | 1.0 | 925 | $1,495 | $1.62 | 1d | 1 | 0.68mi |
| 140 Parkridge Ave Buffalo, NY | 3.0 | 1.0 | 990 | $1,500 | $1.52 | 43d | 1 | 0.79mi |
| 92 Lasalle Ave Unit 1 Buffalo, NY | 2.0 | 1.0 | 1000 | $1,150 | $1.15 | 43d | 1 | 0.80mi |
| 40 Lisbon Ave Unit Upper Buffalo, NY | 2.0 | 1.0 | 1057 | $1,500 | $1.42 | 11d | 1 | 0.82mi |
| 89 Lasalle Ave Buffalo, NY | 1.0–4.0 | 1.0–4.0 | 1024 | $2,291 | $2.24 | 1d | 10 | 0.86mi |
| 60 Englewood Ave Buffalo, NY | 4.0 | 1.0 | 1400 | $1,650 | $1.18 | 1d | 1 | 0.89mi |
| 26 Custer St Buffalo, NY | 2.0 | 1.0 | 1000 | $1,300 | $1.30 | 43d | 1 | 0.90mi |
| 91 Springville Ave Buffalo, NY | 4.0 | 2.0 | 1660 | $2,350 | $1.42 | 23d | 1 | 1.01mi |
| 44 Aurora Dr Buffalo, NY | 3.0 | 1.0 | 1272 | $3,300 | $2.59 | 1d | 1 | 1.30mi |
| 163 Carmel Rd Buffalo, NY | 3.0 | 1.0 | 1400 | $1,800 | $1.29 | 3d | 1 | 1.39mi |
| 348 Capen Blvd Buffalo, NY | 3.0 | 1.5 | 1424 | $2,200 | $1.54 | 1d | 1 | 1.40mi |
| 17 Proctor Ave Unit 1 Buffalo, NY | 2.0 | 1.0 | 900 | $1,100 | $1.22 | 43d | 1 | 1.42mi |
| 74 Dorris Ave Buffalo, NY | 3.0 | 1.0 | 1200 | $1,450 | $1.21 | 43d | 1 | 1.44mi |
Listing history 7 events
-
2026-05-01status Pending
-
2026-04-18$189,900 Active
-
2025-12-20historical
-
2025-12-14historical
-
2025-12-14historical
-
2025-12-13historical
-
2025-11-01$189,900 Active
ⓘ Source: listings_history table (triggers on properties + properties_extension) + one-shot
backfill from property_details.listing_events for pre-trigger history.
Climate risk First Street
- Flood 1/10 Low FEMA zone X (unshaded) · 0% chance over 30 yrs
- Wildfire 1/10 Low
- Heat 3/10 Moderate 7 d/yr ≥92°F today · 15 d/yr by 30 yrs out
- Wind 1/10 Low
- Air quality 3/10 Moderate 2 unhealthy d/yr today · 3 by 30 yrs out
Nearby sold comps map
Loading sold comps map…
Walkable amenities ~0.75 mi
Loading nearby amenities…
Taxation est. · year 1
- Rental income
- $28,584
- − Mortgage interest
- −$10,637
- − Property taxes
- −$2,848
- − Insurance
- −$950
- − Repairs & maintenance
- −$2,287
- − Management
- −$2,287
- − Depreciation
- −$5,524
- Taxable income
- $4,051
- Est. tax owed @ 24.0%
- −$972
- After-tax cash flow
- $5,861/yr
For passive investors: Depreciation is non-cash, so a rental often shows a tax loss while cash-flowing — sheltering income. Rental losses are passive: they offset passive income freely, and up to $25,000/yr can offset ordinary (W-2) income if you actively participate and your MAGI is under $100k (phasing out to $0 by $150k); unused losses carry forward. On sale, claimed depreciation is recaptured at up to 25%, and gains may owe capital-gains tax (a 1031 exchange can defer both). Figures are a year-1 estimate at your 24.0% rate — not tax advice; consult a CPA.
Schools (NCES district)
- District
- Buffalo City School District
- NCES district ID
- 3605850
- Math proficiency
- 41% ▲ 11.00%
- Reading proficiency
- 40% ▲ 7.00%
- Median HH income
- $31,665
- Composite
- 33.17/100
- National rank
- #5544
- State rank
- #535 of 590 in NY
Livability — Buffalo
- Score
- 77/100
- State rank
- #195
- US rank
- #3011
Category grades
Schools grade is shown separately in the Schools card above.
Census & demographics
- Census place
- Buffalo, NY
- County
- Erie County · 714,559 people
- City population
- 440,021
- Metro
- Buffalo-Cheektowaga, NY
- Population (ZIP)
- 42,524
- Household income
- $44,955
- Rent vs Own
- Severe rent burden
- 2873.0
Population outlook (Erie County) Hauer SSP2
- Today (2025)
- 933,037 people
- By 2030
- 935,181 · +0.2%
- By 2040
- 928,531 · -0.5%
- By 2050
- 905,725 · -2.9%
- By 2075
- 834,037 · -10.6%
- By 2100
- 708,033 · -24.1%
Race, ethnicity, and origin ACS 2023
- Neighborhood character
- Predominantly Black (67%)
- Race & ethnicity
- Black 67% White 15% Asian 7% Hispanic / Latino 6% Two or more races 6%
- Hispanic origin (detail)
- Puerto Rican 4%
- Common ancestry
- Romanian 4% Lithuanian 1% Italian 1%
- Foreign-born
- 9% · Canada, China
- Languages at home
- 88% English-only · Other Indo-European 4% Spanish 4% Chinese 1%
Political lean MEDSL · Erie
- 2024 margin
- Lean D (+9.7) · D 54.8% · R 45.2%
- 2008→2024 swing
- -7.9pp toward R · 2008: 17.5pp · 2024: 9.7pp
- All cycles
- 2024: D+9.7 2020: D+14.7 2016: D+4.8 2012: D+15.6 2008: D+17.5
Not yet ingested
- Civics
- —
Market trends
- HPI YoY
- ▼ -126.29%
- Current HPI
- 295.2966
- Rent YoY
- ▲ 0.67%
- Metro
- Buffalo-Cheektowaga, NY
- State GDP YoY
- ▲ 2.60%
- F500 in state
- 92
Industry mix (Fortune 500 HQ in NY)
| Industry | F500 HQs | Revenue |
|---|---|---|
| Financial Services | 10 | $950B |
|
||
| Consumer Goods | 9 | $162B |
|
||
| Insurance | 4 | $225B |
|
||
| Telecommunications | 2 | $144B |
|
||
| Pharmaceuticals | 2 | $112B |
|
||
| Media / Entertainment | 2 | $69B |
|
||
Price history
+0.0% since first listed7 events — show timeline
- 2026-05-01 Pending — WNYREIS
- 2026-04-18 Listed $189,900 WNYREIS
- 2025-12-20 Listing Removed — WNYREIS
- 2025-12-14 Listing Removed — WNYREIS
- 2025-12-14 Listing Removed — WNYREIS
- 2025-12-13 Listing Removed — WNYREIS
- 2025-11-01 Listed $189,900 WNYREIS
Property tax history
+3.2%/yrLatest (2025): $325 · +0.0% YoY. Source: county tax records.
Cash-flow waterfall
monthlySold comps — $/sqft
last 12 mo · ≤1 miLoading sold comps…