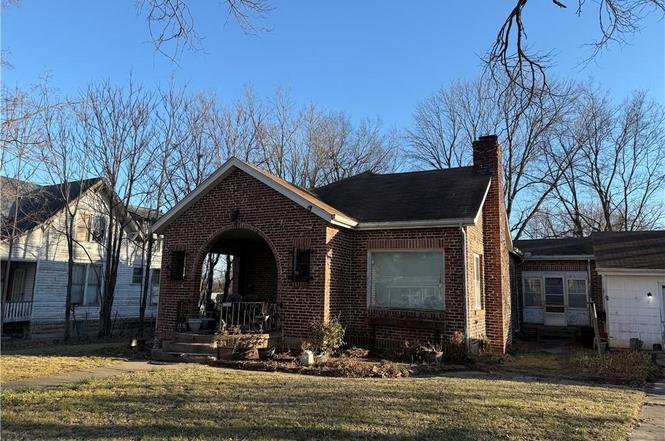
717 E Poplar St · Independence, KS
Flood risk 1/10 · Minimal
- FEMA flood zone
- X (unshaded)
- Chance of flooding over 30 yrs
- 0.0%
- Est. flood insurance / yr
- $473 – $860
Fire risk 5/10 · Moderate
- Est. fire insurance / yr
- $1,154 – $2,142
Heat risk 5/10 · Moderate
- Hot days now (above 109°F)
- 7 days/yr
- Hot days in 30 yrs
- 19 days/yr
Wind risk 2/10 · Minimal
- Chance of severe wind over 30 yrs
- 2.0%
Air-quality risk 2/10 · Minimal
- Unhealthy air days now
- 2 days/yr
- Unhealthy air days in 30 yrs
- 2 days/yr
Risk factors via First Street. Map © Google.
Why this score? — see what drove the B+ grade
The composite is a weighted blend of 9 inputs, each scored 0–100. Each bar is that input's sub-score; the figure is the points it added to the 100-point composite (weight × sub-score).
- Cash flow +30.0/30.0
- ARV discount +15.0/15.0
- 1% rule +10.0/10.0
- DSCR +10.0/10.0
- Livability +3.2/5.0
- Schools +2.8/10.0
- Rent growth +2.5/5.0
- Condition / age +2.5/5.0
- Appreciation +0.0/10.0
$67,000
🖨 Deal sheet (PDF) 📄 Offer letter ✓ Due diligence
Key facts
- 0.25 acre lot
- 2 garage spots
- Listed 109 days
Property features AI
Finance
- Other: Directions: From downtown Independence (Hwy 160), go east to South 2nd, go south to Poplar, go east to 717 E Poplar.
- HOA & community: No association fees
Exterior
- Parking: Attached garage with garage door opener (garage faces front); 2 garage spaces
- Utilities: Public water; Public sewer
- Home design: Single-family residence; Attached property; 1,776 above-grade living area (assessor)
- Construction: Brick construction; Composition roof; 76–100 years old
- Exterior features: Lot approximately 10,741 square feet; Not in a flood plain
Interior
- Bedrooms: 3 bedrooms
- Bathrooms: 1 full bathroom
- Heating & cooling: Natural gas heating; Electric cooling
- Interior features: Bungalow floor plan; Basement bedroom and crawl space; Fireplace (1)
Neighborhood map
What this means for you Summary
Snapshot
- This is a 3-bed/1.0-bath single-family listed at $67k.
Deal economics
- At list price, monthly cash flow is $385 ($5k/yr) — positive.
- The deal already cash-flows at list — no discount required.
- Meets the 1% rule at list price ($1k rent vs $67k).
- Recommended offer: $61k (9.0% below list) — sets the bar for market timing.
- Cap rate 13.2% vs local median 4.0% in Independence — top-decile yield for the area; either an underpriced asset or a hidden risk that comps aren't pricing in. Stress-test before assuming the spread holds.
Location & tenants
- Location reads 65/100 on livability (#285 in KS) — a middle-class / working-renter tenant base. Strengths: cost of living A+, housing A+, health & safety A-; Watch: schools D+, crime F, amenities F.
- Independence (town): math 31% / reading 36% proficiency, ranked #76 of 169 in KS (top 45%) — families likely to look elsewhere, expect single-tenant / working-renter base with shorter leases.
- Market conditions: 69 active listings in the ZIP; 10 units permitted in Montgomery County in 2024 (0 in 5+ unit buildings).
Forward outlook
- Local home prices are declining (-3.0%/yr); year-one equity from $463 of loan paydown is wiped out by about $2k of value loss. Plan a longer hold.
- Montgomery County population projected at -28% by 2050 — secular population decline; favor cash flow + early exit over multi-decade hold.
- At projected returns (-3.0% appreciation + 3.0% rent growth), your $19k cash investment doubles in ~5 years — after that, you're playing with house money.
Negotiation context
- It's been on market 109 days — a 9% lower offer ($61k) is reasonable based on typical stale-listing flexibility.
Risks & watch-outs
- Watch-outs: built in 1927 — expect roof / HVAC / electrical / plumbing capex.
- Climate carrying-cost: moderate wildfire risk; extreme-heat days projected 7→19/yr by 2055 (HVAC capex compounding) — expect insurance premiums to compound above CPI over the hold.
Questions for the listing agent
- It's been on market 109 days. Have you received any prior offers? Is the seller open to a 9% concession, seller financing, or rate buy-down credit?
- Built in 1927 — when were the roof, HVAC, electrical panel, plumbing, and water heater last replaced?
- Why hasn't it sold? Are there any deal-killer items the seller is aware of (foundation, flood, title, zoning, code violations)?
- Is there a deadline driving the sale (1031 exchange, divorce, estate, relocation)? That informs how much negotiation room exists.
- Schools are D-rated, which usually means shorter tenancies and higher turnover. Who's the typical renter profile here, and what's been the actual vacancy rate?
- Crime grade is F in this area — have there been break-ins, vandalism, or insurance claims at this property in the last 3 years? What carrier currently insures it and at what premium?
- What's the average days-on-market for RENTAL listings here right now (not sales)? A rising rental-DOM trend means longer vacancies and softer asking-rent achievability than the comps imply.
- What's the recent tenant-quality profile in this submarket — average credit score on applications, eviction rate, late-payment / NSF rate, and stable-employment percentage? A property-management company in the area should have these aggregated.
- How much new for-sale + rental construction is in the pipeline within 1–3 miles? Heavy new supply typically softens prices + rents 12–24 months out; constrained supply supports both.
Investment metrics
- 1% rule
- 1.68% ✓
- Cap rate
- 13.20%
- Cash-on-cash
- 24.65%
- DSCR
- 2.10
- GRM
- 5.0
CMA / ARV
- ARV (on-the-fly)
- $104,784
- Comps found
- 9
Show comp detail 9 sales within ~0.75 mi
| Address | Dist | Beds/Ba | Sqft | Sold | Price | $/sf | Match |
|---|---|---|---|---|---|---|---|
| 524 E Main N/A | 0.36mi | 4/1.0 (+1) | 1,694 (-5%) | 15mo | $16,500 | $10 | 58 |
| 501 S Park Blvd | 0.21mi | 4/1.5 (+1) | 1,637 (-8%) | 14mo | $155,000 | $95 | 58 |
| 410 N 4th St | 0.64mi | 3/1.0 | 1,796 (+1%) | 21mo | $39,900 | $22 | 51 |
| 315 N 1st St | 0.52mi | 3/2.0 | 1,574 (-11%) | 6mo | $149,900 | $95 | 48 |
| 608 E Main St | 0.35mi | 4/1.5 (+1) | 1,998 (+12%) | 11mo | $21,500 | $11 | 47 |
| 413 N 2nd St | 0.61mi | 2/2.0 (-1) | 1,660 (-6%) | 9mo | $97,000 | $58 | 44 |
| 318 S 9th St | 0.64mi | 3/1.5 | 1,955 (+10%) | 10mo | $144,900 | $74 | 42 |
| 401 N 1st St | 0.60mi | 3/2.0 | 1,596 (-10%) | 12mo | $196,000 | $123 | 41 |
| 917 E Myrtle St | 0.41mi | 3/2.0 | 1,568 (-12%) | 20mo | $92,500 | $59 | 41 |
Match score weights: distance 35% · size 25% · config 20% · recency 20%. Top-matched comps best support the ARV.
Projected returns pro-forma
-3.0% appreciation · 3.0% rent growth · sell at horizon
- IRR
- 18.1%
- Equity multiple
- 1.73×
- Total profit
- $13,733
- Equity at exit
- $9,990
- IRR
- 26.5%
- Equity multiple
- 3.33×
- Total profit
- $43,736
- Equity at exit
- $5,793
Cash invested: $18,760 (down + closing). Projections, not guarantees.
Landlord ↔ Tenant lean methodology
- Overall (STATE)
- 83 Strongly Landlord-Friendly
- State Kansas
- 83 Strongly Landlord-Friendly · R+10
- County
- — inherits STATE
- City
- — inherits STATE
ZIP-level market 67301
- Active inventory
- 69
- Price-to-rent
- 5.0×
Monthly cashflow live
- Estimated rent
- $1,124 medium interval (Pro) →
- Mortgage (P&I)
- −$351
- Tax from tax record
- −$123 /mo · $1,480/yr
- Insurance
- −$28
- HOA
- −$0
- Vacancy / Maint / Mgmt
- −$236
- Net cashflow
- $385
Break-even live
Sensitivity live
| Price | -10% $423 | -5% $404 | +0% $385 | +5% $366 | +10% $348 |
|---|---|---|---|---|---|
| Rent | -10% $297 | -5% $341 | +0% $385 | +5% $430 | +10% $474 |
| Rate | -1.0pp $419 | -0.5pp $402 | base $385 | +0.5pp $368 | +1.0pp $350 |
UW: 25.0% down · 7.5% · 30yr · 1.5% tax · 5.0% vac · 8.0% maint · 8.0% mgmt
Financing live
Cash to close
- Down payment
- $16,750
- Closing costs
- $2,010
- Reserves months
- —
- Total cash needed
- —
Loan-product check · same deal, 3 products live
Conventional
25% down · 7.5% · 30yr
- Down + closing
- —
- Monthly P&I
- —
- Monthly cashflow
- —
- DSCR
- —
- Eligible?
- —
Personal DTI + credit; lowest rate.
DSCR
20% down · 8.5% · 30yr
- Down + closing
- —
- Monthly P&I
- —
- Monthly cashflow
- —
- DSCR
- —
- Eligible?
- —
No personal income docs; deal must DSCR.
Hard money
10% down · 12.0% · 12mo
- Down + closing
- —
- Monthly P&I
- —
- Monthly cashflow
- —
- DSCR
- —
- Eligible?
- —
Short-term bridge; refi at stabilization.
Listing history 18 events
-
2026-06-21days on market $67,000 Active 109 DOM
-
2026-06-18days on market $67,000 Active 107 DOM
-
2026-06-17days on market $67,000 Active 106 DOM
-
2026-06-16days on market $67,000 Active 105 DOM
-
2026-06-15pricedays on market $67,000 Active 104 DOM
-
2026-06-13days on market $72,000 Active 102 DOM
-
2026-06-12days on market $72,000 Active 101 DOM
-
2026-06-09days on market $72,000 Active 98 DOM
-
2026-06-08days on market $72,000 Active 97 DOM
-
2026-06-07days on market $72,000 Active 96 DOM
-
2026-06-05days on market $72,000 Active 94 DOM
-
2026-06-04days on market $72,000 Active 92 DOM
-
2026-06-02days on market $72,000 Active 91 DOM
-
2026-06-01days on market $72,000 Active 90 DOM
-
2026-05-31days on market $72,000 Active 89 DOM
-
2026-05-31days on market $72,000 Active 88 DOM
-
2026-04-08price $72,000
-
2026-03-03$79,900 Active
ⓘ Source: listings_history table (triggers on properties + properties_extension) + one-shot
backfill from property_details.listing_events for pre-trigger history.
Tax reassessment forecast KS · Resets to sale price
- Current annual tax
- $1,480 · $123/mo
- Projected year-2 tax
- $1,480 · $123/mo
- Expected delta
- $0/yr ($0/mo · 0.0%)
ⓘ Screening estimate from a state-policy table — verify with the county assessor before closing.
Climate risk First Street
- Flood 1/10 Low FEMA zone X (unshaded) · 0% chance over 30 yrs
- Wildfire 5/10 Major
- Heat 5/10 Major 7 d/yr ≥109°F today · 19 d/yr by 30 yrs out
- Wind 2/10 Low 2% chance of damaging wind over 30 yrs
- Air quality 2/10 Low 2 unhealthy d/yr today · 2 by 30 yrs out
Nearby sold comps map
Loading sold comps map…
Walkable amenities ~0.75 mi
Loading nearby amenities…
Taxation est. · year 1
- Rental income
- $13,489
- − Mortgage interest
- −$3,753
- − Property taxes
- −$1,480
- − Insurance
- −$335
- − Repairs & maintenance
- −$1,079
- − Management
- −$1,079
- − Depreciation
- −$1,949
- Taxable income
- $3,814
- Est. tax owed @ 24.0%
- −$915
- After-tax cash flow
- $3,710/yr
For passive investors: Depreciation is non-cash, so a rental often shows a tax loss while cash-flowing — sheltering income. Rental losses are passive: they offset passive income freely, and up to $25,000/yr can offset ordinary (W-2) income if you actively participate and your MAGI is under $100k (phasing out to $0 by $150k); unused losses carry forward. On sale, claimed depreciation is recaptured at up to 25%, and gains may owe capital-gains tax (a 1031 exchange can defer both). Figures are a year-1 estimate at your 24.0% rate — not tax advice; consult a CPA.
Schools (NCES district)
- District
- Independence
- NCES district ID
- 2007650
- Math proficiency
- 31% ▼ -4.00%
- Reading proficiency
- 36% ▲ 1.00%
- Median HH income
- $43,327
- Composite
- 28.45/100
- National rank
- #6750
- State rank
- #76 of 169 in KS
Livability — Independence
- Score
- 65/100
- State rank
- #285
- US rank
- #12779
Category grades
Schools grade is shown separately in the Schools card above.
Census & demographics
- Census place
- Independence, KS
- Population (ZIP)
- 12,996
Population outlook (Montgomery County) Hauer SSP2
- Today (2025)
- 29,729 people
- By 2030
- 27,786 · -6.5%
- By 2040
- 24,201 · -18.6%
- By 2050
- 21,280 · -28.4%
- By 2075
- 16,754 · -43.6%
- By 2100
- 14,088 · -52.6%
Race, ethnicity, and origin ACS 2023
- Neighborhood character
- Predominantly White (81%)
- Race & ethnicity
- White 81% Two or more races 10% Hispanic / Latino 6% Black 2% Native American 2%
- Hispanic origin (detail)
- Mexican 5%
- Common ancestry
- Lithuanian 2% Slovak 2% Italian 2%
- Foreign-born
- 2% · Canada
- Languages at home
- 96% English-only · Spanish 3% German/W. Germanic 1%
Political lean MEDSL · Montgomery
- 2024 margin
- Solid R (+51.1) · D 23.6% · R 74.7% · Other 1.8%
- 2008→2024 swing
- -15.3pp toward R · 2008: -35.8pp · 2024: -51.1pp
- All cycles
- 2024: R+51.1 2020: R+50.2 2016: R+50.8 2012: R+41.4 2008: R+35.8
Not yet ingested
- Civics
- —
Market trends
- HPI YoY
- ▼ -77.85%
- Current HPI
- 126.8212
- Rent YoY
- —
- Metro
- —
- State GDP YoY
- —
- F500 in state
- 0
Price history
-9.9% since first listed2 events — show timeline
- 2026-04-08 Price Changed $72,000 Heartland MLS as Distributed by MLS Grid
- 2026-03-03 Listed $79,900 Heartland MLS as Distributed by MLS Grid
Property tax history
+1.4%/yrLatest (2025): $1,480 · +4.6% YoY. Source: county tax records.
Cash-flow waterfall
monthlySold comps — $/sqft
last 12 mo · ≤1 miLoading sold comps…