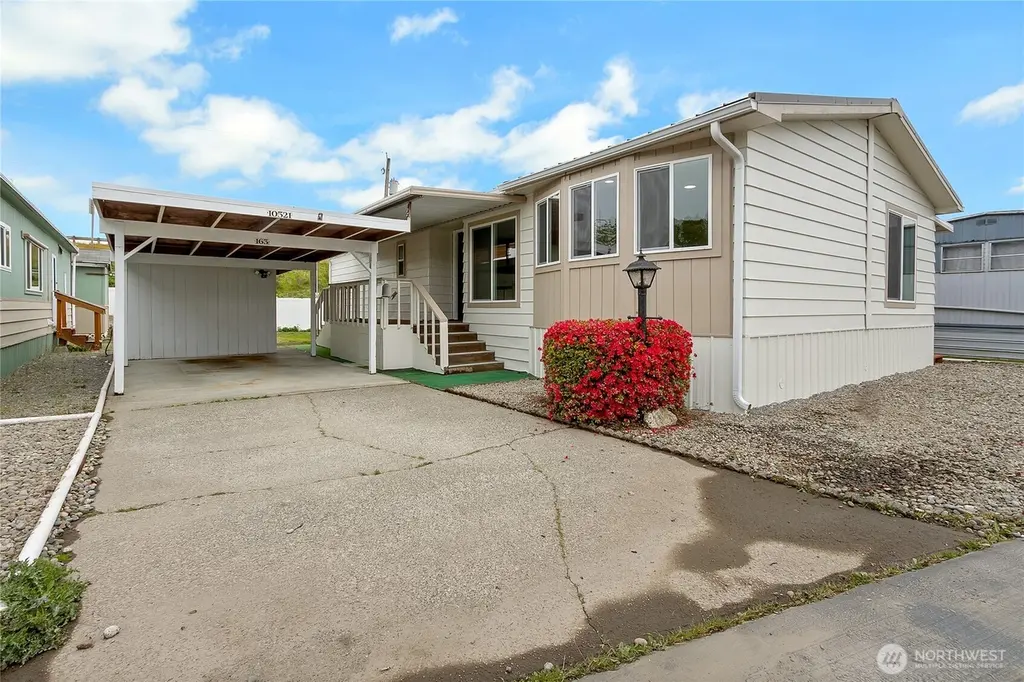
10521 60TH Street Ct E #163 · North Puyallup, WA
Flood risk 9/10 · Severe
- FEMA flood zone
- X (unshaded)
- Chance of flooding over 30 yrs
- 0.99%
- Est. flood insurance / yr
- $507 – $1,088
Fire risk 1/10 · Minimal
- Est. fire insurance / yr
- $604 – $1,122
Heat risk 3/10 · Minor
- Hot days now (above 89°F)
- 7 days/yr
- Hot days in 30 yrs
- 16 days/yr
Wind risk 1/10 · Minimal
- Chance of severe wind over 30 yrs
- —
Air-quality risk 7/10 · Major
- Unhealthy air days now
- 11 days/yr
- Unhealthy air days in 30 yrs
- 12 days/yr
Risk factors via First Street. Map © Google.
Why this score? — see what drove the B- grade
The composite is a weighted blend of 9 inputs, each scored 0–100. Each bar is that input's sub-score; the figure is the points it added to the 100-point composite (weight × sub-score).
- Cash flow +30.0/30.0
- 1% rule +10.0/10.0
- DSCR +10.0/10.0
- Schools +5.4/10.0
- Livability +4.2/5.0
- Rent growth +3.6/5.0
- Condition / age +2.5/5.0
- ARV discount +0.0/15.0
- Appreciation +0.0/10.0
$100,000
🖨 Deal sheet 📄 Offer letter ✓ Due diligence
Listing remarks
Fully Renovated 2 Bed + utility/office space & 1.75 Bath in Desirable 55+ Community. Welcome home to this beautifully updated 1,150 sq ft manufactured home, where modern upgrades meet comfortable living. This residence has been refreshed from top to bottom-offering a truly turn-key opportunity. Step inside to find a bright and open layout featuring a spacious living room, dedicated dining area and wrap around kitchen with stainless steel appliances. The home showcases a clean, modern aesthetic with fresh interior and exterior paint, crisp white trim package and new lighting throughout. The kitchen has been fully upgraded. Both bathrooms have been refreshed with new vanities and mirror
Key facts
- Fully renovated
- Leveled foundation
- Updated kitchen
Tags
Neighborhood map
What this means for you Summary
Snapshot
- This is a 2-bed/2.0-bath manufactured listed at $100k.
Deal economics
- At list price, monthly cash flow is $833 ($10k/yr) — positive.
- The deal already cash-flows at list — no discount required.
- Meets the 1% rule at list price ($2k rent vs $100k).
- Recommended offer: $97k (3.0% below list) — sets the bar for market timing.
Location & tenants
- Location reads 85/100 on livability (#25 in WA, #468 nationally) — a professional / high-income tenant draw. Strengths: crime A+, amenities A+, housing A+; Watch: employment C-.
- Puyallup School District (suburban): math 53% / reading 66% proficiency, ranked #52 of 291 in WA (top 18%) — acceptable for families but not a draw, mixed tenant base, ~2y average lease.
- Market conditions: Rents rising fast (+4.5%/yr); 167 active listings in the ZIP; 40 comparable units currently listed for rent nearby; rentals at typical pace (median 25d on market — plan ~3-4 weeks tenant-placement turnaround); solid renter incomes; 3,209 units permitted in Pierce County in 2024 (1,269 in 5+ unit buildings).
Forward outlook
- Local home prices are declining (-3.0%/yr); year-one equity from $691 of loan paydown is wiped out by about $3k of value loss. Plan a longer hold.
- Pierce County population projected at +26% by 2050 — long-run rental-demand tailwind backs the buy-and-hold thesis.
- At projected returns (-3.0% appreciation + 4.5% rent growth), your $28k cash investment doubles in ~4 years — after that, you're playing with house money.
Negotiation context
- It's been on market 58 days — a 3% lower offer ($97k) is reasonable based on typical stale-listing flexibility.
- 2 sale attempts; this cycle's ask has dropped $20k (17%) from the opening price — seller is motivated, your offer sets the floor, not the list.
- Current owner paid $20k; list at $100k implies a 400% gain — meaningful room to come down on a strong offer.
Risks & watch-outs
- Watch-outs: flood insurance adds $66/mo.
- Climate carrying-cost: severe flood risk — expect insurance premiums to compound above CPI over the hold.
Questions for the listing agent
- It's been on market 58 days. Have you received any prior offers? Is the seller open to a 3% concession, seller financing, or rate buy-down credit?
- What's the actual annual flood-insurance premium (NFIP or private), and is the property in a SFHA with mandatory coverage?
- Is there a deadline driving the sale (1031 exchange, divorce, estate, relocation)? That informs how much negotiation room exists.
- What's the average days-on-market for RENTAL listings here right now (not sales)? A rising rental-DOM trend means longer vacancies and softer asking-rent achievability than the comps imply.
- What's the recent tenant-quality profile in this submarket — average credit score on applications, eviction rate, late-payment / NSF rate, and stable-employment percentage? A property-management company in the area should have these aggregated.
- How much new for-sale + rental construction is in the pipeline within 1–3 miles? Heavy new supply typically softens prices + rents 12–24 months out; constrained supply supports both.
Investment metrics
- 1% rule
- 1.97% ✓
- Cap rate
- 17.09%
- Cash-on-cash
- 38.57%
- DSCR
- 2.72
- GRM
- 4.2
CMA / ARV
- ARV (median comp)
- $85,148
- List price
- $100,000
- Delta
- 17.44%
- Verdict
- OVERPRICED
- Comps
- 16 within 1.0 mi
Show comp detail 12 sales within ~0.75 mi
| Address | Dist | Beds/Ba | Sqft | Sold | Price | $/sf | Match |
|---|---|---|---|---|---|---|---|
| 10524 63rd Street Ct E #51 | 0.13mi | 2/2.0 | 1,147 (-0%) | 4mo | $122,000 | $106 | 90 |
| 6312 107th Ave E #56 | 0.15mi | 2/2.0 | 1,152 (+0%) | 10mo | $72,500 | $63 | 84 |
| 10517 60th Street Ct E #164 | 0.02mi | 2/2.0 | 1,119 (-3%) | 13mo | $59,000 | $53 | 84 |
| 10522 60th Street Ct E | 0.02mi | 2/2.0 | 1,056 (-8%) | 3mo | $84,950 | $80 | 83 |
| 10701 63rd St E | 0.14mi | 2/2.0 | 1,140 (-1%) | 12mo | $60,000 | $53 | 82 |
| 10518 60th Street Ct E | 0.02mi | 2/2.0 | 1,248 (+8%) | 10mo | $45,000 | $36 | 76 |
| 10516 63rd Street Ct E #53 | 0.12mi | 2/2.0 | 1,109 (-4%) | 15mo | $80,000 | $72 | 76 |
| 10515 60th Street Ct E #165 | 0.02mi | 2/2.0 | 1,052 (-8%) | 11mo | $30,000 | $29 | 76 |
| 10805 62nd Street Ct E #3 | 0.17mi | 2/2.0 | 1,060 (-8%) | 8mo | $94,000 | $89 | 72 |
| 10703 62nd St E #82 | 0.12mi | 3/2.0 (+1) | 1,296 (+13%) | 6mo | $120,000 | $93 | 63 |
| 10715 63rd Street Ct E #38 | 0.19mi | 3/2.0 (+1) | 1,252 (+9%) | 10mo | $118,000 | $94 | 63 |
| 5705 113th Ave E #68 | 0.49mi | 3/2.0 (+1) | 1,008 (-12%) | 10mo | $62,000 | $62 | 43 |
Match score weights: distance 35% · size 25% · config 20% · recency 20%. Top-matched comps best support the ARV.
Projected returns pro-forma
-3.0% appreciation · 4.46% rent growth · sell at horizon
- IRR
- 33.1%
- Equity multiple
- 2.42×
- Total profit
- $39,865
- Equity at exit
- $14,910
- IRR
- 40.9%
- Equity multiple
- 5.13×
- Total profit
- $115,680
- Equity at exit
- $8,646
Cash invested: $28,000 (down + closing). Projections, not guarantees.
Landlord ↔ Tenant lean methodology
- Overall (STATE)
- 28 Tenant-Leaning
- State Washington
- 28 Tenant-Leaning · D+8
- County
- — inherits STATE
- City
- — inherits STATE
ZIP-level market 98372
- Rents YoY
- 4.5%
- Active inventory
- 167
- Price-to-rent
- 4.2×
Monthly cashflow live
- Estimated rent
- $1,970 high interval (Pro) →
- Mortgage (P&I)
- −$524
- Tax from tax record
- −$90 /mo · $1,083/yr
- Insurance
- −$42
- Flood insurance flood zone
- −$66 /mo · $798/yr
- HOA
- −$0
- Vacancy / Maint / Mgmt
- −$414
- Net cashflow
- $833
Break-even live
UW: 25.0% down · 7.5% · 30yr · 1.5% tax · 5.0% vac · 8.0% maint · 8.0% mgmt
Financing live
Cash to close
- Down payment
- $25,000
- Closing costs
- $3,000
- Reserves months
- —
- Total cash needed
- —
Loan-product check · same deal, 3 products live
Conventional
25% down · 7.5% · 30yr
- Down + closing
- —
- Monthly P&I
- —
- Monthly cashflow
- —
- DSCR
- —
- Eligible?
- —
Personal DTI + credit; lowest rate.
DSCR
20% down · 8.5% · 30yr
- Down + closing
- —
- Monthly P&I
- —
- Monthly cashflow
- —
- DSCR
- —
- Eligible?
- —
No personal income docs; deal must DSCR.
Hard money
10% down · 12.0% · 12mo
- Down + closing
- —
- Monthly P&I
- —
- Monthly cashflow
- —
- DSCR
- —
- Eligible?
- —
Short-term bridge; refi at stabilization.
Rent comps 40 comps
| Address | Beds | Baths | Sqft | Rent | $/sqft | DOM | Units | Dist |
|---|---|---|---|---|---|---|---|---|
| 1027 N Meridian Puyallup, WA | 1.0–2.0 | 1.0 | 782 | $1,795 | $2.29 | 5d | 6 | 0.23mi |
| 5517 108th Avenue Ct E Unit 5517 Puyallup, WA | 2.0 | 1.0 | 864 | $1,725 | $2.00 | 43d | 1 | 0.30mi |
| 407 Valley Ave NE Puyallup, WA | 1.0–3.0 | 1.0–2.0 | 923 | $2,062 | $2.23 | 43d | 1 | 0.40mi |
| 735 2nd St NW Unit 1 Puyallup, WA | 2.0 | 1.0 | 837 | $1,695 | $2.03 | 22d | 1 | 0.47mi |
| 513 5th St NE Puyallup, WA | 3.0 | 1.0 | 1140 | $2,575 | $2.26 | 43d | 1 | 0.47mi |
| 501 2nd St NE Puyallup, WA | 1.0–2.0 | 1.0–2.0 | 850 | $2,299 | $2.70 | 5d | 11 | 0.53mi |
| 501 2nd Ave NE Puyallup, WA | 1.0–2.0 | 1.0–2.0 | 1506 | $2,299 | $1.53 | 43d | 17 | 0.53mi |
| 6808 112th Ave E Unit B Puyallup, WA | 3.0 | 1.5 | 1400 | $2,300 | $1.64 | 43d | 1 | 0.67mi |
| 721 2nd Ave NE Puyallup, WA | 2.0 | 1.5 | 1000 | $1,895 | $1.90 | 24d | 1 | 0.69mi |
| 719 2nd Ave NE Apt 2 Puyallup, WA | 2.0 | 1.5 | 1000 | $1,895 | $1.90 | 5d | 1 | 0.70mi |
| 4908 110th Avenue Ct E #3 Edgewood, WA | 3.0 | 2.0 | 1058 | $2,395 | $2.26 | 12d | 1 | 0.70mi |
| 4908 110th Ave Ct E Edgewood, WA | 3.0 | 2.0 | 1100 | $2,395 | $2.18 | 18d | 1 | 0.70mi |
| 120 5th St NE Unit 1 Puyallup, WA | 1.0 | 1.0 | 726 | $1,595 | $2.20 | 43d | 1 | 0.73mi |
| 10710 48th St E Unit A Edgewood, WA | 2.0 | 1.0 | 898 | $2,295 | $2.56 | 43d | 1 | 0.77mi |
| 4824 110th Avenue Ct E Edgewood, WA | 1.0–2.0 | 1.0 | 775 | $2,050 | $2.65 | 5d | 3 | 0.78mi |
| 4729 114th Ave E Edgewood, WA | 2.0 | 1.0 | 800 | $1,995 | $2.49 | 20d | 1 | 0.86mi |
| 4727 114th Ave E Edgewood, WA | 2.0 | 1.0 | 800 | $1,995 | $2.49 | 20d | 1 | 0.87mi |
| 803 9th St NW Unit 803 Puyallup, WA | 2.0 | 1.0 | 800 | $1,775 | $2.22 | 20d | 1 | 0.88mi |
| 344 7th St SE Unit 20 Puyallup, WA | 2.0 | 1.0 | 800 | $1,650 | $2.06 | 24d | 1 | 0.97mi |
| 344 7th St SE Puyallup, WA | 2.0 | 1.0 | 800 | $1,622 | $2.03 | 3d | 2 | 0.97mi |
| 344 7th St SE Puyallup, WA | 2.0 | 1.0 | 800 | $1,650 | $2.06 | 43d | 2 | 0.97mi |
| 344 7th St SE Unit 8 Puyallup, WA | 2.0 | 1.0 | 800 | $1,595 | $1.99 | 24d | 1 | 0.97mi |
| 1617 E Main Puyallup, WA | 1.0–2.0 | 1.0–2.0 | 930 | $2,151 | $2.31 | 2d | 30 | 1.01mi |
| 5406 122nd Ave E Unit B Edgewood, WA | 2.0 | 1.0 | 1400 | $2,425 | $1.73 | 5d | 1 | 1.04mi |
| 1017 13th Street Ct NW Puyallup, WA | 3.0 | 2.0 | 1250 | $2,200 | $1.76 | 43d | 1 | 1.06mi |
| 813 W Main Puyallup, WA | 1.0 | 1.0 | 700 | $1,600 | $2.29 | 43d | 1 | 1.09mi |
| 508 11th St NW Unit H Puyallup, WA | 2.0 | 1.0 | 1037 | $1,800 | $1.74 | 16d | 1 | 1.10mi |
| 508 11th St NW Puyallup, WA | 2.0 | 1.0 | 1037 | $2,000 | $1.93 | 43d | 1 | 1.10mi |
| 601 5th St SW Unit C Puyallup, WA | 2.0 | 2.5 | 1450 | $2,450 | $1.69 | 5d | 1 | 1.21mi |
| 516 16th St SE Puyallup, WA | 2.0 | 1.0 | 950 | $1,895 | $1.99 | 24d | 1 | 1.27mi |
| 805 3rd St SW Puyallup, WA | 2.0 | 1.0 | 957 | $1,850 | $1.93 | 43d | 1 | 1.29mi |
| 1218 7th Ave SE Unit 1208 Puyallup, WA | 2.0 | 1.0 | 885 | $2,145 | $2.42 | 24d | 1 | 1.29mi |
| 1402 7th Ave SE Unit B Puyallup, WA | 3.0 | 2.5 | 1351 | $2,300 | $1.70 | 43d | 1 | 1.31mi |
| 322 9th Ave SE Puyallup, WA | 2.0 | 1.0 | 975 | $1,610 | $1.65 | 12d | 3 | 1.34mi |
| 322 9th Ave SE Unit 08 Puyallup, WA | 2.0 | 1.0 | 975 | $1,595 | $1.64 | 5d | 1 | 1.34mi |
| 322 9th Ave SE Apt 9 Puyallup, WA | 2.0 | 1.0 | 975 | $1,550 | $1.59 | 5d | 1 | 1.35mi |
| 931 9th St SE Puyallup, WA | 1.0–2.0 | 1.0 | 784 | $1,845 | $2.35 | 2d | 7 | 1.39mi |
| 1503 18th St NW Puyallup, WA | 1.0–2.0 | 1.0 | 840 | $1,730 | $2.06 | 10d | 4 | 1.41mi |
| 305 13th St SW Unit D Puyallup, WA | 2.0 | 1.5 | 880 | $1,820 | $2.07 | 43d | 1 | 1.41mi |
| 1503 18th St NW Unit C301 Puyallup, WA | 1.0 | 1.0 | 740 | $1,630 | $2.20 | 43d | 1 | 1.42mi |
Listing history 21 events
-
2026-06-18days on market $100,000 Active 58 DOM
-
2026-06-17days on market $100,000 Active 57 DOM
-
2026-06-16days on market $100,000 Active 56 DOM
-
2026-06-15days on market $100,000 Active 55 DOM
-
2026-06-13days on market $100,000 Active 53 DOM
-
2026-06-13days on market $100,000 Active 52 DOM
-
2026-06-09days on market $100,000 Active 49 DOM
-
2026-06-08days on market $100,000 Active 48 DOM
-
2026-06-07days on market $100,000 Active 47 DOM
-
2026-06-04pricedays on market $100,000 Active 44 DOM
-
2026-06-03days on market $112,000 Active 43 DOM
-
2026-06-02days on market $112,000 Active 42 DOM
-
2026-06-01days on market $112,000 Active 41 DOM
-
2026-05-31days on market $112,000 Active 40 DOM
-
2026-05-17price $112,000
-
2026-04-21$120,000 Active
-
2025-08-22soldstatus $20,000 Closed
-
2025-08-02status Pending
-
2025-07-01price $25,000
-
2025-06-03price $35,000
-
2025-04-09$40,000 Active
ⓘ Source: listings_history table (triggers on properties + properties_extension) + one-shot
backfill from property_details.listing_events for pre-trigger history.
Tax reassessment forecast WA · Resets to sale price
- Current annual tax
- $1,083 · $90/mo
- Projected year-2 tax
- $1,083 · $90/mo
- Expected delta
- $0/yr ($0/mo · 0.0%)
ⓘ Screening estimate from a state-policy table — verify with the county assessor before closing.
Climate risk First Street
- Flood 9/10 Extreme FEMA zone X (unshaded) · 99% chance over 30 yrs
- Wildfire 1/10 Low
- Heat 3/10 Moderate 7 d/yr ≥89°F today · 16 d/yr by 30 yrs out
- Wind 1/10 Low
- Air quality 7/10 Severe 11 unhealthy d/yr today · 12 by 30 yrs out
Nearby sold comps map
Loading sold comps map…
Walkable amenities ~0.75 mi
Loading nearby amenities…
Taxation est. · year 1
- Rental income
- $23,640
- − Mortgage interest
- −$5,602
- − Property taxes
- −$1,083
- − Insurance
- −$1,298
- − Repairs & maintenance
- −$1,891
- − Management
- −$1,891
- − Depreciation
- −$2,909
- Taxable income
- $8,966
- Est. tax owed @ 24.0%
- −$2,152
- After-tax cash flow
- $7,850/yr
For passive investors: Depreciation is non-cash, so a rental often shows a tax loss while cash-flowing — sheltering income. Rental losses are passive: they offset passive income freely, and up to $25,000/yr can offset ordinary (W-2) income if you actively participate and your MAGI is under $100k (phasing out to $0 by $150k); unused losses carry forward. On sale, claimed depreciation is recaptured at up to 25%, and gains may owe capital-gains tax (a 1031 exchange can defer both). Figures are a year-1 estimate at your 24.0% rate — not tax advice; consult a CPA.
Schools (NCES district)
- District
- Puyallup School District
- NCES district ID
- 5306960
- Math proficiency
- 53% ▬ 0.00%
- Reading proficiency
- 66% ▬ 0.00%
- Median HH income
- $68,291
- Composite
- 54.01/100
- National rank
- #3006
- State rank
- #52 of 291 in WA
Livability — North Puyallup
- Score
- 85/100
- State rank
- #25
- US rank
- #468
Category grades
Schools grade is shown separately in the Schools card above.
Census & demographics
- Census place
- North Puyallup, WA
- County
- Pierce County · 788,257 people
- Metro
- Seattle-Tacoma-Bellevue, WA
- Population (ZIP)
- 26,012
- Household income
- $98,152
- Rent vs Own
- Severe rent burden
- 871.0
Population outlook (Pierce County) Hauer SSP2
- Today (2025)
- 956,648 people
- By 2030
- 1,010,862 · +5.7%
- By 2040
- 1,113,170 · +16.4%
- By 2050
- 1,206,524 · +26.1%
- By 2075
- 1,436,425 · +50.2%
- By 2100
- 1,563,654 · +63.5%
Race, ethnicity, and origin ACS 2023
- Neighborhood character
- Predominantly White (73%)
- Race & ethnicity
- White 73% Two or more races 10% Hispanic / Latino 8% Asian 6% Black 3% Pacific Islander 1%
- Hispanic origin (detail)
- Mexican 5% Puerto Rican 1%
- Common ancestry
- Lithuanian 4% Romanian 4% Subsaharan African 3%
- Foreign-born
- 13% · Canada, South Korea, China
- Languages at home
- 81% English-only · Russian/Polish/Slavic 5% Spanish 4% Other Asian/Pacific 3%
Political lean MEDSL · Pierce
- 2024 margin
- D (+10.8) · D 53.9% · R 43.1% · Other 3.0%
- 2008→2024 swing
- -1.4pp toward R · 2008: 12.2pp · 2024: 10.8pp
- All cycles
- 2024: D+10.8 2020: D+11.2 2016: D+7.5 2012: D+11.0 2008: D+12.2
Not yet ingested
- Civics
- —
Market trends
- HPI YoY
- ▼ -283.81%
- Current HPI
- 309.7871
- Rent YoY
- ▲ 4.46%
- Metro
- Seattle-Tacoma-Bellevue, WA
- State GDP YoY
- ▲ 4.65%
- F500 in state
- 22
Industry mix (Fortune 500 HQ in WA)
| Industry | F500 HQs | Revenue |
|---|---|---|
| Retail | 2 | $269B |
|
||
| Technology / Retail | 1 | $638B |
|
||
| Technology | 1 | $245B |
|
||
| Telecommunications | 1 | $38B |
|
||
| Food / Beverage | 1 | $36B |
|
||
| Automotive / Trucks | 1 | $34B |
|
||
Price history
+180.0% since first listed7 events — show timeline
- 2026-05-17 Price Changed $112,000 NWMLS as Distributed by MLS Grid
- 2026-04-21 Listed $120,000 NWMLS as Distributed by MLS Grid
- 2025-08-22 Sold (MLS) $20,000 NWMLS as Distributed by MLS Grid
- 2025-08-02 Pending — NWMLS as Distributed by MLS Grid
- 2025-07-01 Price Changed $25,000 NWMLS as Distributed by MLS Grid
- 2025-06-03 Price Changed $35,000 NWMLS as Distributed by MLS Grid
- 2025-04-09 Listed $40,000 NWMLS as Distributed by MLS Grid
Property tax history
+8.7%/yrLatest (2026): $1,083 · -3.7% YoY. Source: county tax records.
Cash-flow waterfall
monthlySold comps — $/sqft
last 12 mo · ≤1 miLoading sold comps…