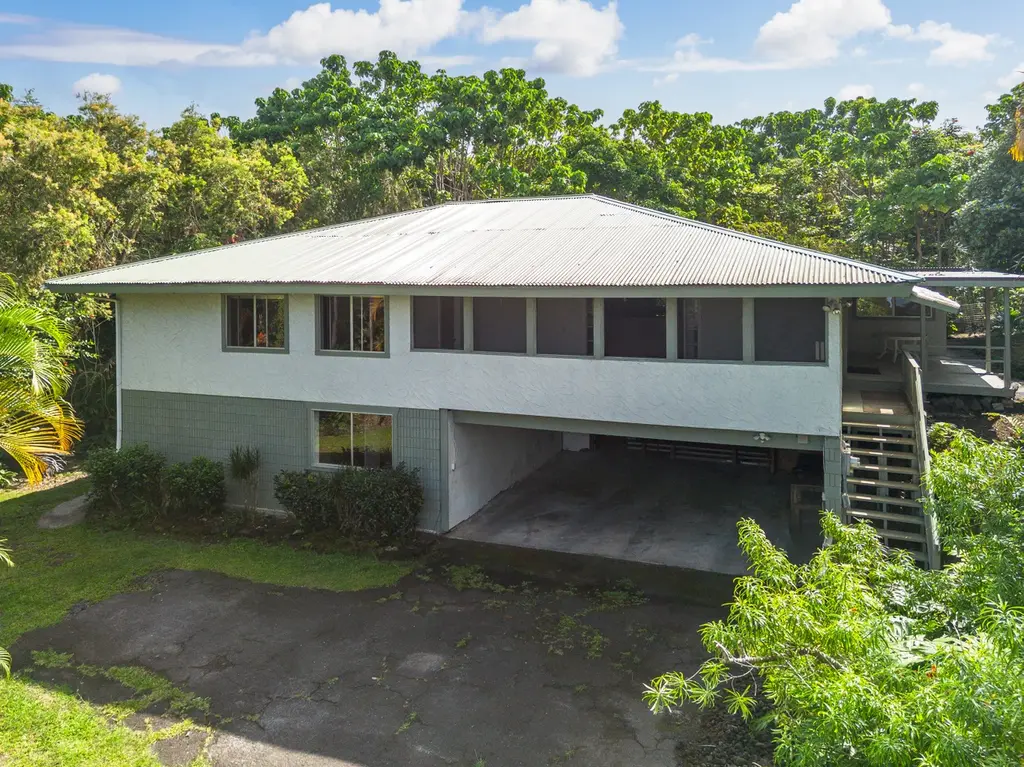
78-6929 Mamalahoa Hwy · Honalo, HI
Flood risk 1/10 · Minimal
- FEMA flood zone
- X (unshaded)
- Chance of flooding over 30 yrs
- 0.0%
- Est. flood insurance / yr
- $473 – $860
Fire risk No data
- Est. fire insurance / yr
- —
Heat risk No data
- Hot days now (above threshold)
- —
- Hot days in 30 yrs
- —
Wind risk No data
- Chance of severe wind over 30 yrs
- —
Air-quality risk 1/10 · Minimal
- Unhealthy air days now
- —
- Unhealthy air days in 30 yrs
- —
Risk factors via First Street. Map © Google.
Why this score? — see what drove the D grade
The composite is a weighted blend of 9 inputs, each scored 0–100. Each bar is that input's sub-score; the figure is the points it added to the 100-point composite (weight × sub-score).
- Cash flow +14.4/30.0
- ARV discount +7.5/15.0
- DSCR +4.4/10.0
- Appreciation +4.0/10.0
- Schools +3.7/10.0
- 1% rule +2.8/10.0
- Livability +2.7/5.0
- Rent growth +2.5/5.0
- Condition / age +2.5/5.0
$499,000
🖨 Deal sheet 📄 Offer letter ✓ Due diligence
Listing remarks MLS
Check this out, alot of house for the money! Spacious home with plenty of privacy. 3 bedroom 2 bath on the upper level with screened in lanai with some ocean views, extra room could be den or another bedroom with separate entrance. The lower level is a 2 bedroom 1 bath, and another area with lots of extra storage. Great elevation with cool breezes and great location for easy to drive to Keauhou or Kailua Kona.
Key facts
- Mature vegetation
- Flex rooms
- Granite countertops
Tags
Property features AI
Finance
- Financial info: Not in use as a short-term vacation rental
Exterior
- Parking: Covered parking; 2 carport spaces
- Utilities: Electricity available; Public water; Cesspool sewer; Solid waste disposal: other
- Construction: No unpermitted improvements reported
- Exterior features: Road/street frontage; Leasehold land tenure; Located in Lava Zone 4; Zoned RA-.5A; Ownership: full
Interior
- Flooring: Ceramic tile
- Bathrooms: 3 full bathrooms
- Interior features: Ceramic tile flooring
Neighborhood map
What this means for you Summary
Snapshot
- This is a 3-bed/2.0-bath single-family listed at $499k.
Deal economics
- At list price, monthly cash flow is $97 ($1k/yr) — positive.
- The deal already cash-flows at list — no discount required.
- To meet the 1% rule (rent ≥ 1% of price), the offer needs to be $390k (21.8% below list).
- Recommended offer: $390k (21.8% below list) — sets the bar for 1% rule.
Location & tenants
- Location reads 53/100 on livability (#143 in HI) — a working-class tenant base; expect higher turnover. Strengths: housing B; Watch: health & safety C-, schools D-, amenities F.
- Hawaii Department Of Education (suburban): math 32% / reading 50% proficiency, ranked #1 of 1 in HI (top 100%) — families likely to look elsewhere, expect single-tenant / working-renter base with shorter leases.
- Market conditions: 32 active listings in the ZIP; 982 units permitted in Hawaii County in 2024 (0 in 5+ unit buildings).
Forward outlook
- Local home prices are declining (-2.0%/yr); year-one equity from $3k of loan paydown is wiped out by about $10k of value loss. Plan a longer hold.
- Hawaii County population projected at +24% by 2050 — long-run rental-demand tailwind backs the buy-and-hold thesis.
Negotiation context
- It's been on market 44 days — a 3% lower offer ($484k) is reasonable based on typical stale-listing flexibility.
- 2 sale attempts since 13y ago with the ask held roughly flat each time — persistent listings suggest the price (not the market) is what's stuck; bring a comps-based counter.
- Current owner paid $205k; list at $499k implies a 143% gain — meaningful room to come down on a strong offer.
Questions for the listing agent
- It's been on market 44 days. Have you received any prior offers? Is the seller open to a 22% concession, seller financing, or rate buy-down credit?
- Built in 1973 — when were the roof, HVAC, electrical panel, plumbing, and water heater last replaced?
- Is there a deadline driving the sale (1031 exchange, divorce, estate, relocation)? That informs how much negotiation room exists.
- Schools are D-rated, which usually means shorter tenancies and higher turnover. Who's the typical renter profile here, and what's been the actual vacancy rate?
- The area grade is low — what's the realistic commute time and amenity access for the typical tenant pool here? Any planned neighborhood developments (good or bad) we should know about?
- What's the average days-on-market for RENTAL listings here right now (not sales)? A rising rental-DOM trend means longer vacancies and softer asking-rent achievability than the comps imply.
- What's the recent tenant-quality profile in this submarket — average credit score on applications, eviction rate, late-payment / NSF rate, and stable-employment percentage? A property-management company in the area should have these aggregated.
- How much new for-sale + rental construction is in the pipeline within 1–3 miles? Heavy new supply typically softens prices + rents 12–24 months out; constrained supply supports both.
Investment metrics
- 1% rule
- 0.78% ✗
- Cap rate
- 6.53%
- Cash-on-cash
- 0.83%
- DSCR
- 1.04
- GRM
- 10.7
CMA / ARV
- ARV (median comp)
- $1,484,760
- List price
- $499,000
- Delta
- -66.39%
- Verdict
- UNDERPRICED
- Comps
- 5 within 2.0 mi
Show comp detail 1 sale within ~0.75 mi
| Address | Dist | Beds/Ba | Sqft | Sold | Price | $/sf | Match |
|---|---|---|---|---|---|---|---|
| 78-7238 Puupele Rd | 0.45mi | 2/2.5 (-1) | 2,247 (+6%) | 9mo | $1,800,000 | $801 | 54 |
Match score weights: distance 35% · size 25% · config 20% · recency 20%. Top-matched comps best support the ARV.
Projected returns pro-forma
-1.96% appreciation · 3.0% rent growth · sell at horizon
- IRR
- -9.5%
- Equity multiple
- 0.62×
- Total profit
- $-52,774
- Equity at exit
- $97,939
- IRR
- -1.7%
- Equity multiple
- 0.86×
- Total profit
- $-19,127
- Equity at exit
- $84,677
Cash invested: $139,720 (down + closing). Projections, not guarantees.
Landlord ↔ Tenant lean methodology
- Overall (STATE)
- 37 Tenant-Leaning
- State Hawaii
- 37 Tenant-Leaning · D+13
- County
- — inherits STATE
- City
- — inherits STATE
ZIP-level market 96725
- Home prices YoY
- -1.1%
- Active inventory
- 32
- Price-to-rent
- 10.7×
Monthly cashflow live
- Estimated rent
- $3,904 medium interval (Pro) →
- Mortgage (P&I)
- −$2,617
- Tax from tax record
- −$162 /mo · $1,949/yr
- Insurance
- −$208
- HOA
- −$0
- Vacancy / Maint / Mgmt
- −$820
- Net cashflow
- $97
Break-even live
UW: 25.0% down · 7.5% · 30yr · 1.5% tax · 5.0% vac · 8.0% maint · 8.0% mgmt
Financing live
Cash to close
- Down payment
- $124,750
- Closing costs
- $14,970
- Reserves months
- —
- Total cash needed
- —
Loan-product check · same deal, 3 products live
Conventional
25% down · 7.5% · 30yr
- Down + closing
- —
- Monthly P&I
- —
- Monthly cashflow
- —
- DSCR
- —
- Eligible?
- —
Personal DTI + credit; lowest rate.
DSCR
20% down · 8.5% · 30yr
- Down + closing
- —
- Monthly P&I
- —
- Monthly cashflow
- —
- DSCR
- —
- Eligible?
- —
No personal income docs; deal must DSCR.
Hard money
10% down · 12.0% · 12mo
- Down + closing
- —
- Monthly P&I
- —
- Monthly cashflow
- —
- DSCR
- —
- Eligible?
- —
Short-term bridge; refi at stabilization.
Listing history 23 events
-
2026-06-18days on market $499,000 Active 44 DOM
-
2026-06-17days on market $499,000 Active 43 DOM
-
2026-06-16days on market $499,000 Active 42 DOM
-
2026-06-15days on market $499,000 Active 41 DOM
-
2026-06-13days on market $499,000 Active 39 DOM
-
2026-06-13days on market $499,000 Active 38 DOM
-
2026-06-10days on market $499,000 Active 36 DOM
-
2026-06-09days on market $499,000 Active 35 DOM
-
2026-06-08days on market $499,000 Active 34 DOM
-
2026-06-07days on market $499,000 Active 33 DOM
-
2026-06-05days on market $499,000 Active 30 DOM
-
2026-06-03days on market $499,000 Active 29 DOM
-
2026-06-02days on market $499,000 Active 28 DOM
-
2026-06-01days on market $499,000 Active 27 DOM
-
2026-05-31days on market $499,000 Active 26 DOM
-
2026-05-05$499,000 Active 1799-char remark
-
2014-04-10soldstatus $205,000 413-char remark
Show marketing remark (413 chars)
Check this out, alot of house for the money! Spacious home with plenty of privacy. 3 bedroom 2 bath on the upper level with screened in lanai with some ocean views, extra room could be den or another bedroom with separate entrance. The lower level is a 2 bedroom 1 bath, and another area with lots of extra storage. Great elevation with cool breezes and great location for easy to drive to Keauhou or Kailua Kona.
-
2013-04-08$249,000 413-char remark
Show marketing remark (413 chars)
Check this out, alot of house for the money! Spacious home with plenty of privacy. 3 bedroom 2 bath on the upper level with screened in lanai with some ocean views, extra room could be den or another bedroom with separate entrance. The lower level is a 2 bedroom 1 bath, and another area with lots of extra storage. Great elevation with cool breezes and great location for easy to drive to Keauhou or Kailua Kona.
-
2011-09-21soldstatus $79,340
-
1999-09-22soldstatus $220,000
-
1987-02-01soldstatus $159,000
-
1981-12-01soldstatus $163,000
-
1979-05-01soldstatus $150,000
ⓘ Source: listings_history table (triggers on properties + properties_extension) + one-shot
backfill from property_details.listing_events for pre-trigger history.
Tax reassessment forecast HI · Partial reset (capped growth)
- Current annual tax
- $1,949 · $162/mo
- Projected year-2 tax
- $1,949 · $162/mo
- Expected delta
- $0/yr ($0/mo · -0.0%)
ⓘ Screening estimate from a state-policy table — verify with the county assessor before closing.
Climate risk First Street
- Flood 1/10 Low FEMA zone X (unshaded) · 0% chance over 30 yrs
- Air quality 1/10 Low
Nearby sold comps map
Loading sold comps map…
Walkable amenities ~0.75 mi
Loading nearby amenities…
Taxation est. · year 1
- Rental income
- $46,850
- − Mortgage interest
- −$27,952
- − Property taxes
- −$1,949
- − Insurance
- −$2,495
- − Repairs & maintenance
- −$3,748
- − Management
- −$3,748
- − Depreciation
- −$14,516
- Taxable loss
- −$7,559
- Est. tax savings @ 24.0%
- +$1,814
- After-tax cash flow
- $2,979/yr
For passive investors: Depreciation is non-cash, so a rental often shows a tax loss while cash-flowing — sheltering income. Rental losses are passive: they offset passive income freely, and up to $25,000/yr can offset ordinary (W-2) income if you actively participate and your MAGI is under $100k (phasing out to $0 by $150k); unused losses carry forward. On sale, claimed depreciation is recaptured at up to 25%, and gains may owe capital-gains tax (a 1031 exchange can defer both). Figures are a year-1 estimate at your 24.0% rate — not tax advice; consult a CPA.
Schools (NCES district)
- District
- Hawaii Department Of Education
- NCES district ID
- 1500030
- Math proficiency
- 32% ▼ -10.00%
- Reading proficiency
- 50% ▼ -3.00%
- Median HH income
- $69,005
- Composite
- 37.07/100
- National rank
- #4504
- State rank
- #1 of 1 in HI
Livability — Honalo
- Score
- 53/100
- State rank
- #143
- US rank
- #24623
Category grades
Schools grade is shown separately in the Schools card above.
Census & demographics
- Census place
- Honalo, HI
- City population
- 4,672
- Population (ZIP)
- 4,672
Population outlook (Hawaii County) Hauer SSP2
- Today (2025)
- 220,733 people
- By 2030
- 232,156 · +5.2%
- By 2040
- 252,486 · +14.4%
- By 2050
- 272,703 · +23.5%
- By 2075
- 332,113 · +50.5%
- By 2100
- 398,342 · +80.5%
Race, ethnicity, and origin ACS 2023
- Neighborhood character
- Highly diverse neighborhood (Simpson 0.80)
- Race & ethnicity
- White 39% Two or more races 35% Hispanic / Latino 16% Asian 15% Pacific Islander 4%
- Hispanic origin (detail)
- Mexican 8% Puerto Rican 2%
- Common ancestry
- Russian 3% Romanian 2% Italian 2%
- Foreign-born
- 12% · Canada
- Languages at home
- 86% English-only · Spanish 6% Other Asian/Pacific 5% Korean 1%
Political lean MEDSL · Hawaii
- 2024 margin
- Strong D (+28.3) · D 63.0% · R 34.7% · Other 2.3%
- 2008→2024 swing
- -25.4pp toward R · 2008: 53.7pp · 2024: 28.3pp
- All cycles
- 2024: D+28.3 2020: D+36.2 2016: D+36.6 2012: D+51.3 2008: D+53.7
Not yet ingested
- Civics
- —
Market trends
- HPI YoY
- ▼ -1.96%
- Current HPI
- 169.3531
- Rent YoY
- —
- Metro
- —
- State GDP YoY
- —
- F500 in state
- 0
Price history
+232.7% since first listed8 events — show timeline
- 2026-05-05 Listed $499,000 HI Information Service
- 2014-04-10 Sold (MLS) $205,000 HI Information Service
- 2013-04-08 Listed $249,000 HI Information Service
- 2011-09-21 Sold (Public Records) $79,340 Public Records
- 1999-09-22 Sold (Public Records) $220,000 Public Records
- 1987-02-01 Sold (Public Records) $159,000 Public Records
- 1981-12-01 Sold (Public Records) $163,000 Public Records
- 1979-05-01 Sold (Public Records) $150,000 Public Records
Property tax history
+9.9%/yrLatest (2025): $1,949 · +5.0% YoY. Source: county tax records.
Cash-flow waterfall
monthlySold comps — $/sqft
last 12 mo · ≤1 miLoading sold comps…