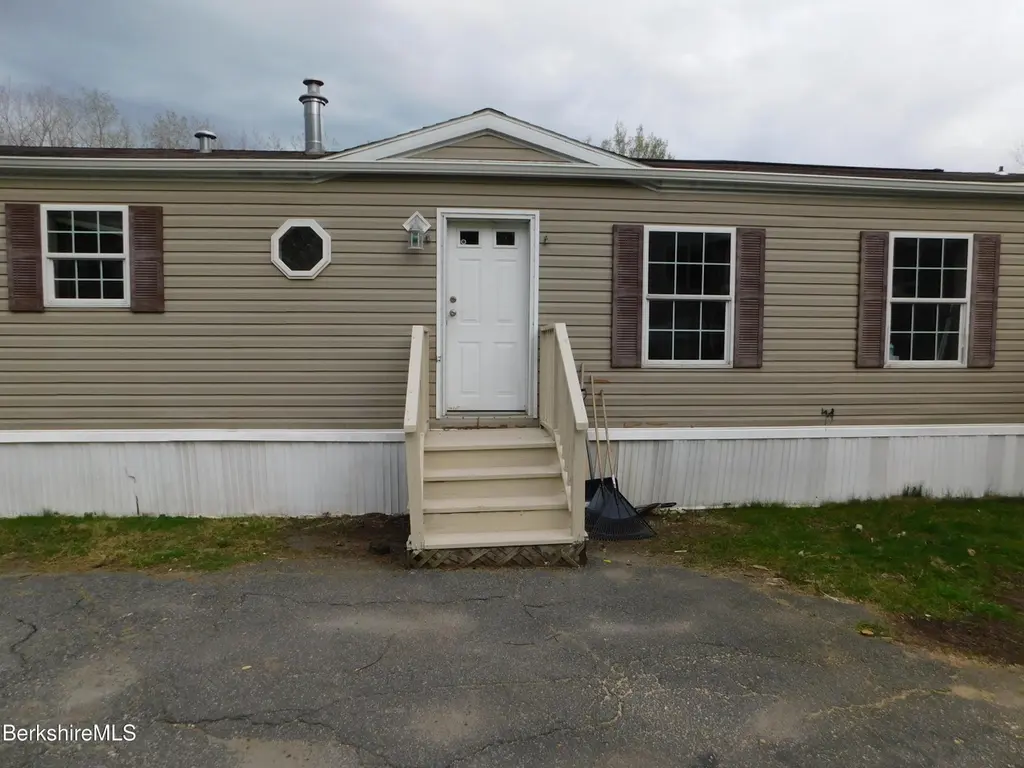
3 Lakewood Cir · Pittsfield, MA
Flood risk 1/10 · Minimal
- FEMA flood zone
- AE
- Chance of flooding over 30 yrs
- 0.0%
- Est. flood insurance / yr
- $1,737 – $8,500
Fire risk 3/10 · Minor
- Est. fire insurance / yr
- $915 – $1,699
Heat risk 2/10 · Minimal
- Hot days now (above 91°F)
- 7 days/yr
- Hot days in 30 yrs
- 15 days/yr
Wind risk 4/10 · Minor
- Chance of severe wind over 30 yrs
- 10.0%
Air-quality risk 2/10 · Minimal
- Unhealthy air days now
- 1 days/yr
- Unhealthy air days in 30 yrs
- 1 days/yr
Risk factors via First Street. Map © Google.
Why this score? — see what drove the B grade
The composite is a weighted blend of 9 inputs, each scored 0–100. Each bar is that input's sub-score; the figure is the points it added to the 100-point composite (weight × sub-score).
- Cash flow +30.0/30.0
- 1% rule +10.0/10.0
- DSCR +10.0/10.0
- ARV discount +7.5/15.0
- Rent growth +4.4/5.0
- Livability +3.8/5.0
- Schools +2.3/10.0
- Condition / age +2.2/5.0
- Appreciation +0.0/10.0
$99,000
🖨 Deal sheet (PDF) 📄 Offer letter ✓ Due diligence
Listing remarks
Move right in and enjoy this new remodeled manufactured home. New dishwasher and microwave. Large primary bedroom with a full bath. Laundry room off the kitchen for easy access. 2 additional bedrooms and full bath. Small deck off the side of the house.
Key facts
- Built 2006
- Listed 17 days
Property features AI
Exterior
- Utilities: 100 amp electric service; Public sewer
- Home design: Updated/remodeled condition; Property subtype: General
- Construction: Fiberglass and asphalt roof; Building area approximately 970
- Exterior features: Deck
Interior
- Kitchen: Refrigerator; Microwave; Dishwasher
- Bedrooms: 5 rooms total (includes bedrooms and living spaces)
- Flooring: Carpet; Laminate; Linoleum
- Bathrooms: 2 full bathrooms
- Heating & cooling: Natural gas heating; Has heating
- Interior features: Vaulted ceilings; Cable available; Accessible full bathroom; First-floor bedroom with bath
- Laundry & utility: Washer; Dryer
Neighborhood map
What this means for you Summary
Snapshot
- This is a 3-bed/2.0-bath manufactured listed at $99k. Condition is rated fair.
Deal economics
- At list price, monthly cash flow is $262 ($3k/yr) — positive.
- The deal already cash-flows at list — no discount required.
- Meets the 1% rule at list price ($2k rent vs $99k).
- Recommended offer: $98k (1.5% below list) — sets the bar for market timing.
- Cap rate 14.6% vs local median 3.6% in Pittsfield — top-decile yield for the area; either an underpriced asset or a hidden risk that comps aren't pricing in. Stress-test before assuming the spread holds.
Location & tenants
- Location reads 75/100 on livability (#70 in MA, #3,820 nationally) — a middle-class / working-renter tenant base. Strengths: commute A+, housing A+, health & safety A+; Watch: employment C-, amenities D+, crime D.
- Pittsfield (urban): math 19% / reading 34% proficiency, ranked #272 of 302 in MA (top 90%) — low school quality limits family demand, transient renter base, plan for 1-2y turnover.
- Zoned schools: Robert T. Capeless Elementary School (math 32% / reading 52%, grade F, #462 of 938 statewide, top 52%, 181 students, 0% FRL); Taconic High (math 27% / reading 37%, grade F, #255 of 343 statewide, top 77%, 860 students, 0% FRL) — zoned schools average 0% FRL vs 50% district-wide (50 pts lower); this property's tenant base skews higher-income than the district average.
- Market conditions: Rents rising fast (+7.7%/yr); 276 active listings in the ZIP; 3 comparable units currently listed for rent nearby; rentals at typical pace (median 24d on market — plan ~3-4 weeks tenant-placement turnaround); 130 units permitted in Berkshire County in 2024 (10 in 5+ unit buildings).
Forward outlook
- Local home prices are declining (-3.0%/yr); year-one equity from $684 of loan paydown is wiped out by about $3k of value loss. Plan a longer hold.
- Berkshire County population projected at -24% by 2050 — secular population decline; favor cash flow + early exit over multi-decade hold.
- At projected returns (-3.0% appreciation + 7.7% rent growth), your $28k cash investment doubles in ~7 years — after that, you're playing with house money.
Negotiation context
- It's been on market 17 days — a 2% lower offer ($98k) is reasonable based on typical stale-listing flexibility.
Risks & watch-outs
- Watch-outs: flood insurance adds $427/mo.
- Climate carrying-cost: in FEMA flood zone AE (mandatory federal flood insurance) — expect insurance premiums to compound above CPI over the hold.
Questions for the listing agent
- Have any recent inspections been done? Can we get a copy of the seller's disclosures and any deferred-maintenance estimates?
- What's the actual annual flood-insurance premium (NFIP or private), and is the property in a SFHA with mandatory coverage?
- Is there a deadline driving the sale (1031 exchange, divorce, estate, relocation)? That informs how much negotiation room exists.
- Schools are D-rated, which usually means shorter tenancies and higher turnover. Who's the typical renter profile here, and what's been the actual vacancy rate?
- Crime grade is D in this area — have there been break-ins, vandalism, or insurance claims at this property in the last 3 years? What carrier currently insures it and at what premium?
- What's the average days-on-market for RENTAL listings here right now (not sales)? A rising rental-DOM trend means longer vacancies and softer asking-rent achievability than the comps imply.
- What's the recent tenant-quality profile in this submarket — average credit score on applications, eviction rate, late-payment / NSF rate, and stable-employment percentage? A property-management company in the area should have these aggregated.
- How much new for-sale + rental construction is in the pipeline within 1–3 miles? Heavy new supply typically softens prices + rents 12–24 months out; constrained supply supports both.
Investment metrics
- 1% rule
- 1.76% ✓
- Cap rate
- 14.64%
- Cash-on-cash
- 29.82%
- DSCR
- 2.33
- GRM
- 4.7
CMA / ARV
- ARV (median comp)
- $99,000
- List price
- $99,000
- Delta
- —
- Verdict
- FAIR
- Comps
- 3 within 1.0 mi
Show comp detail 5 sales within ~0.75 mi
| Address | Dist | Beds/Ba | Sqft | Sold | Price | $/sf | Match |
|---|---|---|---|---|---|---|---|
| 26 Lakewood Cir | 0.07mi | 3/1.0 | 1,008 (+4%) | 1mo | $99,000 | $98 | 85 |
| 16 Lakewood Dr | 0.21mi | 3/1.5 | 967 (-0%) | 20mo | $90,000 | $93 | 71 |
| 30 Lakewood Dr | 0.30mi | 2/2.0 (-1) | 900 (-7%) | 1mo | $92,500 | $103 | 69 |
| 19 Lakewood Dr | 0.23mi | 2/1.0 (-1) | 1,000 (+3%) | 9mo | $103,000 | $103 | 68 |
| 44 Lakewood Dr | 0.28mi | 3/1.5 | 920 (-5%) | 18mo | $93,000 | $101 | 62 |
Match score weights: distance 35% · size 25% · config 20% · recency 20%. Top-matched comps best support the ARV.
Projected returns pro-forma
-3.0% appreciation · 7.72% rent growth · sell at horizon
- IRR
- 8.2%
- Equity multiple
- 1.35×
- Total profit
- $9,596
- Equity at exit
- $14,761
- IRR
- 22.4%
- Equity multiple
- 3.53×
- Total profit
- $70,156
- Equity at exit
- $8,560
Cash invested: $27,720 (down + closing). Projections, not guarantees.
Landlord ↔ Tenant lean methodology
- Overall (STATE)
- 20 Strongly Tenant-Friendly
- State Massachusetts
- 20 Strongly Tenant-Friendly · D+15
- County
- — inherits STATE
- City
- — inherits STATE
ZIP-level market 01201
- Rents YoY
- 7.7%
- Active inventory
- 276
- Price-to-rent
- 4.7×
Monthly cashflow live
- Estimated rent
- $1,738 medium interval (Pro) →
- Mortgage (P&I)
- −$519
- Tax est. 1.5%
- −$124 /mo · $1,485/yr
- Insurance
- −$41
- Flood insurance flood zone
- −$427 /mo · $5,118/yr
- HOA
- −$0
- Vacancy / Maint / Mgmt
- −$365
- Net cashflow
- $262
Break-even live
Sensitivity live
| Price | -10% $331 | -5% $296 | +0% $262 | +5% $228 | +10% $194 |
|---|---|---|---|---|---|
| Rent | -10% $125 | -5% $194 | +0% $262 | +5% $331 | +10% $400 |
| Rate | -1.0pp $312 | -0.5pp $287 | base $262 | +0.5pp $237 | +1.0pp $211 |
UW: 25.0% down · 7.5% · 30yr · 1.5% tax · 5.0% vac · 8.0% maint · 8.0% mgmt
Financing live
Cash to close
- Down payment
- $24,750
- Closing costs
- $2,970
- Reserves months
- —
- Total cash needed
- —
Loan-product check · same deal, 3 products live
Conventional
25% down · 7.5% · 30yr
- Down + closing
- —
- Monthly P&I
- —
- Monthly cashflow
- —
- DSCR
- —
- Eligible?
- —
Personal DTI + credit; lowest rate.
DSCR
20% down · 8.5% · 30yr
- Down + closing
- —
- Monthly P&I
- —
- Monthly cashflow
- —
- DSCR
- —
- Eligible?
- —
No personal income docs; deal must DSCR.
Hard money
10% down · 12.0% · 12mo
- Down + closing
- —
- Monthly P&I
- —
- Monthly cashflow
- —
- DSCR
- —
- Eligible?
- —
Short-term bridge; refi at stabilization.
Rent comps 3 comps
| Address | Beds | Baths | Sqft | Rent | $/sqft | DOM | Units | Dist |
|---|---|---|---|---|---|---|---|---|
| 323 Lenox Ave Unit 2 Pittsfield, MA | 2.0 | 1.0 | 784 | $1,650 | $2.10 | 44d | 1 | 0.95mi |
| 266 Linden St Unit 2R Pittsfield, MA | 3.0 | 1.0 | 1000 | $1,750 | $1.75 | 24d | 1 | 1.07mi |
| 37 Monroe St Pittsfield, MA | 2.0 | 1.0 | 800 | $1,550 | $1.94 | 24d | 1 | 1.19mi |
Listing history 1 events
-
2026-05-06$99,000 Active 256-char remark
ⓘ Source: listings_history table (triggers on properties + properties_extension) + one-shot
backfill from property_details.listing_events for pre-trigger history.
Climate risk First Street
- Flood 1/10 Low FEMA zone AE · 0% chance over 30 yrs
- Wildfire 3/10 Moderate
- Heat 2/10 Low 7 d/yr ≥91°F today · 15 d/yr by 30 yrs out
- Wind 4/10 Moderate 10% chance of damaging wind over 30 yrs
- Air quality 2/10 Low 1 unhealthy d/yr today · 1 by 30 yrs out
Nearby sold comps map
Loading sold comps map…
Walkable amenities ~0.75 mi
Loading nearby amenities…
Taxation est. · year 1
- Rental income
- $20,855
- − Mortgage interest
- −$5,546
- − Property taxes
- −$1,485
- − Insurance
- −$5,614
- − Repairs & maintenance
- −$1,668
- − Management
- −$1,668
- − Depreciation
- −$2,880
- Taxable income
- $1,994
- Est. tax owed @ 24.0%
- −$479
- After-tax cash flow
- $2,668/yr
For passive investors: Depreciation is non-cash, so a rental often shows a tax loss while cash-flowing — sheltering income. Rental losses are passive: they offset passive income freely, and up to $25,000/yr can offset ordinary (W-2) income if you actively participate and your MAGI is under $100k (phasing out to $0 by $150k); unused losses carry forward. On sale, claimed depreciation is recaptured at up to 25%, and gains may owe capital-gains tax (a 1031 exchange can defer both). Figures are a year-1 estimate at your 24.0% rate — not tax advice; consult a CPA.
Condition & rehab AI · 25 photos
This manufactured home requires moderate repairs and maintenance to improve its condition and value. Painting, updating fixtures, and landscaping would significantly enhance its appeal.
Repairs flagged
- Moderate Exterior siding — Weathered and needs repainting
- Minor Kitchen cabinets — Worn and could benefit from a fresh coat of paint
- Minor Bathroom fixtures — Dated and could be replaced
Value-add opportunities
- Both Paint interior walls and cabinets — Fresh paint enhances curb appeal and interior aesthetics
- Both Replace countertops and fixtures — Modern countertops and fixtures improve functionality and appeal
- Both Landscaping and yard maintenance — A well-maintained yard and deck can significantly increase curb appeal and property value
Renovation cost estimate screening
| Repair item | Severity | Est. cost |
|---|---|---|
| Exterior siding · Weathered and needs repainting | Moderate | $3,000–15,000 |
| Kitchen cabinets · Worn and could benefit from a fresh coat of paint | Minor | $500–3,000 |
| Bathroom fixtures · Dated and could be replaced | Minor | $500–3,000 |
| Total estimated repair cost · 3 items | $4,000–21,000 |
Value-add ROI direction
- Both Paint interior walls and cabinets — Fresh paint enhances curb appeal and interior aesthetics ↑
- Both Replace countertops and fixtures — Modern countertops and fixtures improve functionality and appeal ↑
- Both Landscaping and yard maintenance — A well-maintained yard and deck can significantly increase curb appeal and property value ↑
ⓘ Cost ranges are severity-bucket heuristics (US national rule-of-thumb). Get contractor quotes + a written scope before underwriting a rehab budget.
Schools (NCES district)
- District
- Pittsfield
- NCES district ID
- 2509630
- Math proficiency
- 19% ▼ -10.00%
- Reading proficiency
- 34% ▼ -2.00%
- Median HH income
- $44,032
- Composite
- 22.67/100
- National rank
- #8046
- State rank
- #272 of 302 in MA
Livability — Pittsfield
- Score
- 75/100
- State rank
- #70
- US rank
- #3820
Category grades
Schools grade is shown separately in the Schools card above.
Census & demographics
- Census place
- Pittsfield, MA
- County
- Berkshire County · 44,848 people
- City population
- 44,848
- Metro
- Pittsfield, MA
- Population (ZIP)
- 44,848
- Household income
- $71,093
- Rent vs Own
- Severe rent burden
- 1580.0
Population outlook (Berkshire County) Hauer SSP2
- Today (2025)
- 119,723 people
- By 2030
- 114,608 · -4.3%
- By 2040
- 102,806 · -14.1%
- By 2050
- 91,305 · -23.7%
- By 2075
- 71,517 · -40.3%
- By 2100
- 57,988 · -51.6%
Race, ethnicity, and origin ACS 2023
- Neighborhood character
- Predominantly White (78%)
- Race & ethnicity
- White 78% Two or more races 10% Hispanic / Latino 9% Black 5% Asian 1%
- Hispanic origin (detail)
- Puerto Rican 3%
- Common ancestry
- Lithuanian 8% Romanian 6% Slovak 2%
- Foreign-born
- 7% · Canada, Jamaica
- Languages at home
- 90% English-only · Spanish 6% Other Indo-European 1% Russian/Polish/Slavic 1%
Political lean MEDSL · Berkshire
- 2024 margin
- Solid D (+39.9) · D 68.9% · R 29.0% · Other 2.1%
- 2008→2024 swing
- -12.5pp toward R · 2008: 52.4pp · 2024: 39.9pp
- All cycles
- 2024: D+39.9 2020: D+47.1 2016: D+41.5 2012: D+53.7 2008: D+52.4
Not yet ingested
- Civics
- —
Market trends
- HPI YoY
- ▼ -199.88%
- Current HPI
- 283.3421
- Rent YoY
- ▲ 7.72%
- Metro
- Pittsfield, MA
- State GDP YoY
- ▲ 2.28%
- F500 in state
- 38
Industry mix (Fortune 500 HQ in MA)
| Industry | F500 HQs | Revenue |
|---|---|---|
| Technology | 3 | $17B |
|
||
| Insurance | 2 | $84B |
|
||
| Retail | 2 | $76B |
|
||
| Life Sciences | 1 | $43B |
|
||
| Energy Technology | 1 | $31B |
|
||
| Aerospace / Defense | 1 | $18B |
|
||
Price history
2 events — show timeline
- 2026-05-23 Pending — BCMLS
- 2026-05-06 Listed $99,000 BCMLS
Cash-flow waterfall
monthlySold comps — $/sqft
last 12 mo · ≤1 miLoading sold comps…