1357 Fairlawn Dr · Rantoul, IL
Flood risk 6/10 · Moderate
- FEMA flood zone
- X (unshaded)
- Chance of flooding over 30 yrs
- 0.69%
- Est. flood insurance / yr
- $507 – $1,088
Fire risk 1/10 · Minimal
- Est. fire insurance / yr
- $804 – $1,492
Heat risk 3/10 · Minor
- Hot days now (above 104°F)
- 7 days/yr
- Hot days in 30 yrs
- 18 days/yr
Wind risk 2/10 · Minimal
- Chance of severe wind over 30 yrs
- 1.0%
Air-quality risk 2/10 · Minimal
- Unhealthy air days now
- 0 days/yr
- Unhealthy air days in 30 yrs
- 1 days/yr
Risk factors via First Street. Map © Google.
Why this score? — see what drove the D- grade
The composite is a weighted blend of 9 inputs, each scored 0–100. Each bar is that input's sub-score; the figure is the points it added to the 100-point composite (weight × sub-score).
- Appreciation +10.0/10.0
- Cash flow +8.2/30.0
- ARV discount +5.2/15.0
- Rent growth +4.1/5.0
- Livability +3.4/5.0
- Condition / age +2.5/5.0
- 1% rule +2.2/10.0
- DSCR +2.2/10.0
- Schools +1.2/10.0
$125,000
🖨 Deal sheet 📄 Offer letter ✓ Due diligence
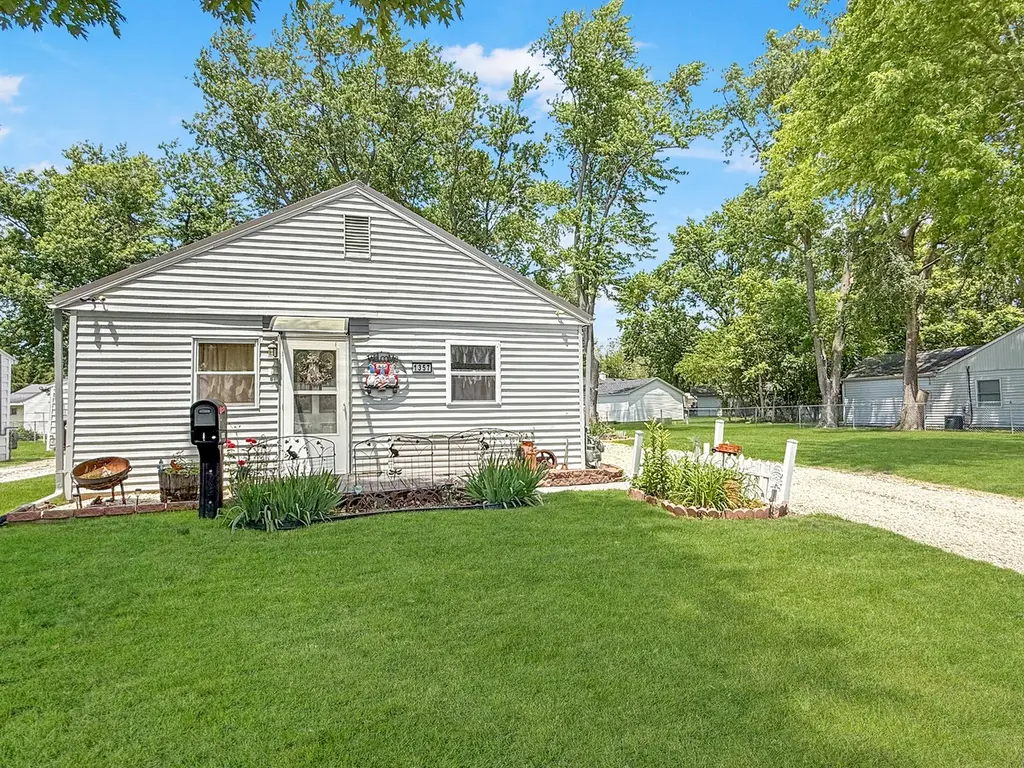
Listing remarks
Situated on a spacious double lot, this 3-bedroom, 1-bath home offers plenty with numerous updates that make it move-in ready! Recent improvements include a new metal roof (2025), HVAC system within the last 10 years, and updated siding and windows within the last decade. Inside, you'll find updated flooring and an attractive kitchen complete with a newer refrigerator and stove. Step outside to enjoy the fenced backyard, perfect for pets, play, or entertaining. The property also features a garden shed for extra storage and a detached one-car garage that is currently set up as a fun hangout space, offering endless possibilities for hobbies, gatherings, or a workshop. With the added benefit o
Key facts
- New metal roof
- Updated siding
- Updated windows
Tags
Property features AI
Finance
- Other: Property not rebuilt or rehabilitated per records; Built before 1978
- HOA & community: No master association fees (not required)
Exterior
- Parking: Detached garage (garage owned); Gravel parking; Total of 1 garage/parking space
- Utilities: Public water; Public sewer
- Home design: Detached single-family home; Single-story (1 story); Fee simple ownership
- Construction: Built approximately 71–80 years ago; Vinyl siding; Metal roof; Concrete perimeter foundation
- Exterior features: Irregular-shaped lot; Lot dimensions approximately 113.66 x 106.17 x 92 x 110
Interior
- Kitchen: Range; Refrigerator
- Bedrooms: Three bedrooms (all on the main level); sizes include 12 x 10, 12 x 12 and 12 x 9
- Bathrooms: One full bathroom
- Heating & cooling: Natural gas forced-air heating; Central air conditioning
- Interior features: Five total rooms
- Laundry & utility: Dedicated laundry room
Neighborhood map
What this means for you Summary
Snapshot
- This is a 3-bed/1.0-bath single-family listed at $125k.
Deal economics
- At list price, monthly cash flow is $-119 ($-1k/yr) — negative.
- To cash-flow at today's rent, offer at most $104k (16.8% below list).
- To meet the 1% rule (rent ≥ 1% of price), the offer needs to be $90k (27.7% below list).
- Recommended offer: $90k (27.7% below list) — sets the bar for 1% rule.
- Cap rate 5.2% vs local median 4.3% in Rantoul — meaningfully above typical; check what's discounted (condition, days-on-market, listing class) to confirm the premium yield is real.
Location & tenants
- Location reads 67/100 on livability (#533 in IL) — a middle-class / working-renter tenant base. Strengths: cost of living A+, housing A+, health & safety B; Watch: employment D, crime F, amenities F.
- Rantoul Township Hsd 193 (town): math 10% / reading 10% proficiency, ranked #824 of 919 in IL (top 90%) — low school quality limits family demand, transient renter base, plan for 1-2y turnover.
- Zoned schools: Rantoul Twp High School (math 8% / reading 12%, grade F, #567 of 693 statewide, top 83%, 848 students, 0% FRL).
- Market conditions: Rents rising fast (+6.6%/yr); 53 active listings in the ZIP; 8 comparable units currently listed for rent nearby; rentals leasing fast (median 13d on market — plan ~1-2 weeks tenant-placement turnaround); 573 units permitted in Champaign County in 2024 (359 in 5+ unit buildings).
Forward outlook
- In year one you build about $13k of equity ($864 loan paydown + $12k appreciation (10.0% local appreciation)).
- Champaign County population projected at +15% by 2050 — modest demand growth; plan on rents tracking national, not racing it.
- By year 3, paydown + projected appreciation supports a ~$34k cash-out refi (75% LTV) — recoverable capital for the next deal without selling this one.
Negotiation context
- Only 14 days on market — expect competitive offers; lowballing is unlikely to land.
- 2 sale attempts since 20y ago with the ask held roughly flat each time — persistent listings suggest the price (not the market) is what's stuck; bring a comps-based counter.
- Current owner paid $27k; list at $125k implies a 369% gain — meaningful room to come down on a strong offer.
Risks & watch-outs
- Watch-outs: built in 1950 — expect roof / HVAC / electrical / plumbing capex.
- Climate carrying-cost: major flood risk — expect insurance premiums to compound above CPI over the hold.
Questions for the listing agent
- What do current leases actually rent for vs. the listed asking? Can we see a recent rent roll and the last 12 months of T-12 income?
- Built in 1950 — when were the roof, HVAC, electrical panel, plumbing, and water heater last replaced?
- Is there a deadline driving the sale (1031 exchange, divorce, estate, relocation)? That informs how much negotiation room exists.
- Schools are F-rated, which usually means shorter tenancies and higher turnover. Who's the typical renter profile here, and what's been the actual vacancy rate?
- Crime grade is F in this area — have there been break-ins, vandalism, or insurance claims at this property in the last 3 years? What carrier currently insures it and at what premium?
- The area grade is low — what's the realistic commute time and amenity access for the typical tenant pool here? Any planned neighborhood developments (good or bad) we should know about?
- What's the average days-on-market for RENTAL listings here right now (not sales)? A rising rental-DOM trend means longer vacancies and softer asking-rent achievability than the comps imply.
- What's the recent tenant-quality profile in this submarket — average credit score on applications, eviction rate, late-payment / NSF rate, and stable-employment percentage? A property-management company in the area should have these aggregated.
- How much new for-sale + rental construction is in the pipeline within 1–3 miles? Heavy new supply typically softens prices + rents 12–24 months out; constrained supply supports both.
Investment metrics
- 1% rule
- 0.72% ✗
- Cap rate
- 5.15%
- Cash-on-cash
- -4.07%
- DSCR
- 0.82
- GRM
- 11.5
CMA / ARV
- ARV (on-the-fly)
- $119,000
- Comps found
- 12
Show comp detail 12 sales within ~0.75 mi
| Address | Dist | Beds/Ba | Sqft | Sold | Price | $/sf | Match |
|---|---|---|---|---|---|---|---|
| 1424 Mather Dr | 0.32mi | 3/1.0 | 864 (-1%) | 4mo | $115,575 | $134 | 80 |
| 1016 Klein Ave | 0.33mi | 3/1.0 | 870 (-1%) | 7mo | $135,000 | $155 | 78 |
| 1468 Mather Dr | 0.40mi | 3/1.0 | 848 (-3%) | 1mo | $100,000 | $118 | 76 |
| 19 Charles Dr | 0.33mi | 2/1.0 (-1) | 898 (+3%) | 6mo | $37,000 | $41 | 70 |
| 932 E Sangamon Ave | 0.40mi | 2/1.0 (-1) | 925 (+6%) | 2mo | $60,000 | $65 | 66 |
| 1640 Short St | 0.53mi | 3/1.0 | 925 (+6%) | 0mo | $139,900 | $151 | 66 |
| 925 E Sangamon Ave | 0.43mi | 3/1.0 | 964 (+10%) | 9mo | $132,000 | $137 | 56 |
| 617 E Wabash Ave | 0.65mi | 3/1.0 | 990 (+13%) | 0mo | $129,900 | $131 | 48 |
| 804 Juniper Dr | 0.72mi | 2/1.0 (-1) | 807 (-8%) | 1mo | $120,000 | $149 | 47 |
| 1037 Bel Aire Dr | 0.73mi | 2/1.0 (-1) | 780 (-11%) | 1mo | $120,000 | $154 | 42 |
| 1116 Bel Aire Dr | 0.64mi | 2/1.0 (-1) | 760 (-13%) | 2mo | $90,400 | $119 | 42 |
| 800 Juniper Dr | 0.71mi | 3/1.5 | 1,000 (+14%) | 4mo | $135,500 | $136 | 38 |
Match score weights: distance 35% · size 25% · config 20% · recency 20%. Top-matched comps best support the ARV.
Projected returns pro-forma
10.0% appreciation · 6.56% rent growth · sell at horizon
- IRR
- 22.4%
- Equity multiple
- 2.82×
- Total profit
- $63,871
- Equity at exit
- $112,610
- IRR
- 20.9%
- Equity multiple
- 6.77×
- Total profit
- $201,867
- Equity at exit
- $242,848
Cash invested: $35,000 (down + closing). Projections, not guarantees.
Landlord ↔ Tenant lean methodology
- Overall (STATE)
- 43 Moderately Tenant-Leaning
- State Illinois
- 43 Moderately Tenant-Leaning · D+7
- County
- — inherits STATE
- City
- — inherits STATE
ZIP-level market 61866
- Home prices YoY
- 10.8%
- Rents YoY
- 6.6%
- Active inventory
- 53
- Price-to-rent
- 11.5×
Monthly cashflow live
- Estimated rent
- $903 high interval (Pro) →
- Mortgage (P&I)
- −$656
- Tax from tax record
- −$125 /mo · $1,497/yr
- Insurance
- −$52
- HOA
- −$0
- Vacancy / Maint / Mgmt
- −$190
- Net cashflow
- $-119
Break-even live
UW: 25.0% down · 7.5% · 30yr · 1.5% tax · 5.0% vac · 8.0% maint · 8.0% mgmt
Financing live
Cash to close
- Down payment
- $31,250
- Closing costs
- $3,750
- Reserves months
- —
- Total cash needed
- —
Loan-product check · same deal, 3 products live
Conventional
25% down · 7.5% · 30yr
- Down + closing
- —
- Monthly P&I
- —
- Monthly cashflow
- —
- DSCR
- —
- Eligible?
- —
Personal DTI + credit; lowest rate.
DSCR
20% down · 8.5% · 30yr
- Down + closing
- —
- Monthly P&I
- —
- Monthly cashflow
- —
- DSCR
- —
- Eligible?
- —
No personal income docs; deal must DSCR.
Hard money
10% down · 12.0% · 12mo
- Down + closing
- —
- Monthly P&I
- —
- Monthly cashflow
- —
- DSCR
- —
- Eligible?
- —
Short-term bridge; refi at stabilization.
Rent comps 8 comps
| Address | Beds | Baths | Sqft | Rent | $/sqft | DOM | Units | Dist |
|---|---|---|---|---|---|---|---|---|
| 603 S Maplewood Dr Unit 6031-MW Rantoul, IL | 2.0 | 1.0 | 675 | $785 | $1.16 | 20d | 1 | 0.19mi |
| 620 Willow Pond Rd Rantoul, IL | 2.0–4.0 | 1.5–2.5 | 1320 | $915 | $0.69 | 2d | 7 | 0.47mi |
| 909 N Maplewood Dr Rantoul, IL | 2.0–3.0 | 1.0 | 950 | $910 | $0.96 | 2d | 8 | 0.81mi |
| 54 Mahoning Ave Unit 54 Rantoul, IL | 3.0 | 1.0 | 960 | $1,100 | $1.15 | 13d | 1 | 0.81mi |
| 40 Mahoning Ave Rantoul, IL | 2.0 | 1.0 | 700 | $425 | $0.61 | 2d | 1 | 0.84mi |
| 418 N High St Rantoul, IL | 2.0 | 1.0 | 650 | $775 | $1.19 | 13d | 1 | 0.92mi |
| 1505 Hobson Dr Rantoul, IL | 1.0–3.0 | 1.0–1.5 | 925 | $995 | $1.08 | 2d | 7 | 1.20mi |
| 355 North Dr Unit 355-06 Rantoul, IL | 2.0 | 1.0 | 600 | $750 | $1.25 | 13d | 1 | 1.23mi |
Listing history 12 events
-
2026-06-19price $125,000 Active 14 DOM
-
2026-06-18days on market $129,900 Active 14 DOM
-
2026-06-17days on market $129,900 Active 13 DOM
-
2026-06-16days on market $129,900 Active 12 DOM
-
2026-06-15days on market $129,900 Active 11 DOM
-
2026-06-14days on market $129,900 Active 9 DOM
-
2026-06-13days on market $129,900 Active 8 DOM
-
2026-06-10days on market $129,900 Active 6 DOM
-
2026-06-09days on market $129,900 Active 5 DOM
-
2026-06-08days on market $129,900 Active 4 DOM
-
2026-06-07remarks 699-char remark
-
2026-06-07$129,900 Active 3 DOM
ⓘ Source: listings_history table (triggers on properties + properties_extension) + one-shot
backfill from property_details.listing_events for pre-trigger history.
Tax reassessment forecast IL · Partial reset (capped growth)
- Current annual tax
- $1,497 · $125/mo
- Projected year-2 tax
- $2,167 · $181/mo
- Expected delta
- +$670/yr (+$56/mo · 44.8%)
ⓘ Screening estimate from a state-policy table — verify with the county assessor before closing.
Climate risk First Street
- Flood 6/10 Major FEMA zone X (unshaded) · 69% chance over 30 yrs
- Wildfire 1/10 Low
- Heat 3/10 Moderate 7 d/yr ≥104°F today · 18 d/yr by 30 yrs out
- Wind 2/10 Low 100% chance of damaging wind over 30 yrs
- Air quality 2/10 Low 0 unhealthy d/yr today · 1 by 30 yrs out
Nearby sold comps map
Loading sold comps map…
Walkable amenities ~0.75 mi
Loading nearby amenities…
Taxation est. · year 1
- Rental income
- $10,842
- − Mortgage interest
- −$7,002
- − Property taxes
- −$1,497
- − Insurance
- −$625
- − Repairs & maintenance
- −$867
- − Management
- −$867
- − Depreciation
- −$3,636
- Taxable loss
- −$3,653
- Est. tax savings @ 24.0%
- +$877
- After-tax cash flow
- $-546/yr
For passive investors: Depreciation is non-cash, so a rental often shows a tax loss while cash-flowing — sheltering income. Rental losses are passive: they offset passive income freely, and up to $25,000/yr can offset ordinary (W-2) income if you actively participate and your MAGI is under $100k (phasing out to $0 by $150k); unused losses carry forward. On sale, claimed depreciation is recaptured at up to 25%, and gains may owe capital-gains tax (a 1031 exchange can defer both). Figures are a year-1 estimate at your 24.0% rate — not tax advice; consult a CPA.
Schools (NCES district)
- District
- Rantoul Township Hsd 193
- NCES district ID
- 1733240
- Math proficiency
- 10% ▼ -5.00%
- Reading proficiency
- 10% ▬ 0.00%
- Median HH income
- $38,128
- Composite
- 12.14/100
- National rank
- #14582
- State rank
- #824 of 919 in IL
Livability — Rantoul
- Score
- 67/100
- State rank
- #533
- US rank
- #11081
Category grades
Schools grade is shown separately in the Schools card above.
Census & demographics
- Census place
- Rantoul, IL
- County
- Champaign County · 182,148 people
- City population
- 13,470
- Metro
- Champaign-Urbana, IL
- Population (ZIP)
- 13,470
- Household income
- $50,686
- Rent vs Own
- Severe rent burden
- 281.0
Population outlook (Champaign County) Hauer SSP2
- Today (2025)
- 223,848 people
- By 2030
- 231,416 · +3.4%
- By 2040
- 244,321 · +9.1%
- By 2050
- 256,432 · +14.6%
- By 2075
- 285,823 · +27.7%
- By 2100
- 296,406 · +32.4%
Race, ethnicity, and origin ACS 2023
- Neighborhood character
- Diverse neighborhood (Simpson 0.69)
- Race & ethnicity
- White 48% Two or more races 23% Hispanic / Latino 21% Black 20%
- Hispanic origin (detail)
- Mexican 16% Puerto Rican 3%
- Common ancestry
- Romanian 1% Iranian 1% Slovak 1%
- Foreign-born
- 9% · Canada, Jamaica
- Languages at home
- 84% English-only · Spanish 14% Russian/Polish/Slavic 1%
Political lean MEDSL · Champaign
- 2024 margin
- Strong D (+24.1) · D 61.3% · R 37.2% · Other 1.5%
- 2008→2024 swing
- +6.6pp toward D · 2008: 17.5pp · 2024: 24.1pp
- All cycles
- 2024: D+24.1 2020: D+22.8 2016: D+18.4 2012: D+6.8 2008: D+17.5
Not yet ingested
- Civics
- —
Market trends
- HPI YoY
- ▲ 26.49%
- Current HPI
- 272.2527
- Rent YoY
- ▲ 6.56%
- Metro
- Champaign-Urbana, IL
- State GDP YoY
- ▲ 1.59%
- F500 in state
- 60
Industry mix (Fortune 500 HQ in IL)
| Industry | F500 HQs | Revenue |
|---|---|---|
| Insurance | 4 | $201B |
|
||
| Consumer Goods | 4 | $87B |
|
||
| Industrial Machinery | 3 | $64B |
|
||
| Healthcare | 2 | $55B |
|
||
| Retail / Pharmacy | 1 | $148B |
|
||
| Agriculture / Food | 1 | $86B |
|
||
Price history
+387.1% since first listed4 events — show timeline
- 2026-06-04 Listed $129,900 MRED as Distributed by MLS Grid
- 2006-11-02 Listing Removed — MRED as Distributed by MLS Grid
- 2006-06-26 Listed — MRED as Distributed by MLS Grid
- 1996-05-16 Sold (Public Records) $26,666 Public Records
Property tax history
+4.6%/yrLatest (2024): $1,497 · +10.7% YoY. Source: county tax records.
Cash-flow waterfall
monthlySold comps — $/sqft
last 12 mo · ≤1 miLoading sold comps…