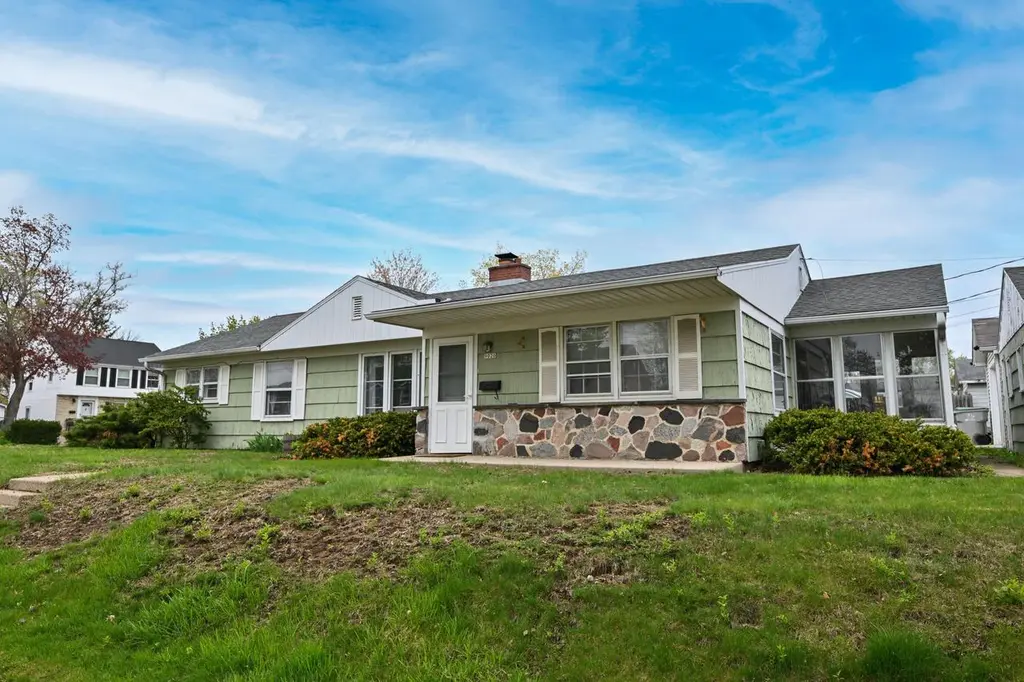
9020 W Hawthorne Ave · Milwaukee, WI
Flood risk 1/10 · Minimal
- FEMA flood zone
- X (unshaded)
- Chance of flooding over 30 yrs
- 0.0%
- Est. flood insurance / yr
- $507 – $1,088
Fire risk 1/10 · Minimal
- Est. fire insurance / yr
- $636 – $1,182
Heat risk 2/10 · Minimal
- Hot days now (above 101°F)
- 7 days/yr
- Hot days in 30 yrs
- 13 days/yr
Wind risk 2/10 · Minimal
- Chance of severe wind over 30 yrs
- —
Air-quality risk 2/10 · Minimal
- Unhealthy air days now
- 1 days/yr
- Unhealthy air days in 30 yrs
- 1 days/yr
Risk factors via First Street. Map © Google.
Why this score? — see what drove the D grade
The composite is a weighted blend of 9 inputs, each scored 0–100. Each bar is that input's sub-score; the figure is the points it added to the 100-point composite (weight × sub-score).
- ARV discount +15.0/15.0
- Cash flow +9.2/30.0
- Livability +4.0/5.0
- Rent growth +3.3/5.0
- 1% rule +3.1/10.0
- DSCR +2.6/10.0
- Condition / age +2.5/5.0
- Schools +1.2/10.0
- Appreciation +0.0/10.0
$239,900
🖨 Deal sheet 📄 Offer letter ✓ Due diligence
Listing remarks MLS
A drive-by will whet your appetite! On this corner lot lies a 3 bedroom, 1 bath stairless ranch with 2.5 garage, mature trees, lots of storage & generous sized rooms. This home features a security system, NFP, 3 season room & is freshly painted in & out. Many updates! Home warranty included. Put on your sunglasses. .. this one sparkles!
Key facts
- 6,534 sq ft lot
- 2 garage spots
- Built 1951
Property features AI
Exterior
- Parking: Detached 2-car garage with opener; Approximately 2.5 garage parking spaces
- Utilities: Municipal water; Municipal sewer; Natural gas service
- Home design: Single-family, 1-story home; Information source for year built: Assessor/Public Record; Zoning RS6
- Construction: Wood construction
- Exterior features: Wood exterior; Lot less than 1/2 acre (approx. 0.15 acre)
Interior
- Kitchen: Kitchen on main level (12 x 9); Dishwasher; Garbage disposal; Oven/Range; Refrigerator
- Bedrooms: Master bedroom on main level (12 x 11); Bedroom 2 on main level (11 x 10); Bedroom 3 on main level (10 x 9)
- Bathrooms: One full bathroom with tub/shower over tub and ceramic tile
- Heating & cooling: Forced air heating (natural gas); Central air conditioning
- Interior features: Cable/satellite available; Three season room (15 x 7); Living room (19 x 12); Dining room (12 x 11)
- Laundry & utility: Washer; Dryer
Neighborhood map
What this means for you Summary
Snapshot
- This is a 3-bed/1.0-bath single-family listed at $240k.
Deal economics
- At list price, monthly cash flow is $-180 ($-2k/yr) — negative.
- To cash-flow at today's rent, offer at most $208k (13.3% below list).
- To meet the 1% rule (rent ≥ 1% of price), the offer needs to be $193k (19.4% below list).
- Recommended offer: $193k (19.4% below list) — sets the bar for 1% rule.
Location & tenants
- Location reads 81/100 on livability (#55 in WI, #1,534 nationally) — a professional / high-income tenant draw. Strengths: amenities A+, commute A+, cost of living A+; Watch: employment D+, schools F, crime F.
- Milwaukee School District (urban): math 10% / reading 18% proficiency, ranked #337 of 342 in WI (top 98%) — low school quality limits family demand, transient renter base, plan for 1-2y turnover; 77% free/reduced lunch — lower-income household profile, screen leases tightly.
- Market conditions: Rents rising (+3.3%/yr); 36 active listings in the ZIP; 12 comparable units currently listed for rent nearby; rentals leasing fast (median 4d on market — plan ~1-2 weeks tenant-placement turnaround); solid renter incomes; 1,017 units permitted in Milwaukee County in 2024 (803 in 5+ unit buildings).
Forward outlook
- Local home prices are declining (-3.0%/yr); year-one equity from $2k of loan paydown is wiped out by about $7k of value loss. Plan a longer hold.
- Milwaukee County population projected at +4% by 2050 — modest demand growth; plan on rents tracking national, not racing it.
Negotiation context
- It's been on market 37 days — a 3% lower offer ($233k) is reasonable based on typical stale-listing flexibility.
Risks & watch-outs
- Watch-outs: built in 1951 — expect roof / HVAC / electrical / plumbing capex.
Questions for the listing agent
- What do current leases actually rent for vs. the listed asking? Can we see a recent rent roll and the last 12 months of T-12 income?
- It's been on market 37 days. Have you received any prior offers? Is the seller open to a 19% concession, seller financing, or rate buy-down credit?
- Built in 1951 — when were the roof, HVAC, electrical panel, plumbing, and water heater last replaced?
- Is there a deadline driving the sale (1031 exchange, divorce, estate, relocation)? That informs how much negotiation room exists.
- Schools are F-rated, which usually means shorter tenancies and higher turnover. Who's the typical renter profile here, and what's been the actual vacancy rate?
- Crime grade is F in this area — have there been break-ins, vandalism, or insurance claims at this property in the last 3 years? What carrier currently insures it and at what premium?
- The area grade is low — what's the realistic commute time and amenity access for the typical tenant pool here? Any planned neighborhood developments (good or bad) we should know about?
- What's the average days-on-market for RENTAL listings here right now (not sales)? A rising rental-DOM trend means longer vacancies and softer asking-rent achievability than the comps imply.
- What's the recent tenant-quality profile in this submarket — average credit score on applications, eviction rate, late-payment / NSF rate, and stable-employment percentage? A property-management company in the area should have these aggregated.
- How much new for-sale + rental construction is in the pipeline within 1–3 miles? Heavy new supply typically softens prices + rents 12–24 months out; constrained supply supports both.
Investment metrics
- 1% rule
- 0.81% ✗
- Cap rate
- 5.39%
- Cash-on-cash
- -3.22%
- DSCR
- 0.86
- GRM
- 10.3
CMA / ARV
- ARV (median comp)
- $306,801
- List price
- $239,900
- Delta
- -21.81%
- Verdict
- UNDERPRICED
- Comps
- 20 within 1.0 mi
Show comp detail 12 sales within ~0.75 mi
| Address | Dist | Beds/Ba | Sqft | Sold | Price | $/sf | Match |
|---|---|---|---|---|---|---|---|
| 9020 W Hawthorne Ave | 0.00mi | 3/1.0 | 1,338 (0%) | 0mo | $290,000 | $217 | 100 |
| 9034 W Mt Vernon Ave | 0.20mi | 3/2.0 | 1,377 (+3%) | 0mo | $405,000 | $294 | 81 |
| 210 N 90th St | 0.16mi | 3/2.0 | 1,410 (+5%) | 1mo | $387,500 | $275 | 79 |
| 610 N 99th St | 0.69mi | 3/1.0 | 1,332 (-0%) | 0mo | $350,000 | $263 | 66 |
| 236 N 90th St | 0.20mi | 4/2.0 (+1) | 1,461 (+9%) | 0mo | $327,000 | $224 | 66 |
| 8628 Glencoe Cir | 0.33mi | 3/1.5 | 1,212 (-9%) | 1mo | $430,000 | $355 | 66 |
| 505 Pleasant View St | 0.39mi | 2/1.0 (-1) | 1,481 (+11%) | 0mo | $330,000 | $223 | 58 |
| 606 S 94th Pl | 0.49mi | 3/1.5 | 1,200 (-10%) | 0mo | $290,000 | $242 | 57 |
| 170 S 80th St | 0.66mi | 3/1.5 | 1,425 (+6%) | 2mo | $340,000 | $239 | 54 |
| 8724 W Mcmyron St | 0.62mi | 3/2.0 | 1,184 (-12%) | 2mo | $330,000 | $279 | 46 |
| 656 N 99th St | 0.73mi | 3/2.0 | 1,190 (-11%) | 2mo | $350,000 | $294 | 42 |
| 331 S 80th St | 0.68mi | 3/2.0 | 1,138 (-15%) | 1mo | $326,000 | $286 | 39 |
Match score weights: distance 35% · size 25% · config 20% · recency 20%. Top-matched comps best support the ARV.
Projected returns pro-forma
-3.0% appreciation · 3.26% rent growth · sell at horizon
- IRR
- -21.3%
- Equity multiple
- 0.26×
- Total profit
- $-49,779
- Equity at exit
- $35,770
- IRR
- -14.3%
- Equity multiple
- 0.17×
- Total profit
- $-55,785
- Equity at exit
- $20,742
Cash invested: $67,172 (down + closing). Projections, not guarantees.
Landlord ↔ Tenant lean methodology
- Overall (STATE)
- 73 Landlord-Friendly
- State Wisconsin
- 73 Landlord-Friendly · R+2
- County
- — inherits STATE
- City
- — inherits STATE
ZIP-level market 53226
- Rents YoY
- 3.3%
- Active inventory
- 36
- Price-to-rent
- 10.3×
Monthly cashflow live
- Estimated rent
- $1,933 high interval (Pro) →
- Mortgage (P&I)
- −$1,258
- Tax from tax record
- −$349 /mo · $4,186/yr
- Insurance
- −$100
- HOA
- −$0
- Vacancy / Maint / Mgmt
- −$406
- Net cashflow
- $-180
Break-even live
UW: 25.0% down · 7.5% · 30yr · 1.5% tax · 5.0% vac · 8.0% maint · 8.0% mgmt
Financing live
Cash to close
- Down payment
- $59,975
- Closing costs
- $7,197
- Reserves months
- —
- Total cash needed
- —
Loan-product check · same deal, 3 products live
Conventional
25% down · 7.5% · 30yr
- Down + closing
- —
- Monthly P&I
- —
- Monthly cashflow
- —
- DSCR
- —
- Eligible?
- —
Personal DTI + credit; lowest rate.
DSCR
20% down · 8.5% · 30yr
- Down + closing
- —
- Monthly P&I
- —
- Monthly cashflow
- —
- DSCR
- —
- Eligible?
- —
No personal income docs; deal must DSCR.
Hard money
10% down · 12.0% · 12mo
- Down + closing
- —
- Monthly P&I
- —
- Monthly cashflow
- —
- DSCR
- —
- Eligible?
- —
Short-term bridge; refi at stabilization.
Rent comps 12 comps
| Address | Beds | Baths | Sqft | Rent | $/sqft | DOM | Units | Dist |
|---|---|---|---|---|---|---|---|---|
| 185 N 90th St Milwaukee, WI | 3.0 | 1.5 | 1500 | $2,200 | $1.47 | 14d | 1 | 0.09mi |
| 9101 W Dixon St Milwaukee, WI | 2.0 | 2.0 | 1100 | $1,545 | $1.40 | 4d | 1 | 0.17mi |
| 8041 W Bluemound Rd Milwaukee, WI | 1.0–2.0 | 1.0–2.0 | 844 | $2,300 | $2.73 | 1d | 3 | 0.62mi |
| 812 S 87th St Milwaukee, WI | 2.0 | 1.0 | 979 | $1,500 | $1.53 | 3d | 1 | 0.67mi |
| 10300 W Bluemound Rd Milwaukee, WI | 1.0–2.0 | 1.0–1.5 | 771 | $2,300 | $2.98 | 1d | 3 | 0.85mi |
| 1427 S 86th St West Allis, WI | 3.0 | 1.0 | 998 | $1,399 | $1.40 | 12d | 1 | 1.15mi |
| 7135 W Bluemound Rd Unit 7135 Milwaukee, WI | 2.0 | 1.0 | 950 | $1,350 | $1.42 | 20d | 1 | 1.19mi |
| 7930 Harwood Ave Wauwatosa, WI | 1.0–2.0 | 1.0–2.0 | 1050 | $1,765 | $1.68 | 1d | 4 | 1.27mi |
| 1482 S 84th St Milwaukee, WI | 1.0–2.0 | 1.0–2.0 | 1082 | $2,500 | $2.31 | 1d | 32 | 1.28mi |
| 1461 S 98th St Unit 1491-207 Milwaukee, WI | 2.0 | 2.0 | 1200 | $1,375 | $1.15 | 3d | 1 | 1.28mi |
| 1501 S 84th St Unit 8405 Upper West Allis, WI | 2.0 | 1.0 | 950 | $1,195 | $1.26 | 3d | 1 | 1.30mi |
| 1467 S 78th St Milwaukee, WI | 2.0 | 1.0 | 1000 | $1,500 | $1.50 | 12d | 1 | 1.40mi |
Listing history 13 events
-
2026-06-08statusdays on market $239,900 Pending 37 DOM
-
2026-06-07days on market $239,900 Contingent 36 DOM
-
2026-06-05days on market $239,900 Contingent 33 DOM
-
2026-06-03days on market $239,900 Contingent 32 DOM
-
2026-06-02days on market $239,900 Contingent 31 DOM
-
2026-06-01days on market $239,900 Contingent 30 DOM
-
2026-05-31days on market $239,900 Contingent 29 DOM
-
2026-05-09historical Contingent 829-char remark
-
2026-05-02$239,900 Active 829-char remark
-
2026-04-30historical $239,900 829-char remark
-
2005-08-29soldstatus $163,900 356-char remark
Show marketing remark (356 chars)
A drive-by will whet your appetite! On this corner lot lies a 3 bedroom, 1 bath stairless ranch with 2.5 garage, mature trees, lots of storage & generous sized rooms. This home features a security system, NFP, 3 season room & is freshly painted in & out. Many updates! Home warranty included. Put on your sunglasses. .. this one sparkles!
-
1994-11-01soldstatus $95,000
-
1993-05-01soldstatus $83,900
ⓘ Source: listings_history table (triggers on properties + properties_extension) + one-shot
backfill from property_details.listing_events for pre-trigger history.
Tax reassessment forecast WI · Partial reset (capped growth)
- Current annual tax
- $4,186 · $349/mo
- Projected year-2 tax
- $4,312 · $359/mo
- Expected delta
- +$126/yr (+$11/mo · 3.0%)
ⓘ Screening estimate from a state-policy table — verify with the county assessor before closing.
Climate risk First Street
- Flood 1/10 Low FEMA zone X (unshaded) · 0% chance over 30 yrs
- Wildfire 1/10 Low
- Heat 2/10 Low 7 d/yr ≥101°F today · 13 d/yr by 30 yrs out
- Wind 2/10 Low
- Air quality 2/10 Low 1 unhealthy d/yr today · 1 by 30 yrs out
Nearby sold comps map
Loading sold comps map…
Walkable amenities ~0.75 mi
Loading nearby amenities…
Taxation est. · year 1
- Rental income
- $23,191
- − Mortgage interest
- −$13,438
- − Property taxes
- −$4,186
- − Insurance
- −$1,200
- − Repairs & maintenance
- −$1,855
- − Management
- −$1,855
- − Depreciation
- −$6,979
- Taxable loss
- −$6,322
- Est. tax savings @ 24.0%
- +$1,517
- After-tax cash flow
- $-644/yr
For passive investors: Depreciation is non-cash, so a rental often shows a tax loss while cash-flowing — sheltering income. Rental losses are passive: they offset passive income freely, and up to $25,000/yr can offset ordinary (W-2) income if you actively participate and your MAGI is under $100k (phasing out to $0 by $150k); unused losses carry forward. On sale, claimed depreciation is recaptured at up to 25%, and gains may owe capital-gains tax (a 1031 exchange can defer both). Figures are a year-1 estimate at your 24.0% rate — not tax advice; consult a CPA.
Schools (NCES district)
- District
- Milwaukee School District
- NCES district ID
- 5509600
- Math proficiency
- 10% ▼ -5.00%
- Reading proficiency
- 18% ▬ 0.00%
- Median HH income
- $36,339
- Composite
- 11.61/100
- National rank
- #9696
- State rank
- #337 of 342 in WI
Livability — Milwaukee
- Score
- 81/100
- State rank
- #55
- US rank
- #1534
Category grades
Schools grade is shown separately in the Schools card above.
Census & demographics
- Census place
- Milwaukee, WI
- County
- Milwaukee County · 926,379 people
- City population
- 573,768
- Metro
- Milwaukee-Waukesha, WI
- Population (ZIP)
- 18,908
- Household income
- $93,132
- Rent vs Own
- Severe rent burden
- 580.0
Population outlook (Milwaukee County) Hauer SSP2
- Today (2025)
- 995,758 people
- By 2030
- 1,009,124 · +1.3%
- By 2040
- 1,028,128 · +3.3%
- By 2050
- 1,040,066 · +4.4%
- By 2075
- 1,057,849 · +6.2%
- By 2100
- 1,039,774 · +4.4%
Race, ethnicity, and origin ACS 2023
- Neighborhood character
- Predominantly White (79%)
- Race & ethnicity
- White 79% Black 7% Hispanic / Latino 5% Asian 5% Two or more races 4%
- Hispanic origin (detail)
- Mexican 3%
- Common ancestry
- Romanian 10% Portuguese 4% Lithuanian 3%
- Foreign-born
- 6% · Canada, China
- Languages at home
- 92% English-only · Spanish 3% Chinese 1% Other Indo-European 1%
Political lean MEDSL · Milwaukee
- 2024 margin
- Solid D (+38.5) · D 68.3% · R 29.8% · Other 1.8%
- 2008→2024 swing
- +2.7pp toward D · 2008: 35.9pp · 2024: 38.5pp
- All cycles
- 2024: D+38.5 2020: D+39.9 2016: D+37.5 2012: D+34.6 2008: D+35.9
Not yet ingested
- Civics
- —
Market trends
- HPI YoY
- ▼ -227.28%
- Current HPI
- 253.6781
- Rent YoY
- ▲ 3.26%
- Metro
- Milwaukee-Waukesha, WI
- State GDP YoY
- ▲ 2.10%
- F500 in state
- 20
Industry mix (Fortune 500 HQ in WI)
| Industry | F500 HQs | Revenue |
|---|---|---|
| Industrial Machinery | 4 | $23B |
|
||
| Industrial Technology | 2 | $36B |
|
||
| Insurance | 1 | $36B |
|
||
| Professional Services | 1 | $19B |
|
||
| Utilities | 1 | $9B |
|
||
| Consumer Goods | 1 | $3B |
|
||
Price history
+245.6% since first listed8 events — show timeline
- 2026-06-09 Sold (MLS) $290,000 METROMLS
- 2026-06-08 Pending — METROMLS
- 2026-05-09 Contingent — METROMLS
- 2026-05-02 Listed $239,900 METROMLS
- 2026-04-30 Coming Soon $239,900 METROMLS
- 2005-08-29 Sold (MLS) $163,900 METROMLS
- 1994-11-01 Sold (Public Records) $95,000 Public Records
- 1993-05-01 Sold (Public Records) $83,900 Public Records
Property tax history
+0.2%/yrLatest (2024): $4,186 · +10.0% YoY. Source: county tax records.
Cash-flow waterfall
monthlySold comps — $/sqft
last 12 mo · ≤1 miLoading sold comps…