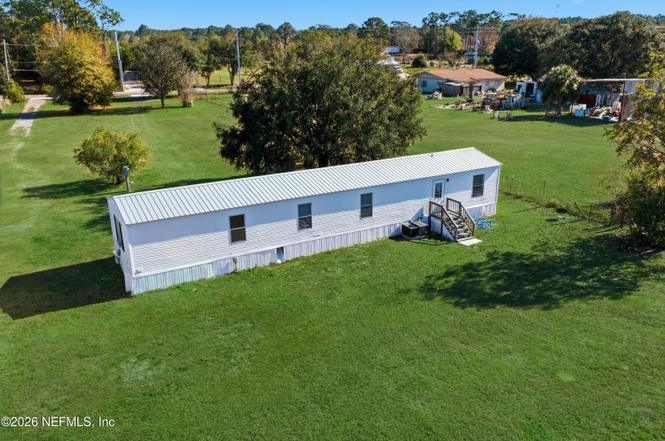
5822 Cisco Dr W · Jacksonville, FL
Flood risk 1/10 · Minimal
- FEMA flood zone
- X (unshaded)
- Chance of flooding over 30 yrs
- 0.0%
- Est. flood insurance / yr
- $507 – $1,088
Fire risk 8/10 · Major
- Est. fire insurance / yr
- $947 – $1,759
Heat risk 8/10 · Major
- Hot days now (above 108°F)
- 7 days/yr
- Hot days in 30 yrs
- 20 days/yr
Wind risk 9/10 · Severe
- Chance of severe wind over 30 yrs
- 99.0%
Air-quality risk 4/10 · Minor
- Unhealthy air days now
- 5 days/yr
- Unhealthy air days in 30 yrs
- 7 days/yr
Risk factors via First Street. Map © Google.
Why this score? — see what drove the B- grade
The composite is a weighted blend of 9 inputs, each scored 0–100. Each bar is that input's sub-score; the figure is the points it added to the 100-point composite (weight × sub-score).
- Cash flow +27.7/30.0
- DSCR +9.8/10.0
- 1% rule +7.6/10.0
- ARV discount +7.5/15.0
- Livability +4.2/5.0
- Schools +3.9/10.0
- Condition / age +2.5/5.0
- Rent growth +2.4/5.0
- Appreciation +0.0/10.0
$185,000
🖨 Deal sheet 📄 Offer letter ✓ Due diligence
Listing remarks MLS
4 bedroom 2 bath Mobile home on 2.5 acres .quiet area zoned agricultural. Live in Mobile home while you built your dream home.
Key facts
- Vinyl flooring
- Open layout
- Deck
Tags
Property features AI
Finance
- Other: Located on a private dirt road; Lot is approximately 2.41 acres; Lot features: agricultural
Exterior
- Parking: RV access/parking; Unassigned parking
- Utilities: Septic tank; Cable available; Electricity connected; Sewer connected; Water connected
- Home design: Manufactured home; One level; Property used for agricultural purposes
- Construction: Vinyl siding; Metal roof
- Exterior features: Deck; Fenced (wire)
Interior
- Kitchen: Electric cooktop; Electric oven; Electric range; Refrigerator
- Bedrooms: 4 bedrooms
- Flooring: Vinyl flooring
- Bathrooms: 2 full bathrooms
- Heating & cooling: Central heating (electric); Central air (electric)
- Interior features: Breakfast bar; Open floor plan; Primary bathroom with tub and separate shower; Primary bedroom located downstairs; Split bedroom layout
- Laundry & utility: Washer hookup; Gas dryer hookup; Electric water heater
Neighborhood map
What this means for you Summary
Snapshot
- This is a 4-bed/2.0-bath manufactured listed at $185k.
Deal economics
- At list price, monthly cash flow is $560 ($7k/yr) — positive.
- The deal already cash-flows at list — no discount required.
- Meets the 1% rule at list price ($2k rent vs $185k).
- Recommended offer: $163k (12.0% below list) — sets the bar for market timing.
- Cap rate 9.9% vs local median 4.0% in Jacksonville — top-decile yield for the area; either an underpriced asset or a hidden risk that comps aren't pricing in. Stress-test before assuming the spread holds.
Location & tenants
- Location reads 83/100 on livability (#50 in FL, #911 nationally) — a professional / high-income tenant draw. Strengths: amenities A+, commute A+, housing A+.
- Duval (urban): math 46% / reading 45% proficiency, ranked #48 of 73 in FL (top 66%) — families likely to look elsewhere, expect single-tenant / working-renter base with shorter leases.
- Market conditions: Rents soft (-0.2%/yr); 546 active listings in the ZIP; 2 comparable units currently listed for rent nearby; 6,503 units permitted in Duval County in 2024 (1,131 in 5+ unit buildings).
- This rent runs 39% of the median local income ($72k/yr) — at the standard rent-burdened threshold; future hikes will face affordability resistance.
Forward outlook
- Local home prices are declining (-3.0%/yr); year-one equity from $1k of loan paydown is wiped out by about $6k of value loss. Plan a longer hold.
- Duval County population projected at +19% by 2050 — long-run rental-demand tailwind backs the buy-and-hold thesis.
Negotiation context
- It's been on market 161 days — a 12% lower offer ($163k) is reasonable based on typical stale-listing flexibility.
- 3 sale attempts since 22y ago; this cycle's ask has dropped $40k (18%) from the opening price — seller is motivated, your offer sets the floor, not the list.
Risks & watch-outs
- Climate carrying-cost: severe wind risk, 99% chance of damaging wind over 30y; severe wildfire risk; extreme-heat days projected 7→20/yr by 2055 (HVAC capex compounding) — expect insurance premiums to compound above CPI over the hold.
Questions for the listing agent
- It's been on market 161 days. Have you received any prior offers? Is the seller open to a 12% concession, seller financing, or rate buy-down credit?
- Why hasn't it sold? Are there any deal-killer items the seller is aware of (foundation, flood, title, zoning, code violations)?
- Is there a deadline driving the sale (1031 exchange, divorce, estate, relocation)? That informs how much negotiation room exists.
- Schools are B-rated — typically a magnet for longer-tenancy family renters. What's the average tenant stay here, and is there a school-zone premium baked into asking?
- What's the average days-on-market for RENTAL listings here right now (not sales)? A rising rental-DOM trend means longer vacancies and softer asking-rent achievability than the comps imply.
- What's the recent tenant-quality profile in this submarket — average credit score on applications, eviction rate, late-payment / NSF rate, and stable-employment percentage? A property-management company in the area should have these aggregated.
- How much new for-sale + rental construction is in the pipeline within 1–3 miles? Heavy new supply typically softens prices + rents 12–24 months out; constrained supply supports both.
Investment metrics
- 1% rule
- 1.26% ✓
- Cap rate
- 9.92%
- Cash-on-cash
- 12.97%
- DSCR
- 1.58
- GRM
- 6.6
CMA / ARV
No comps found within radius.
Projected returns pro-forma
-3.0% appreciation · 0.0% rent growth · sell at horizon
- IRR
- -0.6%
- Equity multiple
- 0.98×
- Total profit
- $-1,104
- Equity at exit
- $27,584
- IRR
- 5.6%
- Equity multiple
- 1.36×
- Total profit
- $18,743
- Equity at exit
- $15,995
Cash invested: $51,800 (down + closing). Projections, not guarantees.
Landlord ↔ Tenant lean methodology
- Overall (STATE)
- 87 Strongly Landlord-Friendly
- State Florida
- 87 Strongly Landlord-Friendly · R+3
- County
- — inherits STATE
- City
- — inherits STATE
ZIP-level market 32219
- Home prices YoY
- -22.3%
- Rents YoY
- -0.2%
- Active inventory
- 546
- Price-to-rent
- 6.6×
Monthly cashflow live
- Estimated rent
- $2,327 medium interval (Pro) →
- Mortgage (P&I)
- −$970
- Tax est. 1.5%
- −$231 /mo · $2,775/yr
- Insurance
- −$77
- HOA
- −$0
- Vacancy / Maint / Mgmt
- −$489
- Net cashflow
- $560
Break-even live
UW: 25.0% down · 7.5% · 30yr · 1.5% tax · 5.0% vac · 8.0% maint · 8.0% mgmt
Financing live
Cash to close
- Down payment
- $46,250
- Closing costs
- $5,550
- Reserves months
- —
- Total cash needed
- —
Loan-product check · same deal, 3 products live
Conventional
25% down · 7.5% · 30yr
- Down + closing
- —
- Monthly P&I
- —
- Monthly cashflow
- —
- DSCR
- —
- Eligible?
- —
Personal DTI + credit; lowest rate.
DSCR
20% down · 8.5% · 30yr
- Down + closing
- —
- Monthly P&I
- —
- Monthly cashflow
- —
- DSCR
- —
- Eligible?
- —
No personal income docs; deal must DSCR.
Hard money
10% down · 12.0% · 12mo
- Down + closing
- —
- Monthly P&I
- —
- Monthly cashflow
- —
- DSCR
- —
- Eligible?
- —
Short-term bridge; refi at stabilization.
Rent comps 2 comps
| Address | Beds | Baths | Sqft | Rent | $/sqft | DOM | Units | Dist |
|---|---|---|---|---|---|---|---|---|
| 5441 Hollow Birch Dr Jacksonville, FL | 4.0 | 2.0 | 1490 | $2,125 | $1.43 | 1d | 1 | 0.28mi |
| 5735 Wandering Trl Jacksonville, FL | 3.0 | 2.0 | 1407 | $1,500 | $1.07 | 4d | 1 | 0.44mi |
Listing history 23 events
-
2026-06-18days on market $185,000 Active 161 DOM
-
2026-06-17days on market $185,000 Active 160 DOM
-
2026-06-16days on market $185,000 Active 159 DOM
-
2026-06-15days on market $185,000 Active 158 DOM
-
2026-06-10pricedays on market $185,000 Active 152 DOM
-
2026-06-08days on market $199,900 Active 151 DOM
-
2026-06-08days on market $199,900 Active 150 DOM
-
2026-06-03days on market $199,900 Active 146 DOM
-
2026-06-02days on market $199,900 Active 145 DOM
-
2026-06-01days on market $199,900 Active 144 DOM
-
2026-05-31days on market $199,900 Active 143 DOM
-
2026-03-04price $199,900
-
2026-01-22price $215,000
-
2026-01-06$225,000 Active
-
2024-02-05historical 126-char remark
Show marketing remark (126 chars)
4 bedroom 2 bath Mobile home on 2.5 acres .quiet area zoned agricultural. Live in Mobile home while you built your dream home.
-
2024-01-25soldstatus $211,500
-
2024-01-09soldstatus $211,500 Closed 126-char remark
Show marketing remark (126 chars)
4 bedroom 2 bath Mobile home on 2.5 acres .quiet area zoned agricultural. Live in Mobile home while you built your dream home.
-
2023-10-25status Pending 126-char remark
Show marketing remark (126 chars)
4 bedroom 2 bath Mobile home on 2.5 acres .quiet area zoned agricultural. Live in Mobile home while you built your dream home.
-
2023-10-10$225,500 Active 126-char remark
Show marketing remark (126 chars)
4 bedroom 2 bath Mobile home on 2.5 acres .quiet area zoned agricultural. Live in Mobile home while you built your dream home.
-
2018-01-16soldstatus $85,000
-
2005-08-30soldstatus $126,000
-
2005-08-05soldstatus $126,000 98-char remark
Show marketing remark (98 chars)
FIVE BEDROOM, THREE FULL BATH MOBILE HOME ON 2.5 ACRES, ZONED FOR HORSES. FENCED AND CROSS FENCED.
-
2004-11-30$126,000 98-char remark
Show marketing remark (98 chars)
FIVE BEDROOM, THREE FULL BATH MOBILE HOME ON 2.5 ACRES, ZONED FOR HORSES. FENCED AND CROSS FENCED.
ⓘ Source: listings_history table (triggers on properties + properties_extension) + one-shot
backfill from property_details.listing_events for pre-trigger history.
Climate risk First Street
- Flood 1/10 Low FEMA zone X (unshaded) · 0% chance over 30 yrs
- Wildfire 8/10 Severe
- Heat 8/10 Severe 7 d/yr ≥108°F today · 20 d/yr by 30 yrs out
- Wind 9/10 Extreme 99% chance of damaging wind over 30 yrs
- Air quality 4/10 Moderate 5 unhealthy d/yr today · 7 by 30 yrs out
Nearby sold comps map
Loading sold comps map…
Walkable amenities ~0.75 mi
Loading nearby amenities…
Taxation est. · year 1
- Rental income
- $27,925
- − Mortgage interest
- −$10,363
- − Property taxes
- −$2,775
- − Insurance
- −$925
- − Repairs & maintenance
- −$2,234
- − Management
- −$2,234
- − Depreciation
- −$5,382
- Taxable income
- $4,012
- Est. tax owed @ 24.0%
- −$963
- After-tax cash flow
- $5,756/yr
For passive investors: Depreciation is non-cash, so a rental often shows a tax loss while cash-flowing — sheltering income. Rental losses are passive: they offset passive income freely, and up to $25,000/yr can offset ordinary (W-2) income if you actively participate and your MAGI is under $100k (phasing out to $0 by $150k); unused losses carry forward. On sale, claimed depreciation is recaptured at up to 25%, and gains may owe capital-gains tax (a 1031 exchange can defer both). Figures are a year-1 estimate at your 24.0% rate — not tax advice; consult a CPA.
Schools (NCES district)
- District
- Duval
- NCES district ID
- 1200480
- Math proficiency
- 46% ▼ -11.00%
- Reading proficiency
- 45% ▼ -4.00%
- Median HH income
- $48,987
- Composite
- 38.97/100
- National rank
- #4076
- State rank
- #48 of 73 in FL
Livability — Jacksonville
- Score
- 83/100
- State rank
- #50
- US rank
- #911
Category grades
Schools grade is shown separately in the Schools card above.
Census & demographics
- Census place
- Jacksonville, FL
- County
- Duval County · 1,015,274 people
- City population
- 979,034
- Metro
- Jacksonville, FL
- Population (ZIP)
- 14,302
- Household income
- $72,184
- Rent vs Own
- Severe rent burden
- 173.0
Population outlook (Duval County) Hauer SSP2
- Today (2025)
- 1,013,010 people
- By 2030
- 1,059,228 · +4.6%
- By 2040
- 1,141,439 · +12.7%
- By 2050
- 1,205,258 · +19.0%
- By 2075
- 1,324,282 · +30.7%
- By 2100
- 1,319,620 · +30.3%
Race, ethnicity, and origin ACS 2023
- Neighborhood character
- Majority Black (55%)
- Race & ethnicity
- Black 55% White 39% Hispanic / Latino 4% Two or more races 3%
- Common ancestry
- Italian 2% Romanian 1% Hispanic 1%
- Foreign-born
- 4% · Canada, Jamaica
- Languages at home
- 95% English-only · Spanish 3% French/Haitian/Cajun 0%
Political lean MEDSL · Duval
- 2024 margin
- Toss-up / Even · D 48.7% · R 50.1% · Other 1.2%
- 2008→2024 swing
- +0.4pp no change · 2008: -1.9pp · 2024: -1.5pp
- All cycles
- 2024: R+1.5 2020: D+3.8 2016: R+1.5 2012: R+3.6 2008: R+1.9
Not yet ingested
- Civics
- —
Market trends
- HPI YoY
- ▼ -75.90%
- Current HPI
- 263.8901
- Rent YoY
- ▼ -0.25%
- Metro
- Jacksonville, FL
- State GDP YoY
- ▲ 3.28%
- F500 in state
- 36
Industry mix (Fortune 500 HQ in FL)
| Industry | F500 HQs | Revenue |
|---|---|---|
| Industrial Technology | 2 | $29B |
|
||
| Insurance | 2 | $17B |
|
||
| Retail | 1 | $60B |
|
||
| Technology Distribution | 1 | $58B |
|
||
| Homebuilding | 1 | $35B |
|
||
| Technology Manufacturing | 1 | $35B |
|
||
Price history
+58.7% since first listed12 events — show timeline
- 2026-03-04 Price Changed $199,900 realMLS
- 2026-01-22 Price Changed $215,000 realMLS
- 2026-01-06 Listed $225,000 realMLS
- 2024-02-05 Listing Removed — realMLS
- 2024-01-25 Sold (Public Records) $211,500 Public Records
- 2024-01-09 Sold (MLS) $211,500 realMLS
- 2023-10-25 Pending — realMLS
- 2023-10-10 Listed $225,500 realMLS
- 2018-01-16 Sold (Public Records) $85,000 Public Records
- 2005-08-30 Sold (Public Records) $126,000 Public Records
- 2005-08-05 Sold (MLS) $126,000 realMLS
- 2004-11-30 Listed $126,000 realMLS
Property tax history
-13.4%/yrLatest (2025): $343 · -50.2% YoY. Source: county tax records.
Cash-flow waterfall
monthlySold comps — $/sqft
last 12 mo · ≤1 miLoading sold comps…