 Fourplex
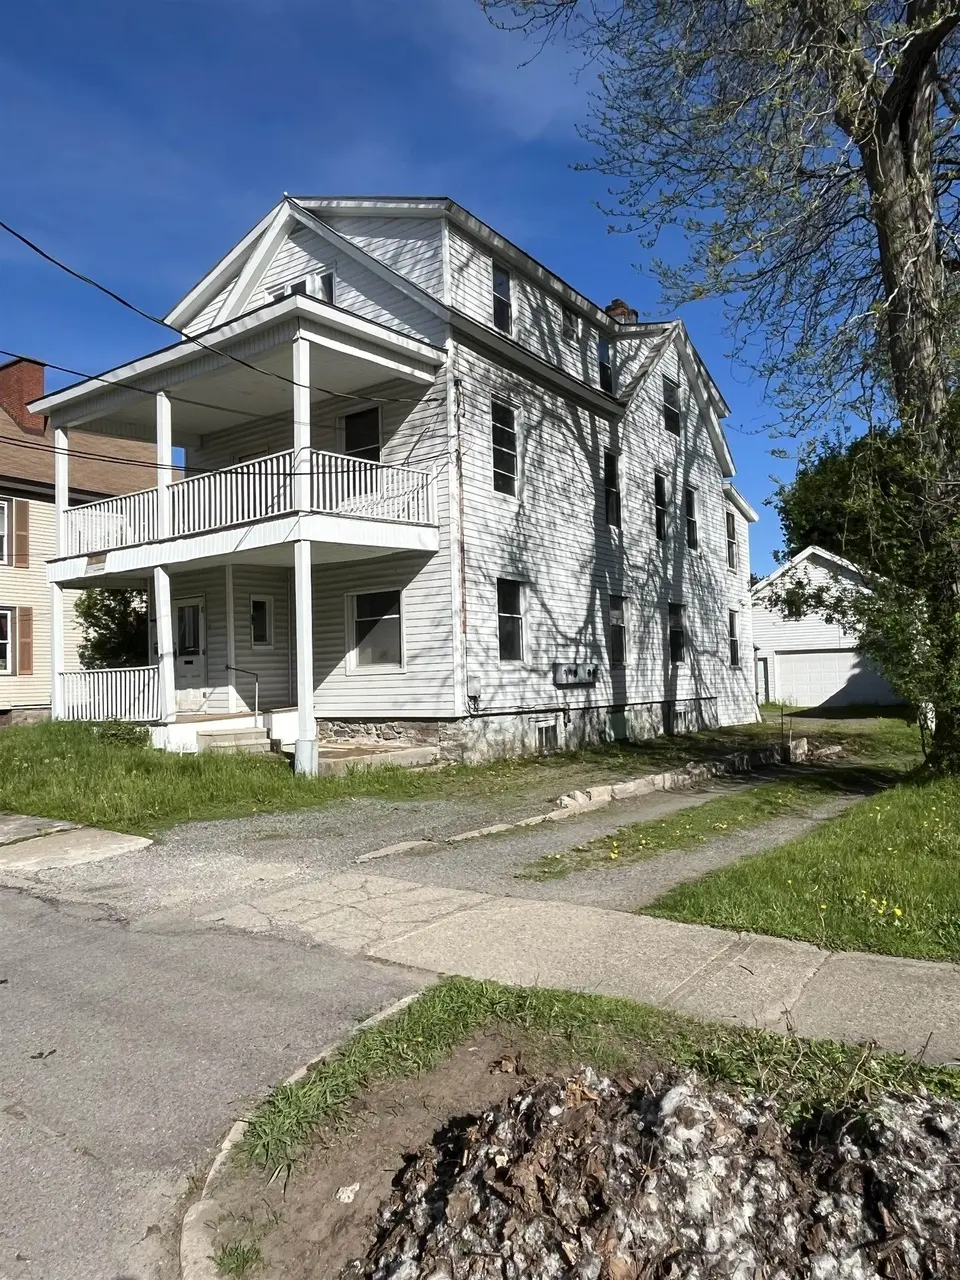
410 Knox St · Ogdensburg, NY
Flood risk 1/10 · Minimal
- FEMA flood zone
- X
- Chance of flooding over 30 yrs
- 0.0%
- Est. flood insurance / yr
- $473 – $860
Fire risk 1/10 · Minimal
- Est. fire insurance / yr
- $691 – $1,283
Heat risk 2/10 · Minimal
- Hot days now (above 94°F)
- 7 days/yr
- Hot days in 30 yrs
- 15 days/yr
Wind risk 1/10 · Minimal
- Chance of severe wind over 30 yrs
- —
Air-quality risk 2/10 · Minimal
- Unhealthy air days now
- 1 days/yr
- Unhealthy air days in 30 yrs
- 1 days/yr
Risk factors via First Street. Map © Google.
Why this score? — see what drove the D+ grade
The composite is a weighted blend of 9 inputs, each scored 0–100. Each bar is that input's sub-score; the figure is the points it added to the 100-point composite (weight × sub-score).
- Cash flow +15.0/30.0
- ARV discount +7.5/15.0
- Appreciation +5.5/10.0
- 1% rule +5.0/10.0
- DSCR +5.0/10.0
- Schools +3.3/10.0
- Livability +3.3/5.0
- Rent growth +2.5/5.0
- Condition / age +2.5/5.0
$70,000
🖨 Deal sheet 📄 Offer letter ✓ Due diligence
Multi-family units
County records classify this as Multi-Family (5+ Unit). Listing-text estimate: 4 units. estimate disagrees with records
5+ unit building — per-unit beds/baths from public records are typically unavailable; the breakdown below (if shown) is an estimate from the listing text.
Listing remarks
Five-unit apartment building in search for a new owner that has the time to put some TLC into it and bring it back to its former beauty. Great income opportunity for someone willing to put the time and effort into it. Most all windows are updated, vinyl siding, metal roof, two car garage and ample parking. Nice quiet neighborhood within walking distance of recreation, stores, churches and the Seaway Trail. Fix up one apartment and live in it while you plug away at the rest.
Key facts
- Metal roof
- Updated windows
- Ample parking
Tags
Property features AI
Finance
- Other: Directions: From State Street turn onto Knox Street by the post office.
- Financial info: Annual tax information available
Exterior
- Parking: Detached 2-car garage
- Utilities: Public water; Public sewer
- Home design: Multi-family residential income property; Three-story building
- Construction: Vinyl siding
- Exterior features: Metal roof; Lot roughly 56 x 130
Interior
- Bathrooms: Five full bathrooms
- Interior features: Laundry is located in the basement
- Laundry & utility: Basement laundry
Neighborhood map
What this means for you Summary
Snapshot
- This is a 4 × 3-bed/?-bath units multifamily listed at $70k.
Deal economics
- At list price, monthly cash flow is $3k ($41k/yr) — positive. Per door: $855/mo.
- The deal already cash-flows at list — no discount required.
- Meets the 1% rule at list price ($5k rent vs $70k).
- Recommended offer: $69k (1.5% below list) — sets the bar for market timing.
- Cap rate 64.9% vs local median 5.3% in Ogdensburg — top-decile yield for the area; either an underpriced asset or a hidden risk that comps aren't pricing in. Stress-test before assuming the spread holds.
Location & tenants
- Location reads 66/100 on livability (#624 in NY) — a middle-class / working-renter tenant base. Strengths: cost of living A+, housing A+, health & safety A+; Watch: employment D+, schools D-, crime F.
- Ogdensburg City School District (town): math 34% / reading 46% proficiency, ranked #531 of 590 in NY (top 90%) — families likely to look elsewhere, expect single-tenant / working-renter base with shorter leases.
- Market conditions: 127 active listings in the ZIP; 215 units permitted in St. Lawrence County in 2024 (0 in 5+ unit buildings).
Forward outlook
- In year one you build about $1k of equity ($484 loan paydown + $747 appreciation (1.1% local appreciation)).
- St. Lawrence County population projected at -14% by 2050 — secular population decline; favor cash flow + early exit over multi-decade hold.
- At projected returns (1.1% appreciation + 3.0% rent growth), your $20k cash investment doubles in ~1 year — after that, you're playing with house money.
Negotiation context
- It's been on market 28 days — a 2% lower offer ($69k) is reasonable based on typical stale-listing flexibility.
- 7 sale attempts since 6y ago with the ask held roughly flat each time — persistent listings suggest the price (not the market) is what's stuck; bring a comps-based counter.
Questions for the listing agent
- Can we see the unit-by-unit rent roll, current vacancy, and any below-market leases? What's the average tenancy length?
- What capital expenditures (roof, boiler, parking lot, exteriors) have been made in the last 5 years, and what's planned in the next 2?
- Built in 1960 — when were the roof, HVAC, electrical panel, plumbing, and water heater last replaced?
- Is there a deadline driving the sale (1031 exchange, divorce, estate, relocation)? That informs how much negotiation room exists.
- Schools are D-rated, which usually means shorter tenancies and higher turnover. Who's the typical renter profile here, and what's been the actual vacancy rate?
- Crime grade is F in this area — have there been break-ins, vandalism, or insurance claims at this property in the last 3 years? What carrier currently insures it and at what premium?
- The area grade is low — what's the realistic commute time and amenity access for the typical tenant pool here? Any planned neighborhood developments (good or bad) we should know about?
- What's the average days-on-market for RENTAL listings here right now (not sales)? A rising rental-DOM trend means longer vacancies and softer asking-rent achievability than the comps imply.
- What's the recent tenant-quality profile in this submarket — average credit score on applications, eviction rate, late-payment / NSF rate, and stable-employment percentage? A property-management company in the area should have these aggregated.
- How much new apartment / multifamily construction is in the pipeline within 1–3 miles? Heavy new supply (>2% of stock underway) typically softens rents 12–24 months out; light construction supports rent growth.
Investment metrics
- 1% rule
- 7.06% ✓
- Cap rate
- 64.89%
- Cash-on-cash
- 209.27%
- DSCR
- 10.31
- GRM
- 1.2
CMA / ARV
No comps found within radius.
Projected returns pro-forma
1.07% appreciation · 3.0% rent growth · sell at horizon
- IRR
- —
- Equity multiple
- 12.19×
- Total profit
- $219,312
- Equity at exit
- $24,142
- IRR
- —
- Equity multiple
- 25.75×
- Total profit
- $485,026
- Equity at exit
- $32,273
Cash invested: $19,600 (down + closing). Projections, not guarantees.
Landlord ↔ Tenant lean methodology
- Overall (STATE)
- 15 Strongly Tenant-Friendly
- State New York
- 15 Strongly Tenant-Friendly · D+10
- County
- — inherits STATE
- City
- — inherits STATE
ZIP-level market 13669
- Home prices YoY
- 0.4%
- Active inventory
- 127
- Price-to-rent
- 4.7×
Monthly cashflow live
- Estimated rent
- $4,939 medium interval (Pro) →
- Mortgage (P&I)
- −$367
- Tax est. 1.5%
- −$88 /mo · $1,050/yr
- Insurance
- −$29
- HOA
- −$0
- Vacancy / Maint / Mgmt
- −$1,037
- Net cashflow
- $3,418
Break-even live
4-unit breakdown (identical units grouped — click to expand)
| Units | Beds | Baths | Est. rent |
|---|---|---|---|
| 4× units | 3 | — | $4,940 |
| #1 | 3 | — | $1,235 |
| #2 | 3 | — | $1,235 |
| #3 | 3 | — | $1,235 |
| #4 | 3 | — | $1,235 |
| Total (4 units) | $4,939 | ||
UW: 25.0% down · 7.5% · 30yr · 1.5% tax · 5.0% vac · 8.0% maint · 8.0% mgmt
Financing live
Cash to close
- Down payment
- $17,500
- Closing costs
- $2,100
- Reserves months
- —
- Total cash needed
- —
Loan-product check · same deal, 3 products live
Conventional
25% down · 7.5% · 30yr
- Down + closing
- —
- Monthly P&I
- —
- Monthly cashflow
- —
- DSCR
- —
- Eligible?
- —
Personal DTI + credit; lowest rate.
DSCR
20% down · 8.5% · 30yr
- Down + closing
- —
- Monthly P&I
- —
- Monthly cashflow
- —
- DSCR
- —
- Eligible?
- —
No personal income docs; deal must DSCR.
Hard money
10% down · 12.0% · 12mo
- Down + closing
- —
- Monthly P&I
- —
- Monthly cashflow
- —
- DSCR
- —
- Eligible?
- —
Short-term bridge; refi at stabilization.
Listing history 29 events
-
2026-06-18days on market $70,000 Active 28 DOM
-
2026-06-17days on market $70,000 Active 27 DOM
-
2026-06-16days on market $70,000 Active 26 DOM
-
2026-06-15days on market $70,000 Active 25 DOM
-
2026-06-13days on market $70,000 Active 23 DOM
-
2026-06-12days on market $70,000 Active 22 DOM
-
2026-06-09days on market $70,000 Active 19 DOM
-
2026-06-08days on market $70,000 Active 18 DOM
-
2026-06-07days on market $70,000 Active 17 DOM
-
2026-06-07days on market $70,000 Active 16 DOM
-
2026-06-04days on market $70,000 Active 13 DOM
-
2026-06-02days on market $70,000 Active 12 DOM
-
2026-06-01days on market $70,000 Active 11 DOM
-
2026-05-31days on market $70,000 Active 10 DOM
-
2026-05-20$70,000 Active
-
2024-12-20price $50,000
-
2024-10-09status Active
-
2024-08-13status Active
-
2024-08-13price $89,900
-
2024-07-10status Pending
-
2024-06-07status Active
-
2024-06-07price $99,900
-
2024-02-13status Active
-
2024-01-04status Pending
-
2023-10-30status Active
-
2023-10-30price $119,900
-
2023-08-25historical
-
2020-07-13$125,000 Active
-
2012-08-08soldstatus $200,000
ⓘ Source: listings_history table (triggers on properties + properties_extension) + one-shot
backfill from property_details.listing_events for pre-trigger history.
Climate risk First Street
- Flood 1/10 Low FEMA zone X · 0% chance over 30 yrs
- Wildfire 1/10 Low
- Heat 2/10 Low 7 d/yr ≥94°F today · 15 d/yr by 30 yrs out
- Wind 1/10 Low
- Air quality 2/10 Low 1 unhealthy d/yr today · 1 by 30 yrs out
Nearby sold comps map
Loading sold comps map…
Walkable amenities ~0.75 mi
Loading nearby amenities…
Taxation est. · year 1
- Rental income
- $59,268
- − Mortgage interest
- −$3,921
- − Property taxes
- −$1,050
- − Insurance
- −$350
- − Repairs & maintenance
- −$4,741
- − Management
- −$4,741
- − Depreciation
- −$2,036
- Taxable income
- $42,428
- Est. tax owed @ 24.0%
- −$10,183
- After-tax cash flow
- $30,834/yr
For passive investors: Depreciation is non-cash, so a rental often shows a tax loss while cash-flowing — sheltering income. Rental losses are passive: they offset passive income freely, and up to $25,000/yr can offset ordinary (W-2) income if you actively participate and your MAGI is under $100k (phasing out to $0 by $150k); unused losses carry forward. On sale, claimed depreciation is recaptured at up to 25%, and gains may owe capital-gains tax (a 1031 exchange can defer both). Figures are a year-1 estimate at your 24.0% rate — not tax advice; consult a CPA.
Schools (NCES district)
- District
- Ogdensburg City School District
- NCES district ID
- 3621660
- Math proficiency
- 34% ▼ -15.00%
- Reading proficiency
- 46% ▲ 6.00%
- Median HH income
- $38,253
- Composite
- 33.33/100
- National rank
- #5497
- State rank
- #531 of 590 in NY
Livability — Ogdensburg
- Score
- 66/100
- State rank
- #624
- US rank
- #11365
Category grades
Schools grade is shown separately in the Schools card above.
Census & demographics
- Census place
- Ogdensburg, NY
- Population (ZIP)
- 15,615
Population outlook (St. Lawrence County) Hauer SSP2
- Today (2025)
- 110,027 people
- By 2030
- 107,455 · -2.3%
- By 2040
- 100,492 · -8.7%
- By 2050
- 94,254 · -14.3%
- By 2075
- 80,175 · -27.1%
- By 2100
- 63,140 · -42.6%
Race, ethnicity, and origin ACS 2023
- Neighborhood character
- Predominantly White (91%)
- Race & ethnicity
- White 91% Black 4% Two or more races 3% Hispanic / Latino 2%
- Common ancestry
- Lithuanian 10% Polish 6% Slovak 3%
- Foreign-born
- 3% · Canada, China, Jamaica
- Languages at home
- 89% English-only · German/W. Germanic 9% Spanish 1%
Political lean MEDSL · St. Lawrence
- 2024 margin
- R (+18.0) · D 41.0% · R 59.0%
- 2008→2024 swing
- -34.3pp toward R · 2008: 16.3pp · 2024: -18.0pp
- All cycles
- 2024: R+18.0 2020: R+11.7 2016: R+10.8 2012: D+16.6 2008: D+16.3
Not yet ingested
- Civics
- —
Market trends
- HPI YoY
- ▲ 1.07%
- Current HPI
- 264.0261
- Rent YoY
- —
- Metro
- —
- State GDP YoY
- ▲ 2.60%
- F500 in state
- 92
Industry mix (Fortune 500 HQ in NY)
| Industry | F500 HQs | Revenue |
|---|---|---|
| Financial Services | 10 | $950B |
|
||
| Consumer Goods | 9 | $162B |
|
||
| Insurance | 4 | $225B |
|
||
| Telecommunications | 2 | $144B |
|
||
| Pharmaceuticals | 2 | $112B |
|
||
| Media / Entertainment | 2 | $69B |
|
||
Price history
-65.0% since first listed15 events — show timeline
- 2026-05-20 Listed $70,000 SLCMLS
- 2024-12-20 Price Changed $50,000 SLCMLS
- 2024-10-09 Relisted — SLCMLS
- 2024-08-13 Relisted — SLCMLS
- 2024-08-13 Price Changed $89,900 SLCMLS
- 2024-07-10 Pending — SLCMLS
- 2024-06-07 Relisted — SLCMLS
- 2024-06-07 Price Changed $99,900 SLCMLS
- 2024-02-13 Relisted — SLCMLS
- 2024-01-04 Pending — SLCMLS
- 2023-10-30 Relisted — SLCMLS
- 2023-10-30 Price Changed $119,900 SLCMLS
- 2023-08-25 Delisted — SLCMLS
- 2020-07-13 Listed $125,000 SLCMLS
- 2012-08-08 Sold (Public Records) $200,000 Public Records
Property tax history
+8.1%/yrLatest (2025): $5,565 · +0.7% YoY. Source: county tax records.
Cash-flow waterfall
monthlySold comps — $/sqft
last 12 mo · ≤1 miLoading sold comps…