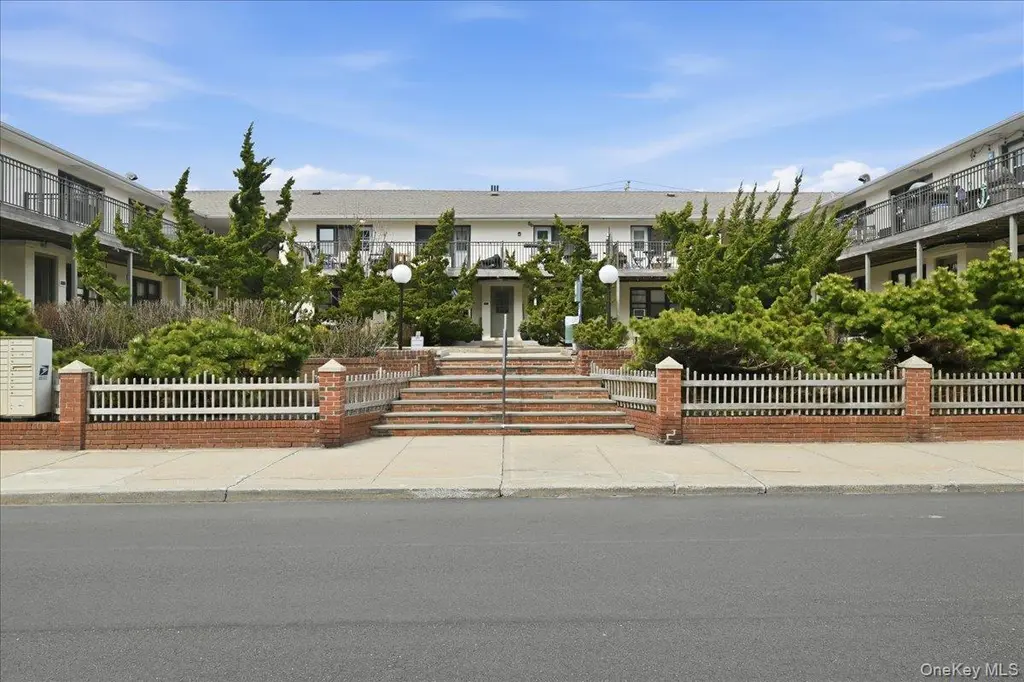
65 W Broadway Unit 8B · Long Beach, NY
Flood risk 6/10 · Moderate
- FEMA flood zone
- AE
- Chance of flooding over 30 yrs
- 0.57%
- Est. flood insurance / yr
- $2,026 – $9,024
Fire risk 1/10 · Minimal
- Est. fire insurance / yr
- $691 – $1,283
Heat risk 6/10 · Moderate
- Hot days now (above 95°F)
- 7 days/yr
- Hot days in 30 yrs
- 16 days/yr
Wind risk 8/10 · Major
- Chance of severe wind over 30 yrs
- 80.0%
Air-quality risk 4/10 · Minor
- Unhealthy air days now
- 4 days/yr
- Unhealthy air days in 30 yrs
- 6 days/yr
Risk factors via First Street. Map © Google.
Why this score? — see what drove the F grade
The composite is a weighted blend of 9 inputs, each scored 0–100. Each bar is that input's sub-score; the figure is the points it added to the 100-point composite (weight × sub-score).
- ARV discount +7.5/15.0
- Schools +5.9/10.0
- Cash flow +5.0/30.0
- 1% rule +4.8/10.0
- Livability +4.1/5.0
- Rent growth +3.7/5.0
- Condition / age +2.5/5.0
- DSCR +0.0/10.0
- Appreciation +0.0/10.0
$365,000
🖨 Deal sheet (PDF) 📄 Offer letter ✓ Due diligence
Listing remarks MLS
This bright and renovated unit is your next beach escape! Featuring a studio converted to a one bedroom, with the largest balcony in Seaview Gardens! Including a modern kitchen with stainless steel appliances & wine fridge, cozy living room, one bedroom with built in electric FP, and an updated bathroom. Right across the street from the Beach and move in ready condition!! Close to LIRR, Shops, Restaurants & more!
Key facts
- Built 1953
- Listed 27 days
Property features AI
Exterior
- Parking: On-street parking
- Utilities: Public sewer; Electricity connected; Natural gas connected; Water connected
- Home design: Stock cooperative
- Construction: Brick construction
- Exterior features: Brick construction; Not waterfront
Interior
- Kitchen: Gas range; Refrigerator
- Bedrooms: Total rooms: 3; Entry level: 2
- Bathrooms: 1 full bathroom
- Heating & cooling: Natural gas heating; Wall/window air conditioning units
- Interior features: Open kitchen; No basement; One-level layout; Pets allowed
- Laundry & utility: Electric water heater
Neighborhood map
What this means for you Summary
Snapshot
- This is a 1-bed/1.0-bath condo listed at $365k.
Deal economics
- At list price, monthly cash flow is $-1k ($-16k/yr) — negative.
- To cash-flow at today's rent, offer at most $341k (6.6% below list).
- To meet the 1% rule (rent ≥ 1% of price), the offer needs to be $357k (2.3% below list).
- Recommended offer: $341k (6.6% below list) — sets the bar for cash-flow.
- Cap rate 3.4% vs local median 2.1% in Long Beach — top-decile yield for the area; either an underpriced asset or a hidden risk that comps aren't pricing in. Stress-test before assuming the spread holds.
Location & tenants
- Location reads 82/100 on livability (#84 in NY, #1,285 nationally) — a professional / high-income tenant draw. Strengths: crime A+, commute A+, employment A+; Watch: cost of living F.
- Long Beach City School District (suburban): math 66% / reading 65% proficiency, ranked #150 of 590 in NY (top 25%) — acceptable for families but not a draw, mixed tenant base, ~2y average lease.
- Zoned schools: Lindell Boulevard School (math 72% / reading 72%, grade A-, #378 of 2,108 statewide, top 20%, 372 students, 21% FRL); Long Beach Middle School (math 39% / reading 61%, grade C, #261 of 729 statewide, top 36%, 721 students, 25% FRL); Long Beach High School (math 91% / reading 75%, grade A, #440 of 1,100 statewide, top 40%, 1,314 students, 31% FRL) — zoned schools at 26% FRL track the district average.
- Market conditions: Rents rising fast (+4.8%/yr); 353 active listings in the ZIP; 26 comparable units currently listed for rent nearby; rentals lingering (median 46d on market — plan ~5-8 weeks vacancy on turnover, expect pricing pressure); 54% of comp listings sitting > 30 days — soft ceiling on asking rent; high-income renter base; 824 units permitted in Nassau County in 2024 (153 in 5+ unit buildings).
- This rent runs 30% of the median local income ($142k/yr) — at the standard rent-burdened threshold; future hikes will face affordability resistance.
Forward outlook
- Local home prices are declining (-3.0%/yr); year-one equity from $3k of loan paydown is wiped out by about $11k of value loss. Plan a longer hold.
- Nassau County population projected at +7% by 2050 — modest demand growth; plan on rents tracking national, not racing it.
Negotiation context
- It's been on market 27 days — a 2% lower offer ($360k) is reasonable based on typical stale-listing flexibility.
- 4 sale attempts since 13y ago with the ask held roughly flat each time — persistent listings suggest the price (not the market) is what's stuck; bring a comps-based counter.
Risks & watch-outs
- Watch-outs: flood insurance adds $460/mo; HOA is 33% of rent; built in 1953 — expect roof / HVAC / electrical / plumbing capex.
- Climate carrying-cost: in FEMA flood zone AE (mandatory federal flood insurance); severe wind risk, 80% chance of damaging wind over 30y; extreme-heat days projected 7→16/yr by 2055 (HVAC capex compounding) — expect insurance premiums to compound above CPI over the hold.
Questions for the listing agent
- What do current leases actually rent for vs. the listed asking? Can we see a recent rent roll and the last 12 months of T-12 income?
- Built in 1953 — when were the roof, HVAC, electrical panel, plumbing, and water heater last replaced?
- What's the actual annual flood-insurance premium (NFIP or private), and is the property in a SFHA with mandatory coverage?
- What does the HOA fee cover, when was the last increase, and are there any pending special assessments or reserve-fund shortfalls?
- Any open or pending special assessments — roof, HVAC, plumbing, elevator, façade? What's the per-unit balance and payoff schedule, and is the seller paying it off at close or rolling it to the buyer?
- Is there a deadline driving the sale (1031 exchange, divorce, estate, relocation)? That informs how much negotiation room exists.
- Schools are A-rated — typically a magnet for longer-tenancy family renters. What's the average tenant stay here, and is there a school-zone premium baked into asking?
- The area grade is low — what's the realistic commute time and amenity access for the typical tenant pool here? Any planned neighborhood developments (good or bad) we should know about?
- What's the average days-on-market for RENTAL listings here right now (not sales)? A rising rental-DOM trend means longer vacancies and softer asking-rent achievability than the comps imply.
- What's the recent tenant-quality profile in this submarket — average credit score on applications, eviction rate, late-payment / NSF rate, and stable-employment percentage? A property-management company in the area should have these aggregated.
- How much new apartment / multifamily construction is in the pipeline within 1–3 miles? Heavy new supply (>2% of stock underway) typically softens rents 12–24 months out; light construction supports rent growth.
Investment metrics
- 1% rule
- 0.98% ✗
- Cap rate
- 3.44%
- Cash-on-cash
- -10.18%
- DSCR
- 0.55
- GRM
- 8.5
CMA / ARV
No comps found within radius.
Projected returns pro-forma
-3.0% appreciation · 4.84% rent growth · sell at horizon
- IRR
- -41.7%
- Equity multiple
- -0.33×
- Total profit
- $-135,924
- Equity at exit
- $54,423
- IRR
- -43.3%
- Equity multiple
- -0.90×
- Total profit
- $-194,320
- Equity at exit
- $31,559
Cash invested: $102,200 (down + closing). Projections, not guarantees.
Landlord ↔ Tenant lean methodology
- Overall (STATE)
- 15 Strongly Tenant-Friendly
- State New York
- 15 Strongly Tenant-Friendly · D+10
- County
- — inherits STATE
- City
- — inherits STATE
ZIP-level market 11561
- Rents YoY
- 4.8%
- Active inventory
- 353
- Price-to-rent
- 8.5×
Monthly cashflow live
- Estimated rent
- $3,566 high interval (Pro) →
- Mortgage (P&I)
- −$1,914
- Tax est. 1.5%
- −$456 /mo · $5,475/yr
- Insurance
- −$152
- Flood insurance flood zone
- −$460 /mo · $5,525/yr
- HOA est. from 2 same-building comps
- −$1,162
- Vacancy / Maint / Mgmt
- −$749
- Net cashflow
- $-1,328
Break-even live
Sensitivity live
| Price | -10% $-1,075 | -5% $-1,201 | +0% $-1,328 | +5% $-1,454 | +10% $-1,580 |
|---|---|---|---|---|---|
| Rent | -10% $-1,609 | -5% $-1,468 | +0% $-1,328 | +5% $-1,187 | +10% $-1,046 |
| Rate | -1.0pp $-1,144 | -0.5pp $-1,235 | base $-1,328 | +0.5pp $-1,422 | +1.0pp $-1,518 |
UW: 25.0% down · 7.5% · 30yr · 1.5% tax · 5.0% vac · 8.0% maint · 8.0% mgmt
Financing live
Cash to close
- Down payment
- $91,250
- Closing costs
- $10,950
- Reserves months
- —
- Total cash needed
- —
Loan-product check · same deal, 3 products live
Conventional
25% down · 7.5% · 30yr
- Down + closing
- —
- Monthly P&I
- —
- Monthly cashflow
- —
- DSCR
- —
- Eligible?
- —
Personal DTI + credit; lowest rate.
DSCR
20% down · 8.5% · 30yr
- Down + closing
- —
- Monthly P&I
- —
- Monthly cashflow
- —
- DSCR
- —
- Eligible?
- —
No personal income docs; deal must DSCR.
Hard money
10% down · 12.0% · 12mo
- Down + closing
- —
- Monthly P&I
- —
- Monthly cashflow
- —
- DSCR
- —
- Eligible?
- —
Short-term bridge; refi at stabilization.
Rent comps 26 comps
| Address | Beds | Baths | Sqft | Rent | $/sqft | DOM | Units | Dist |
|---|---|---|---|---|---|---|---|---|
| 180 Boardwalk Long Beach, NY | 2.0 | 1.0–2.0 | 886 | $6,200 | $6.99 | 0d | 8 | 0.08mi |
| 100 W Broadway Long Beach, NY | 1.0–2.0 | 1.5–2.5 | 1062 | $4,500 | $4.24 | 1d | 2 | 0.09mi |
| 100 W Broadway Long Beach, NY | 1.0–2.0 | 1.5–2.5 | 900 | $3,975 | $4.42 | 45d | 1 | 0.09mi |
| 185 W Park Ave Unit 209 Long Beach, NY | 1.0 | 1.0 | 750 | $3,200 | $4.27 | 45d | 1 | 0.32mi |
| 470 Lafayette Blvd Unit 2 Long Beach, NY | 1.0 | 1.0 | 600 | $5,500 | $9.17 | 45d | 1 | 0.59mi |
| 322 E Penn St Long Beach, NY | 1.0 | 1.0 | 400 | $2,600 | $6.50 | 19d | 1 | 0.61mi |
| 475 W Broadway Apt B2 Long Beach, NY | 1.0 | 1.0 | 600 | $2,750 | $4.58 | 5d | 1 | 0.62mi |
| 330 E Broadway Unit 202 Long Beach, NY | 1.0 | 1.0 | 600 | $2,475 | $4.12 | 26d | 1 | 0.62mi |
| 356 E Broadway Unit A Long Beach, NY | 1.0 | 1.0 | 600 | $2,375 | $3.96 | 45d | 1 | 0.66mi |
| 570 Monroe Blvd Unit 1st Floor Long Beach, NY | 2.0 | 1.0 | 700 | $3,500 | $5.00 | 1d | 1 | 0.72mi |
| 451 E Broadway Apt 1 Long Beach, NY | — | 1.0 | 500 | $2,100 | $4.20 | 45d | 1 | 0.81mi |
| 458 E Broadway Unit 3 Long Beach, NY | 1.0 | 1.0 | 537 | $2,300 | $4.28 | 45d | 1 | 0.82mi |
| 458 E Broadway Unit 4 Long Beach, NY | 1.0 | 1.0 | 537 | $2,550 | $4.75 | 26d | 1 | 0.82mi |
| 470 E Broadway Unit A-8 Long Beach, NY | — | 1.0 | 400 | $2,000 | $5.00 | 21d | 1 | 0.85mi |
| 470 E Broadway Unit A-10 Long Beach, NY | — | 1.0 | 400 | $1,900 | $4.75 | 45d | 1 | 0.85mi |
| 470 E Broadway Unit B-3 Long Beach, NY | — | 1.0 | 350 | $2,200 | $6.29 | 45d | 1 | 0.85mi |
| 631 W Market St Unit 2 Long Beach, NY | 1.0 | 1.0 | 680 | $3,000 | $4.41 | 45d | 1 | 0.93mi |
| 554 E Park Ave Unit 2 Long Beach, NY | 1.0 | 1.0 | 700 | $2,350 | $3.36 | 45d | 1 | 1.00mi |
| 608 E Penn St Unit Walk-in Long Beach, NY | 1.0 | 1.0 | 360 | $1,950 | $5.42 | 45d | 1 | 1.04mi |
| 56 Suffolk Rd Island Park, NY | 1.0 | 1.0 | 650 | $3,000 | $4.62 | 45d | 1 | 1.09mi |
| 74 Radcliffe Rd Unit Left Island Park, NY | 1.0 | 1.0 | 450 | $1,900 | $4.22 | 13d | 1 | 1.10mi |
| 650 Shore Rd Unit 1Q Long Beach, NY | — | 1.0 | 700 | $2,200 | $3.14 | 7d | 1 | 1.12mi |
| 96 Warwick Rd Island Park, NY | 2.0 | 1.0 | 750 | $2,500 | $3.33 | 45d | 1 | 1.25mi |
| 830 Shore Rd Unit 3-I Long Beach, NY | — | 1.0 | 600 | $14,500 | $24.17 | 19d | 1 | 1.38mi |
| 133 Cleveland Ave Unit 1st Fl Long Beach, NY | 2.0 | 1.0 | 750 | $3,250 | $4.33 | 45d | 1 | 1.43mi |
| 855 E Broadway Long Beach, NY | 1.0 | 1.0 | 500 | $2,700 | $5.40 | 6d | 3 | 1.45mi |
HOA detail condo
- Monthly dues
- $0 · $0/yr
- Likely covers
- electric
- Assessments
- None detected in remarks — confirm with the listing agent.
Listing history 9 events
-
2026-04-27status Pending
-
2026-04-01$365,000 Active
-
2026-03-26historical $365,000
-
2022-11-22soldstatus $325,000 Closed 424-char remark
Show marketing remark (424 chars)
This bright and renovated unit is your next beach escape! Featuring a studio converted to a one bedroom, with the largest balcony in Seaview Gardens! Including a modern kitchen with stainless steel appliances & wine fridge, cozy living room, one bedroom with built in electric FP, and an updated bathroom. Right across the street from the Beach and move in ready condition!! Close to LIRR, Shops, Restaurants & more!
-
2022-09-02status Pending 424-char remark
Show marketing remark (424 chars)
This bright and renovated unit is your next beach escape! Featuring a studio converted to a one bedroom, with the largest balcony in Seaview Gardens! Including a modern kitchen with stainless steel appliances & wine fridge, cozy living room, one bedroom with built in electric FP, and an updated bathroom. Right across the street from the Beach and move in ready condition!! Close to LIRR, Shops, Restaurants & more!
-
2022-08-15$310,000 Active 424-char remark
Show marketing remark (424 chars)
This bright and renovated unit is your next beach escape! Featuring a studio converted to a one bedroom, with the largest balcony in Seaview Gardens! Including a modern kitchen with stainless steel appliances & wine fridge, cozy living room, one bedroom with built in electric FP, and an updated bathroom. Right across the street from the Beach and move in ready condition!! Close to LIRR, Shops, Restaurants & more!
-
2022-08-15$325,000
Show marketing remark (424 chars)
This bright and renovated unit is your next beach escape! Featuring a studio converted to a one bedroom, with the largest balcony in Seaview Gardens! Including a modern kitchen with stainless steel appliances & wine fridge, cozy living room, one bedroom with built in electric FP, and an updated bathroom. Right across the street from the Beach and move in ready condition!! Close to LIRR, Shops, Restaurants & more!
-
2013-07-23historical
-
2013-04-03$199,000
ⓘ Source: listings_history table (triggers on properties + properties_extension) + one-shot
backfill from property_details.listing_events for pre-trigger history.
Climate risk First Street
- Flood 6/10 Major FEMA zone AE · 57% chance over 30 yrs
- Wildfire 1/10 Low
- Heat 6/10 Major 7 d/yr ≥95°F today · 16 d/yr by 30 yrs out
- Wind 8/10 Severe 80% chance of damaging wind over 30 yrs
- Air quality 4/10 Moderate 4 unhealthy d/yr today · 6 by 30 yrs out
Nearby sold comps map
Loading sold comps map…
Walkable amenities ~0.75 mi
Loading nearby amenities…
Taxation est. · year 1
- Rental income
- $42,794
- − Mortgage interest
- −$20,446
- − Property taxes
- −$5,475
- − Insurance
- −$7,350
- − Repairs & maintenance
- −$3,424
- − Management
- −$3,424
- − HOA
- −$13,944
- − Depreciation
- −$10,618
- Taxable loss
- −$21,886
- Est. tax savings @ 24.0%
- +$5,253
- After-tax cash flow
- $-10,678/yr
For passive investors: Depreciation is non-cash, so a rental often shows a tax loss while cash-flowing — sheltering income. Rental losses are passive: they offset passive income freely, and up to $25,000/yr can offset ordinary (W-2) income if you actively participate and your MAGI is under $100k (phasing out to $0 by $150k); unused losses carry forward. On sale, claimed depreciation is recaptured at up to 25%, and gains may owe capital-gains tax (a 1031 exchange can defer both). Figures are a year-1 estimate at your 24.0% rate — not tax advice; consult a CPA.
Schools (NCES district)
- District
- Long Beach City School District
- NCES district ID
- 3617730
- Math proficiency
- 66% ▼ -6.00%
- Reading proficiency
- 65% ▼ -1.00%
- Median HH income
- $86,938
- Composite
- 59.18/100
- National rank
- #947
- State rank
- #150 of 590 in NY
Livability — Long Beach
- Score
- 82/100
- State rank
- #84
- US rank
- #1285
Category grades
Schools grade is shown separately in the Schools card above.
Census & demographics
- Census place
- Long Beach, NY
- County
- Nassau County · 653,051 people
- City population
- 38,708
- Metro
- New York-Newark-Jersey City, NY-NJ-PA
- Population (ZIP)
- 38,708
- Household income
- $141,629
- Rent vs Own
- Severe rent burden
- 1284.0
Population outlook (Nassau County) Hauer SSP2
- Today (2025)
- 1,409,302 people
- By 2030
- 1,431,482 · +1.6%
- By 2040
- 1,471,607 · +4.4%
- By 2050
- 1,502,845 · +6.6%
- By 2075
- 1,575,403 · +11.8%
- By 2100
- 1,554,356 · +10.3%
Race, ethnicity, and origin ACS 2023
- Neighborhood character
- Predominantly White (73%)
- Race & ethnicity
- White 73% Hispanic / Latino 14% Two or more races 7% Asian 5% Black 4%
- Hispanic origin (detail)
- Puerto Rican 2% Dominican 1%
- Common ancestry
- Romanian 4% Scotch-Irish 4% Italian 2%
- Foreign-born
- 14% · Canada, Jamaica, China
- Languages at home
- 84% English-only · Spanish 8% Other Indo-European 3% Tagalog/Filipino 2%
Political lean MEDSL · Nassau
- 2024 margin
- Toss-up / Even · D 47.9% · R 52.1%
- 2008→2024 swing
- -12.6pp toward R · 2008: 8.4pp · 2024: -4.2pp
- All cycles
- 2024: R+4.2 2020: D+9.5 2016: D+5.3 2012: D+6.7 2008: D+8.4
Not yet ingested
- Civics
- —
Market trends
- HPI YoY
- ▼ -1067.69%
- Current HPI
- 309.3598
- Rent YoY
- ▲ 4.84%
- Metro
- New York-Newark-Jersey City, NY-NJ-PA
- State GDP YoY
- ▲ 2.60%
- F500 in state
- 92
Industry mix (Fortune 500 HQ in NY)
| Industry | F500 HQs | Revenue |
|---|---|---|
| Financial Services | 10 | $950B |
|
||
| Consumer Goods | 9 | $162B |
|
||
| Insurance | 4 | $225B |
|
||
| Telecommunications | 2 | $144B |
|
||
| Pharmaceuticals | 2 | $112B |
|
||
| Media / Entertainment | 2 | $69B |
|
||
Price history
+83.4% since first listed9 events — show timeline
- 2026-04-27 Pending — OneKey® MLS as Distributed by MLS Grid
- 2026-04-01 Listed $365,000 OneKey® MLS as Distributed by MLS Grid
- 2026-03-26 Coming Soon $365,000 OneKey® MLS as Distributed by MLS Grid
- 2022-11-22 Sold (MLS) $325,000 OneKey® MLS as Distributed by MLS Grid
- 2022-09-02 Pending — OneKey® MLS as Distributed by MLS Grid
- 2022-08-15 Listed $325,000 Cincy MLS
- 2022-08-15 Listed $310,000 OneKey® MLS as Distributed by MLS Grid
- 2013-07-23 Listing Removed — OneKey® MLS as Distributed by MLS Grid
- 2013-04-03 Listed $199,000 OneKey® MLS as Distributed by MLS Grid
Cash-flow waterfall
monthlySold comps — $/sqft
last 12 mo · ≤1 miLoading sold comps…