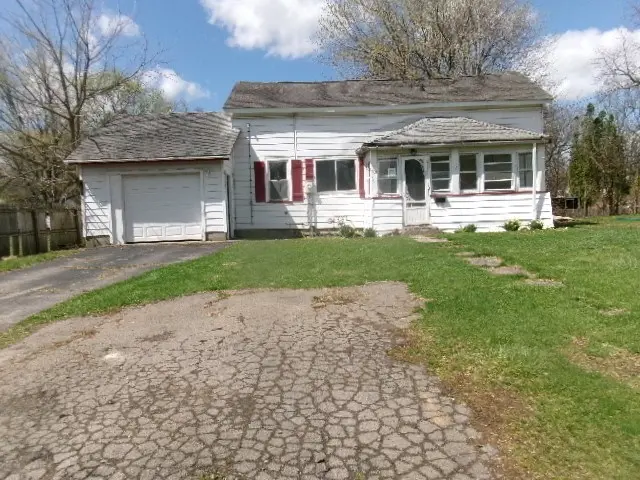
105 Mill St · Newark, NY
Flood risk No data
- FEMA flood zone
- —
- Chance of flooding over 30 yrs
- —
- Est. flood insurance / yr
- —
Fire risk No data
- Est. fire insurance / yr
- —
Heat risk No data
- Hot days now (above threshold)
- —
- Hot days in 30 yrs
- —
Wind risk No data
- Chance of severe wind over 30 yrs
- —
Air-quality risk No data
- Unhealthy air days now
- —
- Unhealthy air days in 30 yrs
- —
Risk factors via First Street. Map © Google.
Why this score? — see what drove the B- grade
The composite is a weighted blend of 9 inputs, each scored 0–100. Each bar is that input's sub-score; the figure is the points it added to the 100-point composite (weight × sub-score).
- Cash flow +30.0/30.0
- 1% rule +10.0/10.0
- DSCR +10.0/10.0
- ARV discount +7.5/15.0
- Livability +3.6/5.0
- Schools +3.4/10.0
- Rent growth +2.5/5.0
- Condition / age +2.5/5.0
- Appreciation +0.0/10.0
$64,000
🖨 Deal sheet (PDF) 📄 Offer letter ✓ Due diligence
Listing remarks
Charming home situated on a quiet lot, located close to your needed amenities. Home offers a nice open floor plan allowing lots of natural light throughout. Spacious kitchen with plenty of cabinet space. One car attached garage provides ample room for extra storage or covered parking! Dont miss it!
Key facts
- Open floor plan
- Attached garage
- Extra storage
Tags
Property features AI
Exterior
- Parking: Attached garage (1 car)
- Utilities: Public water connected; Sewer connected; Electric with circuit breakers
- Home design: Single-story property; Existing construction
- Construction: Wood siding; Poured and stone foundation
- Exterior features: Gravel driveway; Rectangular residential lot; City street frontage
Interior
- Kitchen: Gas water heater
- Bedrooms: One main-level bedroom
- Flooring: Laminate; Vinyl; Varied flooring
- Bathrooms: One full bathroom; One half bathroom; One main-level bathroom
- Heating & cooling: Gas forced-air heating
- Interior features: Eat-in kitchen; Separate/formal living room; Full basement
Neighborhood map
What this means for you Summary
Snapshot
- This is a 3-bed/1.5-bath single-family listed at $64k.
Deal economics
- At list price, monthly cash flow is $374 ($4k/yr) — positive.
- The deal already cash-flows at list — no discount required.
- Meets the 1% rule at list price ($1k rent vs $64k).
- Recommended offer: $63k (1.5% below list) — sets the bar for market timing.
- Cap rate 13.3% vs local median 5.0% in Newark — top-decile yield for the area; either an underpriced asset or a hidden risk that comps aren't pricing in. Stress-test before assuming the spread holds.
Location & tenants
- Location reads 71/100 on livability (#405 in NY) — a middle-class / working-renter tenant base. Strengths: cost of living A+, housing A+, commute B; Watch: employment D+, crime F, amenities F.
- Newark Central School District (town): math 33% / reading 46% proficiency, ranked #527 of 590 in NY (top 89%) — families likely to look elsewhere, expect single-tenant / working-renter base with shorter leases.
- Zoned schools: Norman R Kelley Intermediate School (math 34% / reading 41%, grade F, #1,516 of 2,108 statewide, top 72%, 387 students, 62% FRL); Newark Middle School (math 10% / reading 38%, grade F, #640 of 729 statewide, top 88%, 445 students, 59% FRL); Newark Senior High School (math 77% / reading 82%, grade A-, #518 of 1,100 statewide, top 51%, 602 students, 54% FRL) — zoned schools average 58% FRL vs 43% district-wide (16 pts higher); higher-poverty schools than district average — tighter screening recommended.
- Market conditions: 43 active listings in the ZIP; 1 comparable units currently listed for rent nearby; 259 units permitted in Wayne County in 2024 (90 in 5+ unit buildings).
Forward outlook
- Local home prices are declining (-3.0%/yr); year-one equity from $442 of loan paydown is wiped out by about $2k of value loss. Plan a longer hold.
- Wayne County population projected at -24% by 2050 — secular population decline; favor cash flow + early exit over multi-decade hold.
- At projected returns (-3.0% appreciation + 3.0% rent growth), your $18k cash investment doubles in ~5 years — after that, you're playing with house money.
Negotiation context
- It's been on market 24 days — a 2% lower offer ($63k) is reasonable based on typical stale-listing flexibility.
- 4 sale attempts since 18y ago with the ask held roughly flat each time — persistent listings suggest the price (not the market) is what's stuck; bring a comps-based counter.
Risks & watch-outs
- Watch-outs: property tax is 4.0% of price; built in 1870 — expect roof / HVAC / electrical / plumbing capex.
Questions for the listing agent
- Built in 1870 — when were the roof, HVAC, electrical panel, plumbing, and water heater last replaced?
- Property tax is high relative to price — has the assessment been appealed recently, and will the sale trigger a re-assessment?
- Is there a deadline driving the sale (1031 exchange, divorce, estate, relocation)? That informs how much negotiation room exists.
- Schools are D-rated, which usually means shorter tenancies and higher turnover. Who's the typical renter profile here, and what's been the actual vacancy rate?
- Crime grade is F in this area — have there been break-ins, vandalism, or insurance claims at this property in the last 3 years? What carrier currently insures it and at what premium?
- What's the average days-on-market for RENTAL listings here right now (not sales)? A rising rental-DOM trend means longer vacancies and softer asking-rent achievability than the comps imply.
- What's the recent tenant-quality profile in this submarket — average credit score on applications, eviction rate, late-payment / NSF rate, and stable-employment percentage? A property-management company in the area should have these aggregated.
- How much new for-sale + rental construction is in the pipeline within 1–3 miles? Heavy new supply typically softens prices + rents 12–24 months out; constrained supply supports both.
Investment metrics
- 1% rule
- 1.88% ✓
- Cap rate
- 13.30%
- Cash-on-cash
- 25.02%
- DSCR
- 2.11
- GRM
- 4.4
CMA / ARV
- ARV (median comp)
- $203,062
- List price
- $64,000
- Delta
- -68.48%
- Verdict
- UNDERPRICED
- Comps
- 20 within 1.0 mi
Show comp detail 9 sales within ~0.75 mi
| Address | Dist | Beds/Ba | Sqft | Sold | Price | $/sf | Match |
|---|---|---|---|---|---|---|---|
| 104 W Godfrey St | 0.24mi | 3/1.0 | 1,224 (-0%) | 19mo | $110,000 | $90 | 70 |
| 330 Vienna St | 0.25mi | 3/2.0 | 1,224 (-0%) | 19mo | $210,000 | $172 | 70 |
| 301 Vienna St | 0.23mi | 2/1.5 (-1) | 1,184 (-4%) | 19mo | $202,000 | $171 | 62 |
| 326 E Miller St | 0.58mi | 3/2.0 | 1,284 (+5%) | 9mo | $199,357 | $155 | 56 |
| 352 Vienna St | 0.30mi | 4/3.0 (+1) | 1,346 (+10%) | 6mo | $95,000 | $71 | 54 |
| 438 Van Buren St | 0.45mi | 2/1.5 (-1) | 1,220 (-1%) | 23mo | $185,000 | $152 | 54 |
| 350 E Union St | 0.52mi | 2/1.5 (-1) | 1,139 (-7%) | 7mo | $109,250 | $96 | 53 |
| 407 E Miller St | 0.52mi | 2/1.5 (-1) | 1,116 (-9%) | 11mo | $15,000 | $13 | 47 |
| 307 Vienna St | 0.23mi | 2/1.0 (-1) | 1,371 (+12%) | 24mo | $140,000 | $102 | 43 |
Match score weights: distance 35% · size 25% · config 20% · recency 20%. Top-matched comps best support the ARV.
Projected returns pro-forma
-3.0% appreciation · 3.0% rent growth · sell at horizon
- IRR
- 18.6%
- Equity multiple
- 1.75×
- Total profit
- $13,528
- Equity at exit
- $9,543
- IRR
- 27.0%
- Equity multiple
- 3.39×
- Total profit
- $42,828
- Equity at exit
- $5,534
Cash invested: $17,920 (down + closing). Projections, not guarantees.
Landlord ↔ Tenant lean methodology
- Overall (STATE)
- 15 Strongly Tenant-Friendly
- State New York
- 15 Strongly Tenant-Friendly · D+10
- County
- — inherits STATE
- City
- — inherits STATE
ZIP-level market 14513
- Home prices YoY
- -16.7%
- Active inventory
- 43
- Price-to-rent
- 4.4×
Monthly cashflow live
- Estimated rent
- $1,200 medium interval (Pro) →
- Mortgage (P&I)
- −$336
- Tax from tax record
- −$212 /mo · $2,544/yr
- Insurance
- −$27
- HOA
- −$0
- Vacancy / Maint / Mgmt
- −$252
- Net cashflow
- $374
Break-even live
Sensitivity live
| Price | -10% $410 | -5% $392 | +0% $374 | +5% $356 | +10% $337 |
|---|---|---|---|---|---|
| Rent | -10% $279 | -5% $326 | +0% $374 | +5% $421 | +10% $468 |
| Rate | -1.0pp $406 | -0.5pp $390 | base $374 | +0.5pp $357 | +1.0pp $340 |
UW: 25.0% down · 7.5% · 30yr · 1.5% tax · 5.0% vac · 8.0% maint · 8.0% mgmt
Financing live
Cash to close
- Down payment
- $16,000
- Closing costs
- $1,920
- Reserves months
- —
- Total cash needed
- —
Loan-product check · same deal, 3 products live
Conventional
25% down · 7.5% · 30yr
- Down + closing
- —
- Monthly P&I
- —
- Monthly cashflow
- —
- DSCR
- —
- Eligible?
- —
Personal DTI + credit; lowest rate.
DSCR
20% down · 8.5% · 30yr
- Down + closing
- —
- Monthly P&I
- —
- Monthly cashflow
- —
- DSCR
- —
- Eligible?
- —
No personal income docs; deal must DSCR.
Hard money
10% down · 12.0% · 12mo
- Down + closing
- —
- Monthly P&I
- —
- Monthly cashflow
- —
- DSCR
- —
- Eligible?
- —
Short-term bridge; refi at stabilization.
Rent comps 1 comps
| Address | Beds | Baths | Sqft | Rent | $/sqft | DOM | Units | Dist |
|---|---|---|---|---|---|---|---|---|
| 310 Washington St Newark, NY | 2.0 | 1.0 | 900 | $1,200 | $1.33 | 4d | 1 | 1.22mi |
Listing history 12 events
-
2026-06-01status $64,000 Pending 24 DOM
-
2026-06-01days on market $64,000 Active 24 DOM
-
2026-05-31days on market $64,000 Active 23 DOM
-
2026-05-08$64,000 Active 299-char remark
-
2023-05-03soldstatus $95,650 Closed Sale or Rented
-
2023-03-16status Pending Sale
-
2023-03-09status Active
-
2022-12-16status Pending Sale
-
2022-12-13$69,900 Active
-
2008-12-05soldstatus $19,500
-
2008-09-23$29,900
-
2006-05-10soldstatus $12,500
ⓘ Source: listings_history table (triggers on properties + properties_extension) + one-shot
backfill from property_details.listing_events for pre-trigger history.
Tax reassessment forecast NY · Partial reset (capped growth)
- Current annual tax
- $2,544 · $212/mo
- Projected year-2 tax
- $2,544 · $212/mo
- Expected delta
- $0/yr ($0/mo · 0.0%)
ⓘ Screening estimate from a state-policy table — verify with the county assessor before closing.
Nearby sold comps map
Loading sold comps map…
Walkable amenities ~0.75 mi
Loading nearby amenities…
Taxation est. · year 1
- Rental income
- $14,400
- − Mortgage interest
- −$3,585
- − Property taxes
- −$2,544
- − Insurance
- −$320
- − Repairs & maintenance
- −$1,152
- − Management
- −$1,152
- − Depreciation
- −$1,862
- Taxable income
- $3,785
- Est. tax owed @ 24.0%
- −$908
- After-tax cash flow
- $3,576/yr
For passive investors: Depreciation is non-cash, so a rental often shows a tax loss while cash-flowing — sheltering income. Rental losses are passive: they offset passive income freely, and up to $25,000/yr can offset ordinary (W-2) income if you actively participate and your MAGI is under $100k (phasing out to $0 by $150k); unused losses carry forward. On sale, claimed depreciation is recaptured at up to 25%, and gains may owe capital-gains tax (a 1031 exchange can defer both). Figures are a year-1 estimate at your 24.0% rate — not tax advice; consult a CPA.
Schools (NCES district)
- District
- Newark Central School District
- NCES district ID
- 3620640
- Math proficiency
- 33% ▲ 2.00%
- Reading proficiency
- 46% ▲ 15.00%
- Median HH income
- $44,966
- Composite
- 33.55/100
- National rank
- #5428
- State rank
- #527 of 590 in NY
Livability — Newark
- Score
- 71/100
- State rank
- #405
- US rank
- #6978
Category grades
Schools grade is shown separately in the Schools card above.
Census & demographics
- Census place
- Newark, NY
- Population (ZIP)
- 13,501
Population outlook (Wayne County) Hauer SSP2
- Today (2025)
- 85,662 people
- By 2030
- 81,945 · -4.3%
- By 2040
- 73,735 · -13.9%
- By 2050
- 65,029 · -24.1%
- By 2075
- 47,451 · -44.6%
- By 2100
- 31,574 · -63.1%
Race, ethnicity, and origin ACS 2023
- Neighborhood character
- Predominantly White (80%)
- Race & ethnicity
- White 80% Hispanic / Latino 12% Two or more races 10% Black 3% Native American 1%
- Hispanic origin (detail)
- Puerto Rican 5%
- Common ancestry
- Iranian 13% Lithuanian 2% Romanian 2%
- Foreign-born
- 4% · Canada, Vietnam
- Languages at home
- 92% English-only · Spanish 7%
Political lean MEDSL · Wayne
- 2024 margin
- Strong R (+23.1) · D 38.5% · R 61.5%
- 2008→2024 swing
- -13.2pp toward R · 2008: -9.9pp · 2024: -23.1pp
- All cycles
- 2024: R+23.1 2020: R+19.6 2016: R+26.1 2012: R+9.3 2008: R+9.9
Not yet ingested
- Civics
- —
Market trends
- HPI YoY
- ▼ -50.98%
- Current HPI
- 253.627
- Rent YoY
- —
- Metro
- —
- State GDP YoY
- ▲ 2.60%
- F500 in state
- 92
Industry mix (Fortune 500 HQ in NY)
| Industry | F500 HQs | Revenue |
|---|---|---|
| Financial Services | 10 | $950B |
|
||
| Consumer Goods | 9 | $162B |
|
||
| Insurance | 4 | $225B |
|
||
| Telecommunications | 2 | $144B |
|
||
| Pharmaceuticals | 2 | $112B |
|
||
| Media / Entertainment | 2 | $69B |
|
||
Price history
+412.0% since first listed10 events — show timeline
- 2026-06-01 Pending — UNYREIS
- 2026-05-08 Listed $64,000 UNYREIS
- 2023-05-03 Sold (MLS) $95,650 CNYIS
- 2023-03-16 Pending — CNYIS
- 2023-03-09 Relisted — CNYIS
- 2022-12-16 Pending — CNYIS
- 2022-12-13 Listed $69,900 CNYIS
- 2008-12-05 Sold (Public Records) $19,500 Public Records
- 2008-09-23 Listed $29,900 UNYREIS
- 2006-05-10 Sold (Public Records) $12,500 Public Records
Property tax history
+7.7%/yrLatest (2025): $2,544 · +11.5% YoY. Source: county tax records.
Cash-flow waterfall
monthlySold comps — $/sqft
last 12 mo · ≤1 miLoading sold comps…