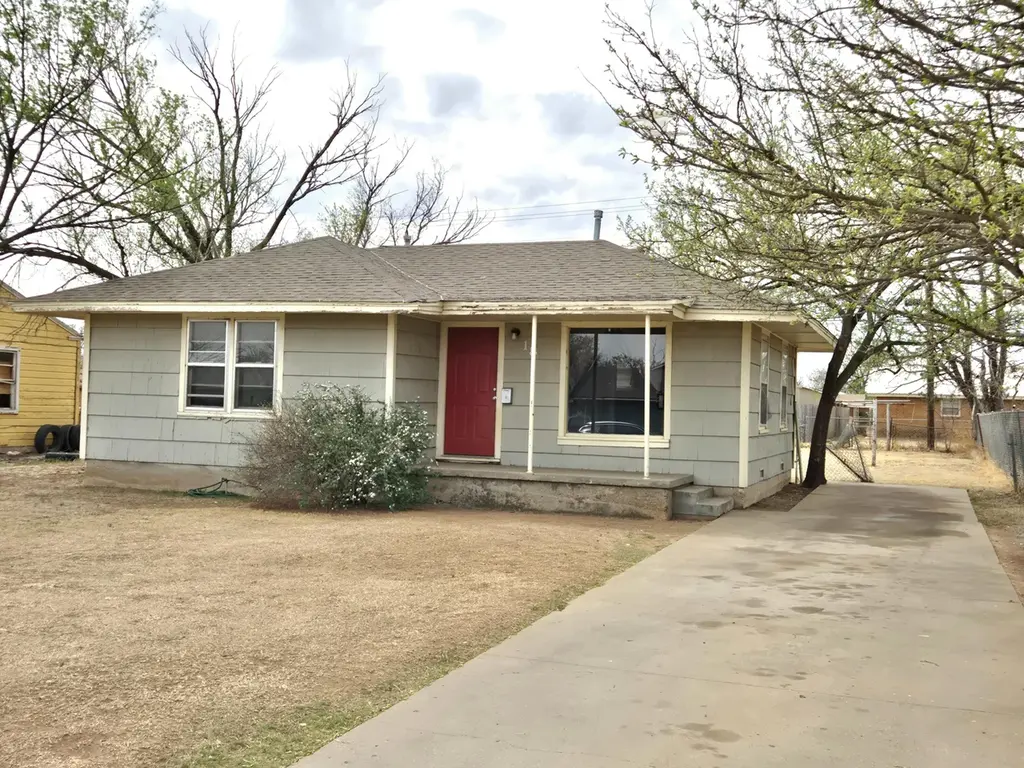
18 Houston Rd · Tulia, TX
Flood risk 1/10 · Minimal
- FEMA flood zone
- —
- Chance of flooding over 30 yrs
- 0.0%
- Est. flood insurance / yr
- —
Fire risk 8/10 · Major
- Est. fire insurance / yr
- $1,222 – $2,270
Heat risk 5/10 · Moderate
- Hot days now (above 98°F)
- 7 days/yr
- Hot days in 30 yrs
- 18 days/yr
Wind risk 2/10 · Minimal
- Chance of severe wind over 30 yrs
- —
Air-quality risk 2/10 · Minimal
- Unhealthy air days now
- 1 days/yr
- Unhealthy air days in 30 yrs
- 1 days/yr
Risk factors via First Street. Map © Google.
Why this score? — see what drove the D grade
The composite is a weighted blend of 9 inputs, each scored 0–100. Each bar is that input's sub-score; the figure is the points it added to the 100-point composite (weight × sub-score).
- Cash flow +11.6/30.0
- ARV discount +7.5/15.0
- Appreciation +5.6/10.0
- DSCR +3.4/10.0
- 1% rule +3.0/10.0
- Livability +2.8/5.0
- Rent growth +2.5/5.0
- Condition / age +2.5/5.0
- Schools +1.8/10.0
$74,500
🖨 Deal sheet 📄 Offer letter ✓ Due diligence
Listing remarks MLS
Cheaper than renting! Move-in ready 2 bedroom home with beautiful hardwood floors, central heat & AC and a large bathroom. Affordable for homeowners or investors. Features fresh paint, a functional layout, dedicated laundry room and the primary bedroom includes 2 closets! Contact your favorite local realtor to schedule a showing!
Key facts
- 2 closets
- Functional layout
- Hardwood floors
Tags
Neighborhood map
What this means for you Summary
Snapshot
- This is a 2-bed/1.0-bath single-family listed at $74k.
Deal economics
- At list price, monthly cash flow is $-23 ($-273/yr) — negative.
- To cash-flow at today's rent, offer at most $70k (5.4% below list).
- To meet the 1% rule (rent ≥ 1% of price), the offer needs to be $60k (19.6% below list).
- Recommended offer: $60k (19.6% below list) — sets the bar for 1% rule.
Location & tenants
- Location reads 56/100 on livability (#1,297 in TX) — a working-class tenant base; expect higher turnover. Strengths: cost of living A+, housing A; Watch: schools F, crime D-, amenities F.
- Tulia ISD (town): math 22% / reading 21% proficiency, ranked #768 of 826 in TX (top 93%) — low school quality limits family demand, transient renter base, plan for 1-2y turnover; 68% free/reduced lunch — lower-income household profile, screen leases tightly.
- Market conditions: 47 active listings in the ZIP; 1 comparable units currently listed for rent nearby.
Forward outlook
- In year one you build about $1k of equity ($515 loan paydown + $936 appreciation (1.3% local appreciation)).
- Swisher County population projected at -15% by 2050 — secular population decline; favor cash flow + early exit over multi-decade hold.
- At projected returns (1.3% appreciation + 3.0% rent growth), your $21k cash investment doubles in ~10 years — after that, you're playing with house money.
Negotiation context
- It's been on market 75 days — a 6% lower offer ($70k) is reasonable based on typical stale-listing flexibility.
Risks & watch-outs
- Climate carrying-cost: severe wildfire risk; extreme-heat days projected 7→18/yr by 2055 (HVAC capex compounding) — expect insurance premiums to compound above CPI over the hold.
Questions for the listing agent
- What do current leases actually rent for vs. the listed asking? Can we see a recent rent roll and the last 12 months of T-12 income?
- It's been on market 75 days. Have you received any prior offers? Is the seller open to a 20% concession, seller financing, or rate buy-down credit?
- Built in 1970 — when were the roof, HVAC, electrical panel, plumbing, and water heater last replaced?
- Why hasn't it sold? Are there any deal-killer items the seller is aware of (foundation, flood, title, zoning, code violations)?
- Is there a deadline driving the sale (1031 exchange, divorce, estate, relocation)? That informs how much negotiation room exists.
- Schools are F-rated, which usually means shorter tenancies and higher turnover. Who's the typical renter profile here, and what's been the actual vacancy rate?
- Crime grade is D in this area — have there been break-ins, vandalism, or insurance claims at this property in the last 3 years? What carrier currently insures it and at what premium?
- The area grade is low — what's the realistic commute time and amenity access for the typical tenant pool here? Any planned neighborhood developments (good or bad) we should know about?
- What's the average days-on-market for RENTAL listings here right now (not sales)? A rising rental-DOM trend means longer vacancies and softer asking-rent achievability than the comps imply.
- What's the recent tenant-quality profile in this submarket — average credit score on applications, eviction rate, late-payment / NSF rate, and stable-employment percentage? A property-management company in the area should have these aggregated.
- How much new for-sale + rental construction is in the pipeline within 1–3 miles? Heavy new supply typically softens prices + rents 12–24 months out; constrained supply supports both.
Investment metrics
- 1% rule
- 0.80% ✗
- Cap rate
- 5.93%
- Cash-on-cash
- -1.31%
- DSCR
- 0.94
- GRM
- 10.4
CMA / ARV
No comps found within radius.
Projected returns pro-forma
1.26% appreciation · 3.0% rent growth · sell at horizon
- IRR
- 0.8%
- Equity multiple
- 1.04×
- Total profit
- $878
- Equity at exit
- $26,431
- IRR
- 5.4%
- Equity multiple
- 1.67×
- Total profit
- $14,043
- Equity at exit
- $35,908
Cash invested: $20,860 (down + closing). Projections, not guarantees.
Landlord ↔ Tenant lean methodology
- Overall (STATE)
- 87 Strongly Landlord-Friendly
- State Texas
- 87 Strongly Landlord-Friendly · R+5
- County
- — inherits STATE
- City
- — inherits STATE
ZIP-level market 79088
- Home prices YoY
- 0.8%
- Active inventory
- 47
- Price-to-rent
- 10.4×
Monthly cashflow live
- Estimated rent
- $599 medium interval (Pro) →
- Mortgage (P&I)
- −$391
- Tax from tax record
- −$74 /mo · $891/yr
- Insurance
- −$31
- HOA
- −$0
- Vacancy / Maint / Mgmt
- −$126
- Net cashflow
- $-23
Break-even live
UW: 25.0% down · 7.5% · 30yr · 1.5% tax · 5.0% vac · 8.0% maint · 8.0% mgmt
Financing live
Cash to close
- Down payment
- $18,625
- Closing costs
- $2,235
- Reserves months
- —
- Total cash needed
- —
Loan-product check · same deal, 3 products live
Conventional
25% down · 7.5% · 30yr
- Down + closing
- —
- Monthly P&I
- —
- Monthly cashflow
- —
- DSCR
- —
- Eligible?
- —
Personal DTI + credit; lowest rate.
DSCR
20% down · 8.5% · 30yr
- Down + closing
- —
- Monthly P&I
- —
- Monthly cashflow
- —
- DSCR
- —
- Eligible?
- —
No personal income docs; deal must DSCR.
Hard money
10% down · 12.0% · 12mo
- Down + closing
- —
- Monthly P&I
- —
- Monthly cashflow
- —
- DSCR
- —
- Eligible?
- —
Short-term bridge; refi at stabilization.
Rent comps 1 comps
| Address | Beds | Baths | Sqft | Rent | $/sqft | DOM | Units | Dist |
|---|---|---|---|---|---|---|---|---|
| 711 S Austin Ave Tulia, TX | 2.0 | 1.0 | 700 | $599 | $0.86 | 21d | 1 | 1.23mi |
Listing history 16 events
-
2026-06-18days on market $74,500 Active 75 DOM
-
2026-06-17days on market $74,500 Active 74 DOM
-
2026-06-16days on market $74,500 Active 73 DOM
-
2026-06-15days on market $74,500 Active 72 DOM
-
2026-06-15days on market $74,500 Active 71 DOM
-
2026-06-13days on market $74,500 Active 70 DOM
-
2026-06-12days on market $74,500 Active 69 DOM
-
2026-06-09days on market $74,500 Active 66 DOM
-
2026-06-08days on market $74,500 Active 65 DOM
-
2026-06-08days on market $74,500 Active 64 DOM
-
2026-06-07days on market $74,500 Active 63 DOM
-
2026-06-03days on market $74,500 Active 60 DOM
-
2026-06-02days on market $74,500 Active 59 DOM
-
2026-06-01days on market $74,500 Active 58 DOM
-
2026-05-31days on market $74,500 Active 57 DOM
-
2026-04-04$74,500 Active 337-char remark
Show marketing remark (337 chars)
Cheaper than renting! Move-in ready 2 bedroom home with beautiful hardwood floors, central heat & AC and a large bathroom. Affordable for homeowners or investors. Features fresh paint, a functional layout, dedicated laundry room and the primary bedroom includes 2 closets! Contact your favorite local realtor to schedule a showing!
ⓘ Source: listings_history table (triggers on properties + properties_extension) + one-shot
backfill from property_details.listing_events for pre-trigger history.
Tax reassessment forecast TX · Resets to sale price
- Current annual tax
- $891 · $74/mo
- Projected year-2 tax
- $1,363 · $114/mo
- Expected delta
- +$472/yr (+$39/mo · 53.0%)
ⓘ Screening estimate from a state-policy table — verify with the county assessor before closing.
Climate risk First Street
- Flood 1/10 Low 0% chance over 30 yrs
- Wildfire 8/10 Severe
- Heat 5/10 Major 7 d/yr ≥98°F today · 18 d/yr by 30 yrs out
- Wind 2/10 Low
- Air quality 2/10 Low 1 unhealthy d/yr today · 1 by 30 yrs out
Nearby sold comps map
Loading sold comps map…
Walkable amenities ~0.75 mi
Loading nearby amenities…
Taxation est. · year 1
- Rental income
- $7,188
- − Mortgage interest
- −$4,173
- − Property taxes
- −$891
- − Insurance
- −$372
- − Repairs & maintenance
- −$575
- − Management
- −$575
- − Depreciation
- −$2,167
- Taxable loss
- −$1,566
- Est. tax savings @ 24.0%
- +$376
- After-tax cash flow
- $103/yr
For passive investors: Depreciation is non-cash, so a rental often shows a tax loss while cash-flowing — sheltering income. Rental losses are passive: they offset passive income freely, and up to $25,000/yr can offset ordinary (W-2) income if you actively participate and your MAGI is under $100k (phasing out to $0 by $150k); unused losses carry forward. On sale, claimed depreciation is recaptured at up to 25%, and gains may owe capital-gains tax (a 1031 exchange can defer both). Figures are a year-1 estimate at your 24.0% rate — not tax advice; consult a CPA.
Schools (NCES district)
- District
- Tulia ISD
- NCES district ID
- 4843320
- Math proficiency
- 22% ▼ -9.00%
- Reading proficiency
- 21% ▼ -6.00%
- Median HH income
- $36,346
- Composite
- 17.86/100
- National rank
- #9004
- State rank
- #768 of 826 in TX
Livability — Tulia
- Score
- 56/100
- State rank
- #1297
- US rank
- #22536
Category grades
Schools grade is shown separately in the Schools card above.
Census & demographics
- Census place
- Tulia, TX
- Population (ZIP)
- 5,315
Population outlook (Swisher County) Hauer SSP2
- Today (2025)
- 7,108 people
- By 2030
- 6,928 · -2.5%
- By 2040
- 6,468 · -9.0%
- By 2050
- 6,017 · -15.3%
- By 2075
- 4,875 · -31.4%
- By 2100
- 3,447 · -51.5%
Race, ethnicity, and origin ACS 2023
- Neighborhood character
- Diverse neighborhood (Simpson 0.64)
- Race & ethnicity
- Hispanic / Latino 45% White 39% Two or more races 16% Black 10%
- Hispanic origin (detail)
- Mexican 39%
- Common ancestry
- Romanian 1% Slovak 1%
- Foreign-born
- 9% · Canada
- Languages at home
- 71% English-only · Spanish 29%
Political lean MEDSL · Swisher
- 2024 margin
- Solid R (+63.5) · D 17.8% · R 81.2%
- 2008→2024 swing
- -29.1pp toward R · 2008: -34.3pp · 2024: -63.5pp
- All cycles
- 2024: R+63.5 2020: R+58.0 2016: R+55.2 2012: R+47.5 2008: R+34.3
Not yet ingested
- Civics
- —
Market trends
- HPI YoY
- ▲ 1.26%
- Current HPI
- 158.3302
- Rent YoY
- —
- Metro
- —
- State GDP YoY
- ▲ 3.95%
- F500 in state
- 110
Industry mix (Fortune 500 HQ in TX)
| Industry | F500 HQs | Revenue |
|---|---|---|
| Energy | 16 | $1,198B |
|
||
| Technology | 5 | $198B |
|
||
| Engineering / Construction | 4 | $72B |
|
||
| Energy Services | 3 | $60B |
|
||
| Utilities | 3 | $41B |
|
||
| Healthcare | 2 | $330B |
|
||
Price history
1 event — show timeline
- 2026-04-04 Listed $74,500 LARMLS
Property tax history
+11.1%/yrLatest (2025): $891 · +9.2% YoY. Source: county tax records.
Cash-flow waterfall
monthlySold comps — $/sqft
last 12 mo · ≤1 miLoading sold comps…