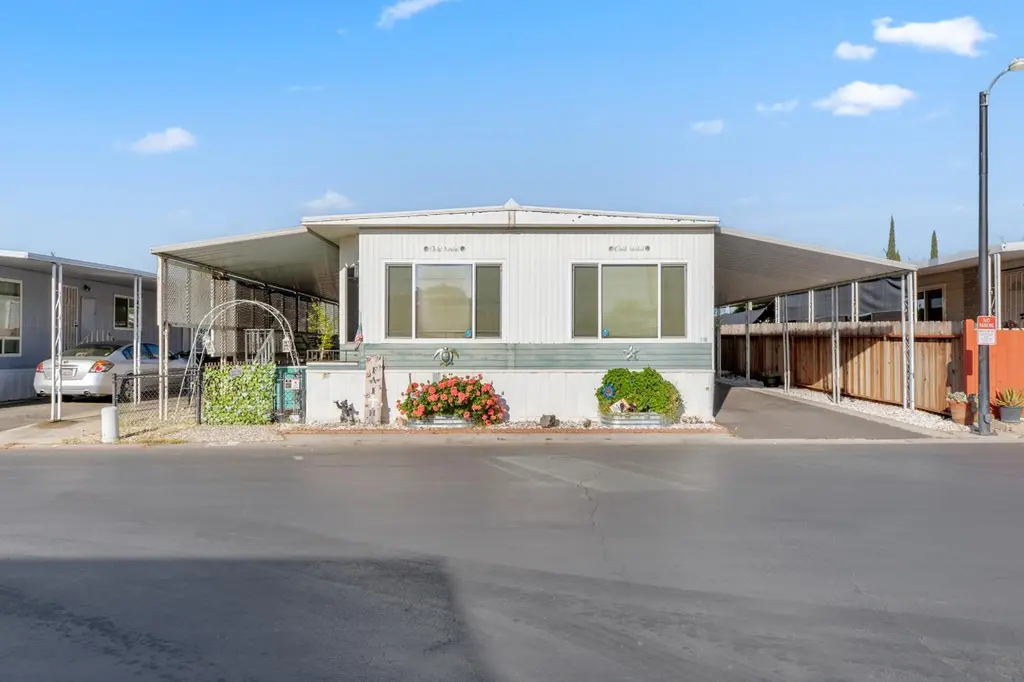
2845 E Hatch Rd #68 · Ceres, CA
Flood risk 1/10 · Minimal
- FEMA flood zone
- X (unshaded)
- Chance of flooding over 30 yrs
- 0.0%
- Est. flood insurance / yr
- $507 – $1,088
Fire risk 4/10 · Minor
- Est. fire insurance / yr
- $659 – $1,223
Heat risk 6/10 · Moderate
- Hot days now (above 102°F)
- 6 days/yr
- Hot days in 30 yrs
- 13 days/yr
Wind risk 1/10 · Minimal
- Chance of severe wind over 30 yrs
- —
Air-quality risk 10/10 · Severe
- Unhealthy air days now
- 34 days/yr
- Unhealthy air days in 30 yrs
- 37 days/yr
Risk factors via First Street. Map © Google.
Why this score? — see what drove the B+ grade
The composite is a weighted blend of 9 inputs, each scored 0–100. Each bar is that input's sub-score; the figure is the points it added to the 100-point composite (weight × sub-score).
- Cash flow +30.0/30.0
- ARV discount +15.0/15.0
- 1% rule +10.0/10.0
- DSCR +10.0/10.0
- Schools +2.8/10.0
- Condition / age +2.8/5.0
- Livability +2.7/5.0
- Rent growth +2.5/5.0
- Appreciation +0.0/10.0
$100,000
🖨 Deal sheet 📄 Offer letter ✓ Due diligence
Listing remarks
Welcome to this beautifully cared-for modular home in the desirable Voyage Cove community, where pride of ownership and charm shine through every detail. This home offers a bright, open floor plan designed for both comfort and everyday living. Large windows fill the living area with natural light, creating a warm and inviting atmosphere. The spacious kitchen features a convenient breakfast bar, perfect for casual meals or entertaining friends, along with plenty of cabinet space for all your storage needs. Throughout the home, tasteful finishes and custom touches add character and style. Step outside and enjoy peaceful views of the greenbelt just beyond the backyardan ideal spot to relax or
Key facts
- Open floor plan
- Clubhouse
- Greenbelt views
Tags
Neighborhood map
What this means for you Summary
Snapshot
- This is a 2-bed/2.0-bath manufactured listed at $100k. Condition is rated average.
Deal economics
- At list price, monthly cash flow is $1k ($13k/yr) — positive.
- The deal already cash-flows at list — no discount required.
- Meets the 1% rule at list price ($2k rent vs $100k).
- Recommended offer: $91k (9.0% below list) — sets the bar for market timing.
- Cap rate 19.5% vs local median 3.8% in Ceres — top-decile yield for the area; either an underpriced asset or a hidden risk that comps aren't pricing in. Stress-test before assuming the spread holds.
Location & tenants
- Location reads 54/100 on livability (#923 in CA) — a working-class tenant base; expect higher turnover. Strengths: housing A+; Watch: employment C-, crime D+, schools D-.
- Ceres Unified (suburban): math 15% / reading 50% proficiency, ranked #303 of 517 in CA (top 59%) — families likely to look elsewhere, expect single-tenant / working-renter base with shorter leases; 69% free/reduced lunch — lower-income household profile, screen leases tightly.
- Market conditions: 109 active listings in the ZIP; 7 comparable units currently listed for rent nearby; rentals at typical pace (median 21d on market — plan ~3-4 weeks tenant-placement turnaround); 923 units permitted in Stanislaus County in 2024 (63 in 5+ unit buildings).
- At $2,266/mo this rent would consume 47% of the median local household income ($58k/yr) (locally 1964% of renters already pay >50% of income on rent) — very limited rent-growth headroom before tenants either downsize or default.
Forward outlook
- Local home prices are declining (-3.0%/yr); year-one equity from $691 of loan paydown is wiped out by about $3k of value loss. Plan a longer hold.
- Stanislaus County population projected at +14% by 2050 — modest demand growth; plan on rents tracking national, not racing it.
- At projected returns (-3.0% appreciation + 3.0% rent growth), your $28k cash investment doubles in ~3 years — after that, you're playing with house money.
Negotiation context
- It's been on market 92 days — a 9% lower offer ($91k) is reasonable based on typical stale-listing flexibility.
Risks & watch-outs
- Climate carrying-cost: extreme-heat days projected 6→13/yr by 2055 (HVAC capex compounding) — expect insurance premiums to compound above CPI over the hold.
Questions for the listing agent
- It's been on market 92 days. Have you received any prior offers? Is the seller open to a 9% concession, seller financing, or rate buy-down credit?
- Built in 1970 — when were the roof, HVAC, electrical panel, plumbing, and water heater last replaced?
- Why hasn't it sold? Are there any deal-killer items the seller is aware of (foundation, flood, title, zoning, code violations)?
- Is there a deadline driving the sale (1031 exchange, divorce, estate, relocation)? That informs how much negotiation room exists.
- Schools are D-rated, which usually means shorter tenancies and higher turnover. Who's the typical renter profile here, and what's been the actual vacancy rate?
- Crime grade is D in this area — have there been break-ins, vandalism, or insurance claims at this property in the last 3 years? What carrier currently insures it and at what premium?
- What's the average days-on-market for RENTAL listings here right now (not sales)? A rising rental-DOM trend means longer vacancies and softer asking-rent achievability than the comps imply.
- What's the recent tenant-quality profile in this submarket — average credit score on applications, eviction rate, late-payment / NSF rate, and stable-employment percentage? A property-management company in the area should have these aggregated.
- How much new for-sale + rental construction is in the pipeline within 1–3 miles? Heavy new supply typically softens prices + rents 12–24 months out; constrained supply supports both.
Investment metrics
- 1% rule
- 2.27% ✓
- Cap rate
- 19.48%
- Cash-on-cash
- 47.10%
- DSCR
- 3.10
- GRM
- 3.7
CMA / ARV
- ARV (median comp)
- $128,000
- List price
- $100,000
- Delta
- -21.88%
- Verdict
- UNDERPRICED
- Comps
- 7 within 1.0 mi
Show comp detail 8 sales within ~0.75 mi
| Address | Dist | Beds/Ba | Sqft | Sold | Price | $/sf | Match |
|---|---|---|---|---|---|---|---|
| 2845 E Hatch Rd #78 | 0.00mi | 2/2.0 | 1,440 (0%) | 3mo | $67,500 | $47 | 98 |
| 2845 E Hatch Rd #84 | 0.05mi | 3/2.0 (+1) | 1,440 (0%) | 1mo | $128,000 | $89 | 92 |
| 2845 E Hatch Rd #71 | 0.00mi | 3/2.0 (+1) | 1,440 (0%) | 22mo | $110,000 | $76 | 77 |
| 2845 E Hatch Rd #44 | 0.03mi | 3/2.0 (+1) | 1,400 (-3%) | 23mo | $160,000 | $114 | 70 |
| 2841 Fowler #37 | 0.59mi | 2/2.0 | 1,440 (0%) | 9mo | $105,000 | $73 | 65 |
| 2841 Fowler Rd #42 | 0.59mi | 3/2.0 (+1) | 1,287 (-11%) | 1mo | $145,000 | $113 | 49 |
| 2841 Fowler Rd #33 | 0.60mi | 3/2.0 (+1) | 1,248 (-13%) | 1mo | $145,000 | $116 | 44 |
| 2841 Fowler #141 | 0.59mi | 3/2.0 (+1) | 1,620 (+12%) | 12mo | $185,000 | $114 | 36 |
Match score weights: distance 35% · size 25% · config 20% · recency 20%. Top-matched comps best support the ARV.
Projected returns pro-forma
-3.0% appreciation · 3.0% rent growth · sell at horizon
- IRR
- 44.5%
- Equity multiple
- 2.92×
- Total profit
- $53,820
- Equity at exit
- $14,910
- IRR
- 50.4%
- Equity multiple
- 5.90×
- Total profit
- $137,128
- Equity at exit
- $8,646
Cash invested: $28,000 (down + closing). Projections, not guarantees.
Landlord ↔ Tenant lean methodology
- Overall (STATE)
- 18 Strongly Tenant-Friendly
- State California
- 18 Strongly Tenant-Friendly · D+13
- County
- — inherits STATE
- City
- — inherits STATE
ZIP-level market 95351
- Active inventory
- 109
- Price-to-rent
- 3.7×
Monthly cashflow live
- Estimated rent
- $2,266 high interval (Pro) →
- Mortgage (P&I)
- −$524
- Tax est. 1.5%
- −$125 /mo · $1,500/yr
- Insurance
- −$42
- HOA
- −$0
- Vacancy / Maint / Mgmt
- −$476
- Net cashflow
- $1,099
Break-even live
UW: 25.0% down · 7.5% · 30yr · 1.5% tax · 5.0% vac · 8.0% maint · 8.0% mgmt
Financing live
Cash to close
- Down payment
- $25,000
- Closing costs
- $3,000
- Reserves months
- —
- Total cash needed
- —
Loan-product check · same deal, 3 products live
Conventional
25% down · 7.5% · 30yr
- Down + closing
- —
- Monthly P&I
- —
- Monthly cashflow
- —
- DSCR
- —
- Eligible?
- —
Personal DTI + credit; lowest rate.
DSCR
20% down · 8.5% · 30yr
- Down + closing
- —
- Monthly P&I
- —
- Monthly cashflow
- —
- DSCR
- —
- Eligible?
- —
No personal income docs; deal must DSCR.
Hard money
10% down · 12.0% · 12mo
- Down + closing
- —
- Monthly P&I
- —
- Monthly cashflow
- —
- DSCR
- —
- Eligible?
- —
Short-term bridge; refi at stabilization.
Rent comps 7 comps
| Address | Beds | Baths | Sqft | Rent | $/sqft | DOM | Units | Dist |
|---|---|---|---|---|---|---|---|---|
| 2808 Canyon Dr Modesto, CA | 3.0 | 2.0 | 1366 | $2,495 | $1.83 | 21d | 1 | 0.14mi |
| 2685 Parkway Ceres, CA | 2.0 | 2.0 | 1150 | $795 | $0.69 | 43d | 1 | 0.41mi |
| 1120 Landreth Ct Modesto, CA | 3.0 | 2.0 | 1559 | $3,395 | $2.18 | 14d | 1 | 0.51mi |
| 2232 Ridgeway Dr Ceres, CA | 3.0 | 2.0 | 1432 | $2,295 | $1.60 | 14d | 1 | 0.74mi |
| 2029 Venus Dr Ceres, CA | 3.0 | 2.0 | 1336 | $2,500 | $1.87 | 23d | 1 | 0.85mi |
| 2121 Moffett Rd Ceres, CA | 2.0 | 1.0 | 900 | $1,450 | $1.61 | 43d | 1 | 0.96mi |
| 1301 Richland Ave Modesto, CA | 2.0 | 1.0–2.0 | 909 | $1,738 | $1.91 | 13d | 10 | 1.49mi |
Listing history 16 events
-
2026-06-18days on market $100,000 Active 92 DOM
-
2026-06-17days on market $100,000 Active 91 DOM
-
2026-06-16days on market $100,000 Active 90 DOM
-
2026-06-15days on market $100,000 Active 89 DOM
-
2026-06-14days on market $100,000 Active 87 DOM
-
2026-06-13days on market $100,000 Active 86 DOM
-
2026-06-10days on market $100,000 Active 84 DOM
-
2026-06-09days on market $100,000 Active 83 DOM
-
2026-06-08days on market $100,000 Active 82 DOM
-
2026-06-07days on market $100,000 Active 81 DOM
-
2026-06-05days on market $100,000 Active 78 DOM
-
2026-06-03days on market $100,000 Active 77 DOM
-
2026-06-02days on market $100,000 Active 76 DOM
-
2026-06-01days on market $100,000 Active 75 DOM
-
2026-05-31days on market $100,000 Active 74 DOM
-
2026-05-30days on market $100,000 Active 73 DOM
ⓘ Source: listings_history table (triggers on properties + properties_extension) + one-shot
backfill from property_details.listing_events for pre-trigger history.
Climate risk First Street
- Flood 1/10 Low FEMA zone X (unshaded) · 0% chance over 30 yrs
- Wildfire 4/10 Moderate
- Heat 6/10 Major 6 d/yr ≥102°F today · 13 d/yr by 30 yrs out
- Wind 1/10 Low
- Air quality 10/10 Extreme 34 unhealthy d/yr today · 37 by 30 yrs out
Nearby sold comps map
Loading sold comps map…
Walkable amenities ~0.75 mi
Loading nearby amenities…
Taxation est. · year 1
- Rental income
- $27,190
- − Mortgage interest
- −$5,602
- − Property taxes
- −$1,500
- − Insurance
- −$500
- − Repairs & maintenance
- −$2,175
- − Management
- −$2,175
- − Depreciation
- −$2,909
- Taxable income
- $12,329
- Est. tax owed @ 24.0%
- −$2,959
- After-tax cash flow
- $10,228/yr
For passive investors: Depreciation is non-cash, so a rental often shows a tax loss while cash-flowing — sheltering income. Rental losses are passive: they offset passive income freely, and up to $25,000/yr can offset ordinary (W-2) income if you actively participate and your MAGI is under $100k (phasing out to $0 by $150k); unused losses carry forward. On sale, claimed depreciation is recaptured at up to 25%, and gains may owe capital-gains tax (a 1031 exchange can defer both). Figures are a year-1 estimate at your 24.0% rate — not tax advice; consult a CPA.
Condition & rehab AI · 12 photos
This home is in average condition with cosmetic repairs needed. It offers a bright, open floor plan and is located in a desirable community. Updates to paint, cabinets, and flooring would significantly increase its value.
Repairs flagged
- Minor Kitchen cabinets — Worn appearance
- Minor Bathtub and fixtures — Signs of wear
- Minor Exterior siding — Aged appearance
- Minor Hardwood flooring — Worn appearance
- Minor Paint — Faded appearance
Value-add opportunities
- Both Paint interior walls — Fresh paint enhances curb appeal and interior aesthetics
- Both Replace worn kitchen cabinets — New cabinets improve functionality and appearance
- Both Replace worn hardwood flooring — New flooring enhances comfort and value
- Both Replace worn exterior siding — Fresh siding improves curb appeal and durability
- Both Paint exterior walls — Fresh paint enhances curb appeal and durability
Renovation cost estimate screening
| Repair item | Severity | Est. cost |
|---|---|---|
| Kitchen cabinets · Worn appearance | Minor | $500–3,000 |
| Bathtub and fixtures · Signs of wear | Minor | $500–3,000 |
| Exterior siding · Aged appearance | Minor | $500–3,000 |
| Hardwood flooring · Worn appearance | Minor | $500–3,000 |
| Paint · Faded appearance | Minor | $500–3,000 |
| Total estimated repair cost · 5 items | $2,500–15,000 |
Value-add ROI direction
- Both Paint interior walls — Fresh paint enhances curb appeal and interior aesthetics ↑
- Both Replace worn kitchen cabinets — New cabinets improve functionality and appearance ↑
- Both Replace worn hardwood flooring — New flooring enhances comfort and value ↑
- Both Replace worn exterior siding — Fresh siding improves curb appeal and durability ↑
- Both Paint exterior walls — Fresh paint enhances curb appeal and durability ↑
ⓘ Cost ranges are severity-bucket heuristics (US national rule-of-thumb). Get contractor quotes + a written scope before underwriting a rehab budget.
Schools (NCES district)
- District
- Ceres Unified
- NCES district ID
- 0608130
- Math proficiency
- 15% ▼ -9.00%
- Reading proficiency
- 50% ▲ 12.00%
- Median HH income
- $48,178
- Composite
- 27.96/100
- National rank
- #6858
- State rank
- #303 of 517 in CA
Livability — Ceres
- Score
- 54/100
- State rank
- #923
- US rank
- #24224
Category grades
Schools grade is shown separately in the Schools card above.
Census & demographics
- Census place
- Ceres, CA
- County
- Stanislaus County · 445,786 people
- City population
- 46,310
- Metro
- Modesto, CA
- Population (ZIP)
- 48,498
- Household income
- $58,275
- Rent vs Own
- Severe rent burden
- 1964.0
Population outlook (Stanislaus County) Hauer SSP2
- Today (2025)
- 579,493 people
- By 2030
- 598,000 · +3.2%
- By 2040
- 630,930 · +8.9%
- By 2050
- 658,300 · +13.6%
- By 2075
- 712,363 · +22.9%
- By 2100
- 719,805 · +24.2%
Race, ethnicity, and origin ACS 2023
- Neighborhood character
- Predominantly Hispanic (76%)
- Race & ethnicity
- Hispanic / Latino 76% Two or more races 40% White 13% Asian 5% Black 3% Native American 2%
- Hispanic origin (detail)
- Mexican 72%
- Common ancestry
- Russian 1% Lithuanian 1% Slovak 1%
- Foreign-born
- 30% · Canada
- Languages at home
- 34% English-only · Spanish 62% Other Asian/Pacific 2% Other Indo-European 1%
Political lean MEDSL · Stanislaus
- 2024 margin
- R (+11.0) · D 43.2% · R 54.2% · Other 2.6%
- 2008→2024 swing
- -12.7pp toward R · 2008: 1.7pp · 2024: -11.0pp
- All cycles
- 2024: R+11.0 2020: D+0.8 2016: D+0.6 2012: D+0.7 2008: D+1.7
Not yet ingested
- Civics
- —
Market trends
- HPI YoY
- ▼ -405.77%
- Current HPI
- 360.246
- Rent YoY
- —
- Metro
- Modesto, CA
- State GDP YoY
- ▲ 3.21%
- F500 in state
- 116
Industry mix (Fortune 500 HQ in CA)
| Industry | F500 HQs | Revenue |
|---|---|---|
| Technology | 27 | $1,492B |
|
||
| Financial Services | 3 | $174B |
|
||
| Retail | 3 | $44B |
|
||
| Insurance | 3 | $26B |
|
||
| Media / Entertainment | 2 | $115B |
|
||
| Pharmaceuticals / Biotech | 2 | $62B |
|
||
Cash-flow waterfall
monthlySold comps — $/sqft
last 12 mo · ≤1 miLoading sold comps…