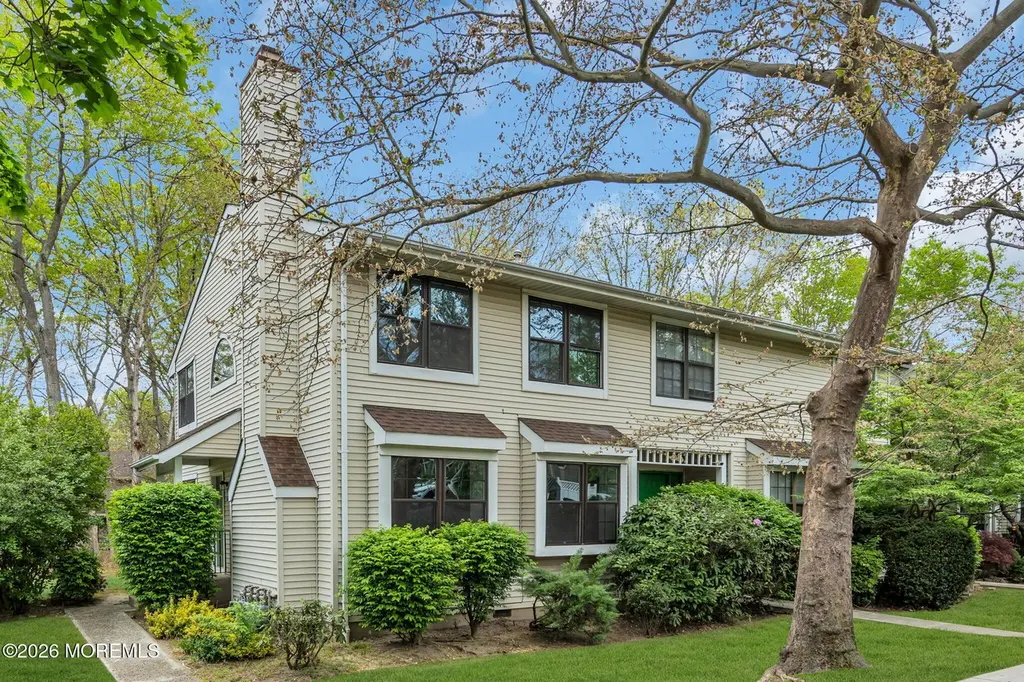
501 Santa Anita Ln · Toms River, NJ
Flood risk No data
- FEMA flood zone
- —
- Chance of flooding over 30 yrs
- —
- Est. flood insurance / yr
- —
Fire risk No data
- Est. fire insurance / yr
- —
Heat risk No data
- Hot days now (above threshold)
- —
- Hot days in 30 yrs
- —
Wind risk No data
- Chance of severe wind over 30 yrs
- —
Air-quality risk No data
- Unhealthy air days now
- —
- Unhealthy air days in 30 yrs
- —
Risk factors via First Street. Map © Google.
Why this score? — see what drove the C grade
The composite is a weighted blend of 9 inputs, each scored 0–100. Each bar is that input's sub-score; the figure is the points it added to the 100-point composite (weight × sub-score).
- Cash flow +23.7/30.0
- ARV discount +8.1/15.0
- DSCR +7.6/10.0
- 1% rule +7.2/10.0
- Livability +4.0/5.0
- Schools +2.9/10.0
- Rent growth +2.5/5.0
- Condition / age +2.5/5.0
- Appreciation +0.0/10.0
$339,000
🖨 Deal sheet (PDF) 📄 Offer letter ✓ Due diligence
Listing remarks
Rarely available renovated end-unit townhouse in the desirable Saratoga community. This 3-bedroom, 2.5-bathroom home features a modern interior with fresh paint and luxury vinyl plank flooring throughout. The bright white kitchen is appointed with quartz countertops, a custom tiled backsplash, a full stainless steel appliance package, and a peninsula with breakfast seating. Adjacent to the kitchen, the breakfast room offers sliders that lead to the backyard, which backs to a private, treed backdrop. The open-concept living and dining area is anchored by a wood-burning fireplace, perfect for entertaining. Upstairs, the primary bedroom includes a private ensuite bath, while the additional bed
Key facts
- $390 HOA
- 2 parking spots
- Community pool
Property features AI
Finance
- HOA & community: Monthly association fee (approximately $390); Association amenities: community room, pool, basketball court, clubhouse, playground; HOA covers trash, common area maintenance, lawn maintenance, pool, and snow removal
Exterior
- Parking: No garage spaces
- Utilities: Public sewer
- Home design: Condominium; Model: Equestrian - End unit
- Construction: Condominium construction (year built not provided)
- Exterior features: Shingle roof; End unit; Attached property (condominium)
Interior
- Kitchen: Dishwasher, Microwave, Stove, Refrigerator; Gas cooking
- Bedrooms: 3 bedrooms (located on second level)
- Flooring: Ceramic tile
- Bathrooms: 2 full bathrooms and 1 half bathroom
- Heating & cooling: Forced air heating; Central air conditioning
- Interior features: Dishwasher, Microwave, Stove, Refrigerator, Light fixtures; Fireplace; Ceramic tile floors; Crawl space basement; Living room; Dining room; Breakfast area
- Laundry & utility: Includes standard utility hookups (washer/dryer not specified)
Neighborhood map
What this means for you Summary
Snapshot
- This is a 3-bed/3.0-bath condo listed at $339k.
Deal economics
- At list price, monthly cash flow is $647 ($8k/yr) — positive.
- The deal already cash-flows at list — no discount required.
- Meets the 1% rule at list price ($4k rent vs $339k).
- Recommended offer: $334k (1.5% below list) — sets the bar for market timing.
- Cap rate 8.6% vs local median 3.8% in Toms River — top-decile yield for the area; either an underpriced asset or a hidden risk that comps aren't pricing in. Stress-test before assuming the spread holds.
Location & tenants
- Location reads 81/100 on livability (#61 in NJ, #1,538 nationally) — a professional / high-income tenant draw. Strengths: employment A+, housing A+, health & safety A+; Watch: commute D, cost of living F.
- Toms River Regional School District (suburban): math 18% / reading 44% proficiency, ranked #316 of 472 in NJ (top 67%) — families likely to look elsewhere, expect single-tenant / working-renter base with shorter leases.
- Market conditions: 265 active listings in the ZIP; 3 comparable units currently listed for rent nearby; rentals leasing fast (median 0d on market — plan ~1-2 weeks tenant-placement turnaround); solid renter incomes; 4,434 units permitted in Ocean County in 2024 (868 in 5+ unit buildings).
- At $4,132/mo this rent would consume 57% of the median local household income ($88k/yr) (locally 529% of renters already pay >50% of income on rent) — very limited rent-growth headroom before tenants either downsize or default.
Forward outlook
- Local home prices are declining (-3.0%/yr); year-one equity from $2k of loan paydown is wiped out by about $10k of value loss. Plan a longer hold.
- Ocean County population projected to shrink 8% by 2050 — rents likely to lag national; underwrite the cash flow, not the appreciation.
Negotiation context
- It's been on market 16 days — a 2% lower offer ($334k) is reasonable based on typical stale-listing flexibility.
- Current owner paid $79k; list at $339k implies a 329% gain — meaningful room to come down on a strong offer.
Questions for the listing agent
- What does the HOA fee cover, when was the last increase, and are there any pending special assessments or reserve-fund shortfalls?
- Any open or pending special assessments — roof, HVAC, plumbing, elevator, façade? What's the per-unit balance and payoff schedule, and is the seller paying it off at close or rolling it to the buyer?
- Is there a deadline driving the sale (1031 exchange, divorce, estate, relocation)? That informs how much negotiation room exists.
- What's the average days-on-market for RENTAL listings here right now (not sales)? A rising rental-DOM trend means longer vacancies and softer asking-rent achievability than the comps imply.
- What's the recent tenant-quality profile in this submarket — average credit score on applications, eviction rate, late-payment / NSF rate, and stable-employment percentage? A property-management company in the area should have these aggregated.
- How much new apartment / multifamily construction is in the pipeline within 1–3 miles? Heavy new supply (>2% of stock underway) typically softens rents 12–24 months out; light construction supports rent growth.
Investment metrics
- 1% rule
- 1.22% ✓
- Cap rate
- 8.58%
- Cash-on-cash
- 8.18%
- DSCR
- 1.36
- GRM
- 6.8
CMA / ARV
- ARV (median comp)
- $343,853
- List price
- $339,000
- Delta
- -1.41%
- Verdict
- FAIR
- Comps
- 20 within 1.0 mi
Projected returns pro-forma
-3.0% appreciation · 3.0% rent growth · sell at horizon
- IRR
- -3.8%
- Equity multiple
- 0.86×
- Total profit
- $-13,495
- Equity at exit
- $50,546
- IRR
- 6.0%
- Equity multiple
- 1.45×
- Total profit
- $42,247
- Equity at exit
- $29,311
Cash invested: $94,920 (down + closing). Projections, not guarantees.
Landlord ↔ Tenant lean methodology
- Overall (STATE)
- 21 Tenant-Leaning
- State New Jersey
- 21 Tenant-Leaning · D+6
- County
- — inherits STATE
- City
- — inherits STATE
ZIP-level market 08755
- Active inventory
- 265
- Price-to-rent
- 6.8×
Monthly cashflow live
- Estimated rent
- $4,132 medium interval (Pro) →
- Mortgage (P&I)
- −$1,778
- Tax from tax record
- −$308 /mo · $3,697/yr
- Insurance
- −$141
- HOA
- −$390
- Vacancy / Maint / Mgmt
- −$868
- Net cashflow
- $647
Break-even live
Sensitivity live
| Price | -10% $839 | -5% $743 | +0% $647 | +5% $551 | +10% $455 |
|---|---|---|---|---|---|
| Rent | -10% $321 | -5% $484 | +0% $647 | +5% $810 | +10% $973 |
| Rate | -1.0pp $818 | -0.5pp $733 | base $647 | +0.5pp $559 | +1.0pp $470 |
UW: 25.0% down · 7.5% · 30yr · 1.5% tax · 5.0% vac · 8.0% maint · 8.0% mgmt
Financing live
Cash to close
- Down payment
- $84,750
- Closing costs
- $10,170
- Reserves months
- —
- Total cash needed
- —
Loan-product check · same deal, 3 products live
Conventional
25% down · 7.5% · 30yr
- Down + closing
- —
- Monthly P&I
- —
- Monthly cashflow
- —
- DSCR
- —
- Eligible?
- —
Personal DTI + credit; lowest rate.
DSCR
20% down · 8.5% · 30yr
- Down + closing
- —
- Monthly P&I
- —
- Monthly cashflow
- —
- DSCR
- —
- Eligible?
- —
No personal income docs; deal must DSCR.
Hard money
10% down · 12.0% · 12mo
- Down + closing
- —
- Monthly P&I
- —
- Monthly cashflow
- —
- DSCR
- —
- Eligible?
- —
Short-term bridge; refi at stabilization.
Rent comps 3 comps
| Address | Beds | Baths | Sqft | Rent | $/sqft | DOM | Units | Dist |
|---|---|---|---|---|---|---|---|---|
| 2556 Woodland Rd Manchester, NJ | 3.0 | 2.0 | 1409 | $3,500 | $2.48 | 14d | 1 | 0.97mi |
| 2556 Woodland Rd Manchester, NJ | 3.0 | 2.0 | 1409 | $3,500 | $2.48 | 0d | 1 | 0.97mi |
| 100 Jumper Dr Toms River, NJ | 2.0–3.0 | 2.0–2.5 | 1642 | $5,391 | $3.28 | 0d | 23 | 1.00mi |
HOA detail condo
- Monthly dues
- $390 · $4,680/yr
- Assessments
- None detected in remarks — confirm with the listing agent.
Listing history 4 events
-
2026-05-08$339,000 Active 1084-char remark
-
2026-05-02historical $339,000 1084-char remark
-
1997-12-04soldstatus $79,000
-
1987-12-23soldstatus $102,850
ⓘ Source: listings_history table (triggers on properties + properties_extension) + one-shot
backfill from property_details.listing_events for pre-trigger history.
Tax reassessment forecast NJ · Partial reset (capped growth)
- Current annual tax
- $3,697 · $308/mo
- Projected year-2 tax
- $6,069 · $506/mo
- Expected delta
- +$2,372/yr (+$198/mo · 64.2%)
ⓘ Screening estimate from a state-policy table — verify with the county assessor before closing.
Nearby sold comps map
Loading sold comps map…
Walkable amenities ~0.75 mi
Loading nearby amenities…
Taxation est. · year 1
- Rental income
- $49,581
- − Mortgage interest
- −$18,989
- − Property taxes
- −$3,697
- − Insurance
- −$1,695
- − Repairs & maintenance
- −$3,966
- − Management
- −$3,966
- − HOA
- −$4,680
- − Depreciation
- −$9,862
- Taxable income
- $2,725
- Est. tax owed @ 24.0%
- −$654
- After-tax cash flow
- $7,110/yr
For passive investors: Depreciation is non-cash, so a rental often shows a tax loss while cash-flowing — sheltering income. Rental losses are passive: they offset passive income freely, and up to $25,000/yr can offset ordinary (W-2) income if you actively participate and your MAGI is under $100k (phasing out to $0 by $150k); unused losses carry forward. On sale, claimed depreciation is recaptured at up to 25%, and gains may owe capital-gains tax (a 1031 exchange can defer both). Figures are a year-1 estimate at your 24.0% rate — not tax advice; consult a CPA.
Schools (NCES district)
- District
- Toms River Regional School District
- NCES district ID
- 3416230
- Math proficiency
- 18% ▼ -19.00%
- Reading proficiency
- 44% ▼ -10.00%
- Median HH income
- $72,370
- Composite
- 29.07/100
- National rank
- #6602
- State rank
- #316 of 472 in NJ
Livability — Toms River
- Score
- 81/100
- State rank
- #61
- US rank
- #1538
Category grades
Schools grade is shown separately in the Schools card above.
Census & demographics
- Census place
- Toms River, NJ
- County
- Ocean County · 439,426 people
- City population
- 131,205
- Metro
- New York-Newark-Jersey City, NY-NJ-PA
- Population (ZIP)
- 29,670
- Household income
- $87,575
- Rent vs Own
- Severe rent burden
- 529.0
Population outlook (Ocean County) Hauer SSP2
- Today (2025)
- 586,991 people
- By 2030
- 581,403 · -1.0%
- By 2040
- 564,913 · -3.8%
- By 2050
- 538,149 · -8.3%
- By 2075
- 468,845 · -20.1%
- By 2100
- 350,297 · -40.3%
Race, ethnicity, and origin ACS 2023
- Neighborhood character
- Predominantly White (73%)
- Race & ethnicity
- White 73% Hispanic / Latino 11% Black 9% Two or more races 8% Asian 4%
- Hispanic origin (detail)
- Puerto Rican 6%
- Common ancestry
- Romanian 5% Italian 2% Scotch-Irish 2%
- Foreign-born
- 10% · Canada, Jamaica, South Korea
- Languages at home
- 84% English-only · Spanish 7% Other Indo-European 2% Tagalog/Filipino 2%
Political lean MEDSL · Ocean
- 2024 margin
- Solid R (+36.0) · D 31.4% · R 67.4% · Other 1.2%
- 2008→2024 swing
- -17.6pp toward R · 2008: -18.4pp · 2024: -36.0pp
- All cycles
- 2024: R+36.0 2020: R+28.7 2016: R+34.0 2012: R+17.7 2008: R+18.4
Not yet ingested
- Civics
- —
Market trends
- HPI YoY
- ▼ -223.51%
- Current HPI
- 303.2721
- Rent YoY
- —
- Metro
- New York-Newark-Jersey City, NY-NJ-PA
- State GDP YoY
- ▲ 2.05%
- F500 in state
- 34
Industry mix (Fortune 500 HQ in NJ)
| Industry | F500 HQs | Revenue |
|---|---|---|
| Consumer Goods | 3 | $31B |
|
||
| Pharmaceuticals | 2 | $153B |
|
||
| Technology | 2 | $21B |
|
||
| Insurance | 2 | $20B |
|
||
| Healthcare | 2 | $19B |
|
||
| Financial Services | 1 | $70B |
|
||
Price history
+229.6% since first listed5 events — show timeline
- 2026-05-24 Pending — MOMLS
- 2026-05-08 Listed $339,000 MOMLS
- 2026-05-02 Coming Soon $339,000 MOMLS
- 1997-12-04 Sold (Public Records) $79,000 Public Records
- 1987-12-23 Sold (Public Records) $102,850 Public Records
Property tax history
+2.4%/yrLatest (2025): $3,697 · +7.3% YoY. Source: county tax records.
Cash-flow waterfall
monthlySold comps — $/sqft
last 12 mo · ≤1 miLoading sold comps…