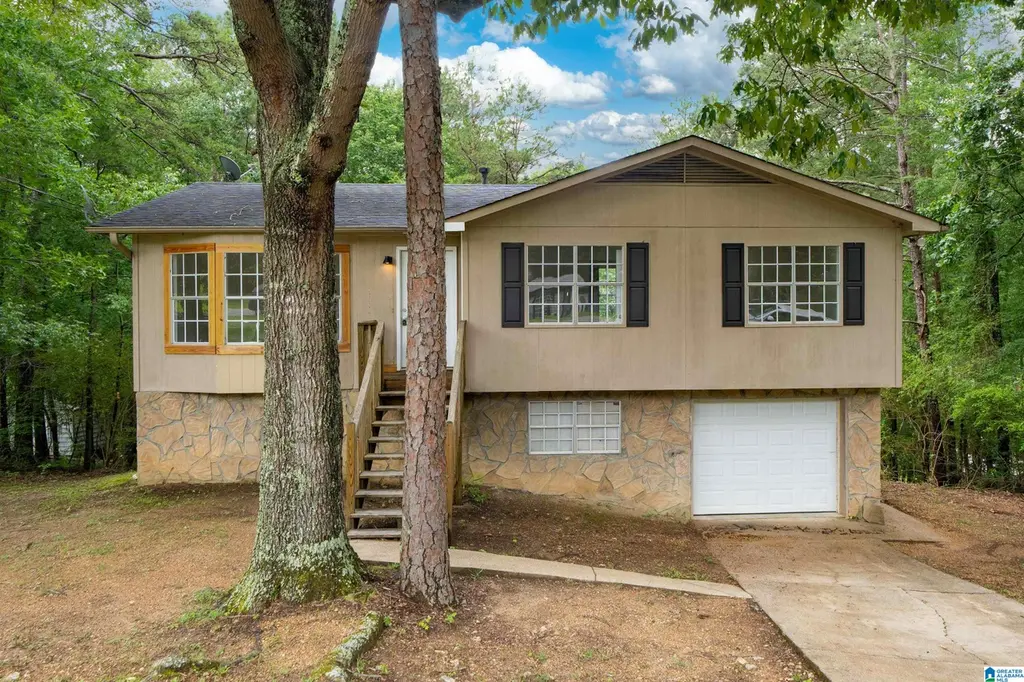
6408 Telia Dr · Clay, AL
Flood risk 1/10 · Minimal
- FEMA flood zone
- X (unshaded)
- Chance of flooding over 30 yrs
- 0.0%
- Est. flood insurance / yr
- $473 – $860
Fire risk 3/10 · Minor
- Est. fire insurance / yr
- $916 – $1,700
Heat risk 5/10 · Moderate
- Hot days now (above 106°F)
- 7 days/yr
- Hot days in 30 yrs
- 19 days/yr
Wind risk 6/10 · Moderate
- Chance of severe wind over 30 yrs
- 27.0%
Air-quality risk 5/10 · Moderate
- Unhealthy air days now
- 6 days/yr
- Unhealthy air days in 30 yrs
- 9 days/yr
Risk factors via First Street. Map © Google.
Why this score? — see what drove the D- grade
The composite is a weighted blend of 9 inputs, each scored 0–100. Each bar is that input's sub-score; the figure is the points it added to the 100-point composite (weight × sub-score).
- Cash flow +15.6/30.0
- DSCR +4.8/10.0
- Livability +3.8/5.0
- 1% rule +3.6/10.0
- Rent growth +2.9/5.0
- Condition / age +2.5/5.0
- Schools +1.8/10.0
- ARV discount +0.0/15.0
- Appreciation +0.0/10.0
$185,000
🖨 Deal sheet (PDF) 📄 Offer letter ✓ Due diligence
Listing remarks
Welcome home to this well-maintained 3-bedroom, 2-bath residence offering the convenience of all one-level living in a peaceful cul-de-sac setting. Enjoy a functional floor plan with comfortable living spaces and plenty of room to make it your own. The full, unfinished basement provides excellent storage or future expansion potential and includes a convenient 1-car basement garage. Recent updates, per seller, include: Stove ~ 2026 Flooring ~ 2026 Interior Paint ~ 2026 Dishwasher ~ 2024 Deck ~ 2023 Gas Hot Water Heater ~ 2021 Step outside and relax on the newer deck, perfect for entertaining, grilling, or enjoying your morning coffee. The cul-de-sac location offers reduced traffic and a ne
Key facts
- One-level living
- Newer deck
- Cul-de-sac setting
Tags
Property features AI
Finance
- Other: Lot size approximately 0.36 acres; Subdivision: Cosby Hills; Flood plain: No; Historic register: No
- Financial info: Fire fee billed quarterly ($75); Garbage fee billed quarterly ($60)
Exterior
- Parking: Front garage entry; Basement parking; 1 total garage space (1 in basement)
- Utilities: Public water; Septic system; Gas water heater; Internet available (Spectrum)
- Home design: Wood construction; Basement foundation; Existing home
- Construction: Wood construction; Basement foundation
- Exterior features: Open deck; No pool; No patio; No garden/patio; Not waterfront
Interior
- Kitchen: Laminate countertops; Built-in dishwasher; Electric stove
- Bedrooms: Master bedroom on main level; Additional bedrooms on main level
- Flooring: Hardwood; Laminate
- Bathrooms: Two full bathrooms; Separate shower; Tub/shower combination
- Heating & cooling: Central heating; Gas heat; Central air conditioning (electric)
- Interior features: Smooth ceilings; Other ceiling details (see remarks); Tri-level: No; Split level: No; Split foyer: No; Unfinished basement; Daylight basement; Basement is all unfinished
- Laundry & utility: Laundry located in the basement (garage area); Utilities in garage; Dryer hookup: Electric
Neighborhood map
What this means for you Summary
Snapshot
- This is a 3-bed/2.0-bath single-family listed at $185k.
Deal economics
- At list price, monthly cash flow is $78 ($940/yr) — positive.
- The deal already cash-flows at list — no discount required.
- To meet the 1% rule (rent ≥ 1% of price), the offer needs to be $159k (13.9% below list).
- Recommended offer: $159k (13.9% below list) — sets the bar for 1% rule.
- Cap rate 6.8% vs local median 4.7% in Clay — top-decile yield for the area; either an underpriced asset or a hidden risk that comps aren't pricing in. Stress-test before assuming the spread holds.
Location & tenants
- Location reads 75/100 on livability (#16 in AL, #3,849 nationally) — a middle-class / working-renter tenant base. Strengths: cost of living A+, housing A+, employment A-; Watch: amenities F, commute F.
- Jefferson County (suburban): math 9% / reading 32% proficiency, ranked #104 of 129 in AL (top 81%) — low school quality limits family demand, transient renter base, plan for 1-2y turnover.
- Zoned schools: Pinson Elementary School (801 students, 54% FRL); Rudd Middle School (math 0% / reading 26%, grade F, #214 of 257 statewide, top 83%, 667 students, 61% FRL); Pinson Valley High School (math 6% / reading 17%, grade F, #246 of 305 statewide, top 81%, 1,029 students, 81% FRL) — zoned schools average 66% FRL vs 49% district-wide (17 pts higher); higher-poverty schools than district average — tighter screening recommended.
- Market conditions: Rents rising (+1.6%/yr); 183 active listings in the ZIP; 9 comparable units currently listed for rent nearby; rentals at typical pace (median 26d on market — plan ~3-4 weeks tenant-placement turnaround); solid renter incomes; 2,114 units permitted in Jefferson County in 2024 (556 in 5+ unit buildings).
Forward outlook
- Local home prices are declining (-3.0%/yr); year-one equity from $1k of loan paydown is wiped out by about $6k of value loss. Plan a longer hold.
- Jefferson County population projected to shrink 4% by 2050 — rents likely to lag national; underwrite the cash flow, not the appreciation.
Negotiation context
- Only 12 days on market — expect competitive offers; lowballing is unlikely to land.
- Current owner paid $53k; list at $185k implies a 247% gain — meaningful room to come down on a strong offer.
Risks & watch-outs
- Climate carrying-cost: major wind risk, 27% chance of damaging wind over 30y; extreme-heat days projected 7→19/yr by 2055 (HVAC capex compounding) — expect insurance premiums to compound above CPI over the hold.
Questions for the listing agent
- Is there a deadline driving the sale (1031 exchange, divorce, estate, relocation)? That informs how much negotiation room exists.
- The area grade is low — what's the realistic commute time and amenity access for the typical tenant pool here? Any planned neighborhood developments (good or bad) we should know about?
- What's the average days-on-market for RENTAL listings here right now (not sales)? A rising rental-DOM trend means longer vacancies and softer asking-rent achievability than the comps imply.
- What's the recent tenant-quality profile in this submarket — average credit score on applications, eviction rate, late-payment / NSF rate, and stable-employment percentage? A property-management company in the area should have these aggregated.
- How much new for-sale + rental construction is in the pipeline within 1–3 miles? Heavy new supply typically softens prices + rents 12–24 months out; constrained supply supports both.
Investment metrics
- 1% rule
- 0.86% ✗
- Cap rate
- 6.80%
- Cash-on-cash
- 1.81%
- DSCR
- 1.08
- GRM
- 9.7
CMA / ARV
- ARV (on-the-fly)
- $158,387
- Comps found
- 4
Show comp detail 4 sales within ~0.75 mi
| Address | Dist | Beds/Ba | Sqft | Sold | Price | $/sf | Match |
|---|---|---|---|---|---|---|---|
| 5933 Dewey Heights Rd | 0.29mi | 3/2.0 | 1,085 (+2%) | 9mo | $169,900 | $157 | 76 |
| 6602 Womack Rd | 0.32mi | 3/2.0 | 1,008 (-5%) | 2mo | $147,000 | $146 | 75 |
| 5659 Cheryl Dr | 0.29mi | 3/2.0 | 1,008 (-5%) | 10mo | $150,000 | $149 | 70 |
| 5949 Dewey Heights Rd | 0.30mi | 3/2.0 | 1,209 (+14%) | 3mo | $159,900 | $132 | 61 |
Match score weights: distance 35% · size 25% · config 20% · recency 20%. Top-matched comps best support the ARV.
Projected returns pro-forma
-3.0% appreciation · 1.61% rent growth · sell at horizon
- IRR
- -14.9%
- Equity multiple
- 0.47×
- Total profit
- $-27,222
- Equity at exit
- $27,584
- IRR
- -8.6%
- Equity multiple
- 0.49×
- Total profit
- $-26,193
- Equity at exit
- $15,995
Cash invested: $51,800 (down + closing). Projections, not guarantees.
Landlord ↔ Tenant lean methodology
- Overall (STATE)
- 90 Strongly Landlord-Friendly
- State Alabama
- 90 Strongly Landlord-Friendly · R+15
- County
- — inherits STATE
- City
- — inherits STATE
ZIP-level market 35126
- Home prices YoY
- -22.4%
- Rents YoY
- 1.6%
- Active inventory
- 183
- Price-to-rent
- 9.7×
Monthly cashflow live
- Estimated rent
- $1,592 high interval (Pro) →
- Mortgage (P&I)
- −$970
- Tax from tax record
- −$132 /mo · $1,586/yr
- Insurance
- −$77
- HOA
- −$0
- Vacancy / Maint / Mgmt
- −$334
- Net cashflow
- $78
Break-even live
Sensitivity live
| Price | -10% $183 | -5% $131 | +0% $78 | +5% $26 | +10% $-26 |
|---|---|---|---|---|---|
| Rent | -10% $-47 | -5% $15 | +0% $78 | +5% $141 | +10% $204 |
| Rate | -1.0pp $172 | -0.5pp $125 | base $78 | +0.5pp $30 | +1.0pp $-18 |
UW: 25.0% down · 7.5% · 30yr · 1.5% tax · 5.0% vac · 8.0% maint · 8.0% mgmt
Financing live
Cash to close
- Down payment
- $46,250
- Closing costs
- $5,550
- Reserves months
- —
- Total cash needed
- —
Loan-product check · same deal, 3 products live
Conventional
25% down · 7.5% · 30yr
- Down + closing
- —
- Monthly P&I
- —
- Monthly cashflow
- —
- DSCR
- —
- Eligible?
- —
Personal DTI + credit; lowest rate.
DSCR
20% down · 8.5% · 30yr
- Down + closing
- —
- Monthly P&I
- —
- Monthly cashflow
- —
- DSCR
- —
- Eligible?
- —
No personal income docs; deal must DSCR.
Hard money
10% down · 12.0% · 12mo
- Down + closing
- —
- Monthly P&I
- —
- Monthly cashflow
- —
- DSCR
- —
- Eligible?
- —
Short-term bridge; refi at stabilization.
Rent comps 9 comps
| Address | Beds | Baths | Sqft | Rent | $/sqft | DOM | Units | Dist |
|---|---|---|---|---|---|---|---|---|
| 6541 Womack Rd Pinson, AL | 3.0 | 2.0 | 1146 | $1,470 | $1.28 | 25d | 1 | 0.20mi |
| 6568 Davison Rd Pinson, AL | 3.0 | 2.0 | 1054 | $1,435 | $1.36 | 45d | 1 | 0.28mi |
| 5653 Cheryl Dr Pinson, AL | 3.0 | 2.0 | 1015 | $1,220 | $1.20 | 13d | 1 | 0.29mi |
| 6594 Davison Rd Pinson, AL | 3.0 | 2.0 | 1304 | $1,650 | $1.27 | 25d | 1 | 0.33mi |
| 6469 Chrissy Dr Pinson, AL | 3.0 | 2.0 | 1110 | $1,465 | $1.32 | 12d | 1 | 0.92mi |
| 6877 Briarwood Dr Pinson, AL | 3.0 | 2.0 | 1390 | $1,595 | $1.15 | 45d | 1 | 1.04mi |
| 5433 Faucett Rd Pinson, AL | 3.0 | 2.0 | 1148 | $1,395 | $1.22 | 12d | 1 | 1.08mi |
| 5421 Faucett Rd Pinson, AL | 3.0 | 2.0 | 1248 | $1,195 | $0.96 | 5d | 1 | 1.11mi |
| 5944 Tyler Loop Rd Pinson, AL | 3.0 | 2.0 | 1247 | $1,485 | $1.19 | 25d | 1 | 1.30mi |
Listing history 8 events
-
2026-06-22days on market $185,000 Active 12 DOM
-
2026-06-18days on market $185,000 Active 9 DOM
-
2026-06-17days on market $185,000 Active 8 DOM
-
2026-06-16days on market $185,000 Active 7 DOM
-
2026-06-15days on market $185,000 Active 6 DOM
-
2026-06-13days on market $185,000 Active 4 DOM
-
2026-06-10remarks 699-char remark
-
2026-06-10$185,000 Active 1 DOM
ⓘ Source: listings_history table (triggers on properties + properties_extension) + one-shot
backfill from property_details.listing_events for pre-trigger history.
Tax reassessment forecast AL · Resets to sale price
- Current annual tax
- $1,586 · $132/mo
- Projected year-2 tax
- $1,586 · $132/mo
- Expected delta
- $0/yr ($0/mo · 0.0%)
ⓘ Screening estimate from a state-policy table — verify with the county assessor before closing.
Climate risk First Street
- Flood 1/10 Low FEMA zone X (unshaded) · 0% chance over 30 yrs
- Wildfire 3/10 Moderate
- Heat 5/10 Major 7 d/yr ≥106°F today · 19 d/yr by 30 yrs out
- Wind 6/10 Major 27% chance of damaging wind over 30 yrs
- Air quality 5/10 Major 6 unhealthy d/yr today · 9 by 30 yrs out
Nearby sold comps map
Loading sold comps map…
Walkable amenities ~0.75 mi
Loading nearby amenities…
Taxation est. · year 1
- Rental income
- $19,105
- − Mortgage interest
- −$10,363
- − Property taxes
- −$1,586
- − Insurance
- −$925
- − Repairs & maintenance
- −$1,528
- − Management
- −$1,528
- − Depreciation
- −$5,382
- Taxable loss
- −$2,207
- Est. tax savings @ 24.0%
- +$530
- After-tax cash flow
- $1,470/yr
For passive investors: Depreciation is non-cash, so a rental often shows a tax loss while cash-flowing — sheltering income. Rental losses are passive: they offset passive income freely, and up to $25,000/yr can offset ordinary (W-2) income if you actively participate and your MAGI is under $100k (phasing out to $0 by $150k); unused losses carry forward. On sale, claimed depreciation is recaptured at up to 25%, and gains may owe capital-gains tax (a 1031 exchange can defer both). Figures are a year-1 estimate at your 24.0% rate — not tax advice; consult a CPA.
Schools (NCES district)
- District
- Jefferson County
- NCES district ID
- 0101920
- Math proficiency
- 9% ▼ -24.00%
- Reading proficiency
- 32% ▼ -5.00%
- Median HH income
- $51,712
- Composite
- 18.4/100
- National rank
- #8937
- State rank
- #104 of 129 in AL
Livability — Clay
- Score
- 75/100
- State rank
- #16
- US rank
- #3849
Category grades
Schools grade is shown separately in the Schools card above.
Census & demographics
- County
- Jefferson County · 527,445 people
- Metro
- Birmingham-Hoover, AL
- Population (ZIP)
- 22,599
- Household income
- $83,732
- Rent vs Own
- Severe rent burden
- 267.0
Population outlook (Jefferson County) Hauer SSP2
- Today (2025)
- 669,185 people
- By 2030
- 669,694 · +0.1%
- By 2040
- 661,388 · -1.2%
- By 2050
- 643,086 · -3.9%
- By 2075
- 577,267 · -13.7%
- By 2100
- 474,758 · -29.1%
Race, ethnicity, and origin ACS 2023
- Neighborhood character
- Diverse neighborhood (Simpson 0.58)
- Race & ethnicity
- White 58% Black 28% Hispanic / Latino 8% Two or more races 7% Asian 2%
- Hispanic origin (detail)
- Mexican 5% Puerto Rican 1%
- Common ancestry
- Slovak 2% Lithuanian 1% Italian 1%
- Foreign-born
- 5% · Canada, China, Jamaica
- Languages at home
- 92% English-only · Spanish 5% Vietnamese 1% Chinese 0%
Political lean MEDSL · Jefferson
- 2024 margin
- D (+10.4) · D 54.6% · R 44.2% · Other 1.2%
- 2008→2024 swing
- +5.4pp toward D · 2008: 5.1pp · 2024: 10.4pp
- All cycles
- 2024: D+10.4 2020: D+13.2 2016: D+7.2 2012: D+6.0 2008: D+5.1
Not yet ingested
- Civics
- —
Market trends
- HPI YoY
- ▼ -54.52%
- Current HPI
- 188.6439
- Rent YoY
- ▲ 1.61%
- Metro
- Birmingham-Hoover, AL
- State GDP YoY
- ▲ 2.94%
- F500 in state
- 4
Industry mix (Fortune 500 HQ in AL)
| Industry | F500 HQs | Revenue |
|---|---|---|
| Financial Services | 1 | $8B |
|
||
| Healthcare | 1 | $5B |
|
||
Price history
+246.7% since first listed2 events — show timeline
- 2026-06-09 Listed $185,000 Greater Alabama MLS
- 1985-03-01 Sold (Public Records) $53,363 Public Records
Property tax history
+3.2%/yrLatest (2025): $1,586 · +0.0% YoY. Source: county tax records.
Cash-flow waterfall
monthlySold comps — $/sqft
last 12 mo · ≤1 miLoading sold comps…